Welcome back to the Visualization for Machine Learning Lab!
Week 11: Deep Learning
Miscellaneous
- I’m writing feedback for each of your project proposals - intending to post this weekend
- Homework 4 (OPTIONAL - extra credit) has been posted to Brightspace
- Amount of extra credit TBD
- Due April 19th
How to Write a Good Research Paper
- For your final paper, you will be presenting your project in the form of a research paper
- Let’s discuss the expectations for this paper…
Why Do We Care?
- The ability to clearly communicate your ideas to a specific audience is a necessary skill for any profession - not just academia!
- ML is a fast-paced field - research papers are where the the cool new insights are, and becoming more familiar with their structure will make that information more accessible to you
A Research Paper is a Persuasive Essay
- We often view science as a sort of objective truth, when actually it is a process of logical reasoning
- A good scientific research paper will present evidence to convince you of a conclusion - some people call this the “story” of the paper
- Remember you’re not just presenting a description of what you did - you’re building an argument to convince us why what you did is important and logical
Who Is Your Audience?
- You can usually assume some level of expertise in computer science in general and the subfield of the journal (e.g. data visualization), but not necessarily in your specific topic or application
- In this class, you can assume your readers are visualization and ML experts
Each Section Serves a Different Purpose
- Some sections of a research paper (especially the intro/related works/background) may seem redundant, but they each serve a different purpose even if there is some overlap in information
Typical Sections of a Research Paper
- Abstract
- Introduction
- Related Works
- Background/Design Goals/Data Description
- Methods
- Evaluation
- Conclusion/Limitations/Future Works
- Acknowledgements
- References
The Abstract
- The first impression of your paper
- Should provide an overview of each section of the paper in around 250 words
Parts of the Abstract
- Motivation: Why do we care about the problem and the results? This section should include the importance of your work, the difficulty of the area, and the impact it might have if successful.
Parts of the Abstract
- Motivation
- Problem statement: What problem are you trying to solve? What is the scope of your work (a generalized approach, or for a specific situation)? Be careful not to use too much jargon.
Parts of the Abstract
- Motivation
- Problem statement
- Approach: How did you go about solving or making progress on the problem? What important variables did you control, ignore, or measure?
Parts of the Abstract
- Motivation
- Problem statement
- Approach
- Results: What’s the answer? Put the result there, in numbers. Avoid vague, hand-waving results such as “very”, “small”, or “significant.”
Parts of the Abstract
Motivation
Problem statement
Approach
Results
Conclusions: What are the implications of your answer? Are your results general, potentially generalizable, or specific to a particular case?
Taken from this guide, which provides more detail
Example Abstract

Intro vs Related Works vs Background
- Many proposals conflated these three sections, but they each serve a different purpose
- Intro: what problem are you solving, why does it matter, and how are you solving it?
- Related works: how have other people tried to solve this problem before? What have we learned from those works?
- Background: The context necessary to understand the work YOU have done, NOT a description related works. What is your data? What are your design goals?
The Introduction Section
- Describe the motivation behind your project
- Briefly describe how past works on this topic are insufficient
- Give an overview of your methods and contributions towards a solution to this problem
The Introduction Section
- Do
- Really sell the issue! You’re trying to convince your reader that this problem is actually important
- Don’t
- Delve into detail about any related works. Citations to back up general statements are okay.
What Are Contributions?
- Tangible products of the work described in the paper (e.g. a tool, insights in the form of case studies, expert feedback)
- Can be formatted as a bulleted list at the end of the Introduction
The Related Works Section
- Situates your work in the context of existing literature on the topic
- Synthesizes the results of several related papers into each salient point the reader needs to know about your topic before they can understand your work
- Not a list of recaps of other papers!
Related Works - Bad Structure
We use the provided dataset by Piadyk et al. [1], which [rest of paragraph recaps StreetAware paper]
Smith et al. [2] presents a visualization tool for multi-object tracking…[rest of paragraph describes this one paper].
Zhu et al. [3] also present a visualization tool for multi-object tracking…[rest of paragraph describes this one paper].
Related Works - Bad Structure
(Don’t feel bad if you did this in your proposal - many groups did. That’s why we’re having this discussion, so the expectations are clear and improvements can be made in the final paper)
Related Works - Good Structure
Previous works have tackled the challenge of multi-object tracking (MoT) in several ways. Some have attempted Approach A [1, 2]. Others have built upon this with Approach B [3, 4, 5]. These works provided promising results, but some shortcomings left questions unanswered.
Several challenging aspects of MoT have both inhibited and inspired previous studies. Often scenes with many objects will involve some degree of motion, and objects may become occluded. Previous works have addressed this issue by doing X and Y [6, 7]. However, this approach is still insufficient because of….
Related Works - Good Structure
(You should of course be more specific than this - the point is that your paragraphs should be structured around previous approaches or challenges, not single papers)
The Background Section
- The context necessary to understand the work YOU have done - not related works
- In this case it will probably be a description of your data and design goals, but other papers may describe work done in previous papers by the authors
Wait, isn’t describing my data a description of a related work? Why are you telling me to put that in the background section?
- Goes in Related Works: The premise of the dataset paper and lessons learned from that work (e.g. “High resolution multimodal data collected in urban settings is difficult to collect and therefore not abundant. However, one example of this type of data is the StreetAware dataset [1], which…”)
- Goes in Background: A literal description of the data (e.g. “The dataset contains 120 videos in mp4 format, etc.”)
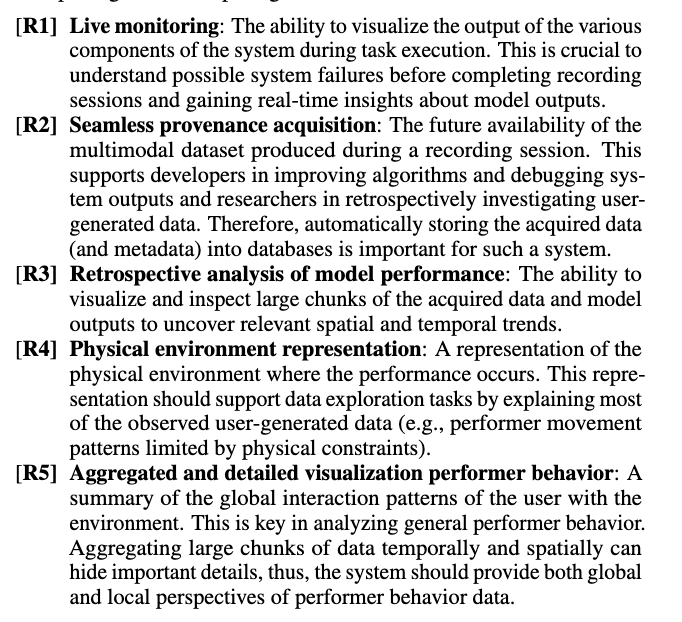
What Are Design Goals?
- A list of…
- What you hope to enable your users to do
- The types of insights you hope to provide them with
- This is not a description of your contributions or the specific features of your visualizations
What Are Design Goals?
The Methods Section
- This is where you explain your work
- Remember this is still part of a persuasive argument!
- You should be justifying WHY you did what you did as you explain it
- This justification can involve citing other works
Connecting Design Goals to Methods
- Each aspect of your final product (visualizations/tool/system) should address to at least one of your design goals
The Evaluation Section
- How do you know the approach described in your Methods section worked?
- Evaluation could be quantitative metrics or a qualitative analysis
- Could put case studies here or in their own section before this depending on what they are
- Other papers would put feedback from experts here (not required for this class)
What is a Case Study?
- A case study walks the reader through an example of how they could use approach to gain valuable insights
- Typically used to demonstrate value of a tool or system and/or justify design decisions
Case Study Example
- See Section 6.2 of this paper
The Conclusion Section
- Recap the contributions presented and why they are important
- Limitations
- Future works
Figures
- Often the first impression of your paper
- Should stand on their own as a complete thought without the body text
- Content of a figure can be reiterated in the body text, but you shouldn’t need to read the body text to understand what is going on in the figure
Common Types of Figures
- Teaser
- System architecture
- Explaining a specific component
- Walking the reader through a case study
Figure Design
- No plain screenshots!
- Annotations should guide the reader through what they’re looking at
- Be mindful of text size
- Needs to be clear that some thought went into the design
Bad Figure Design
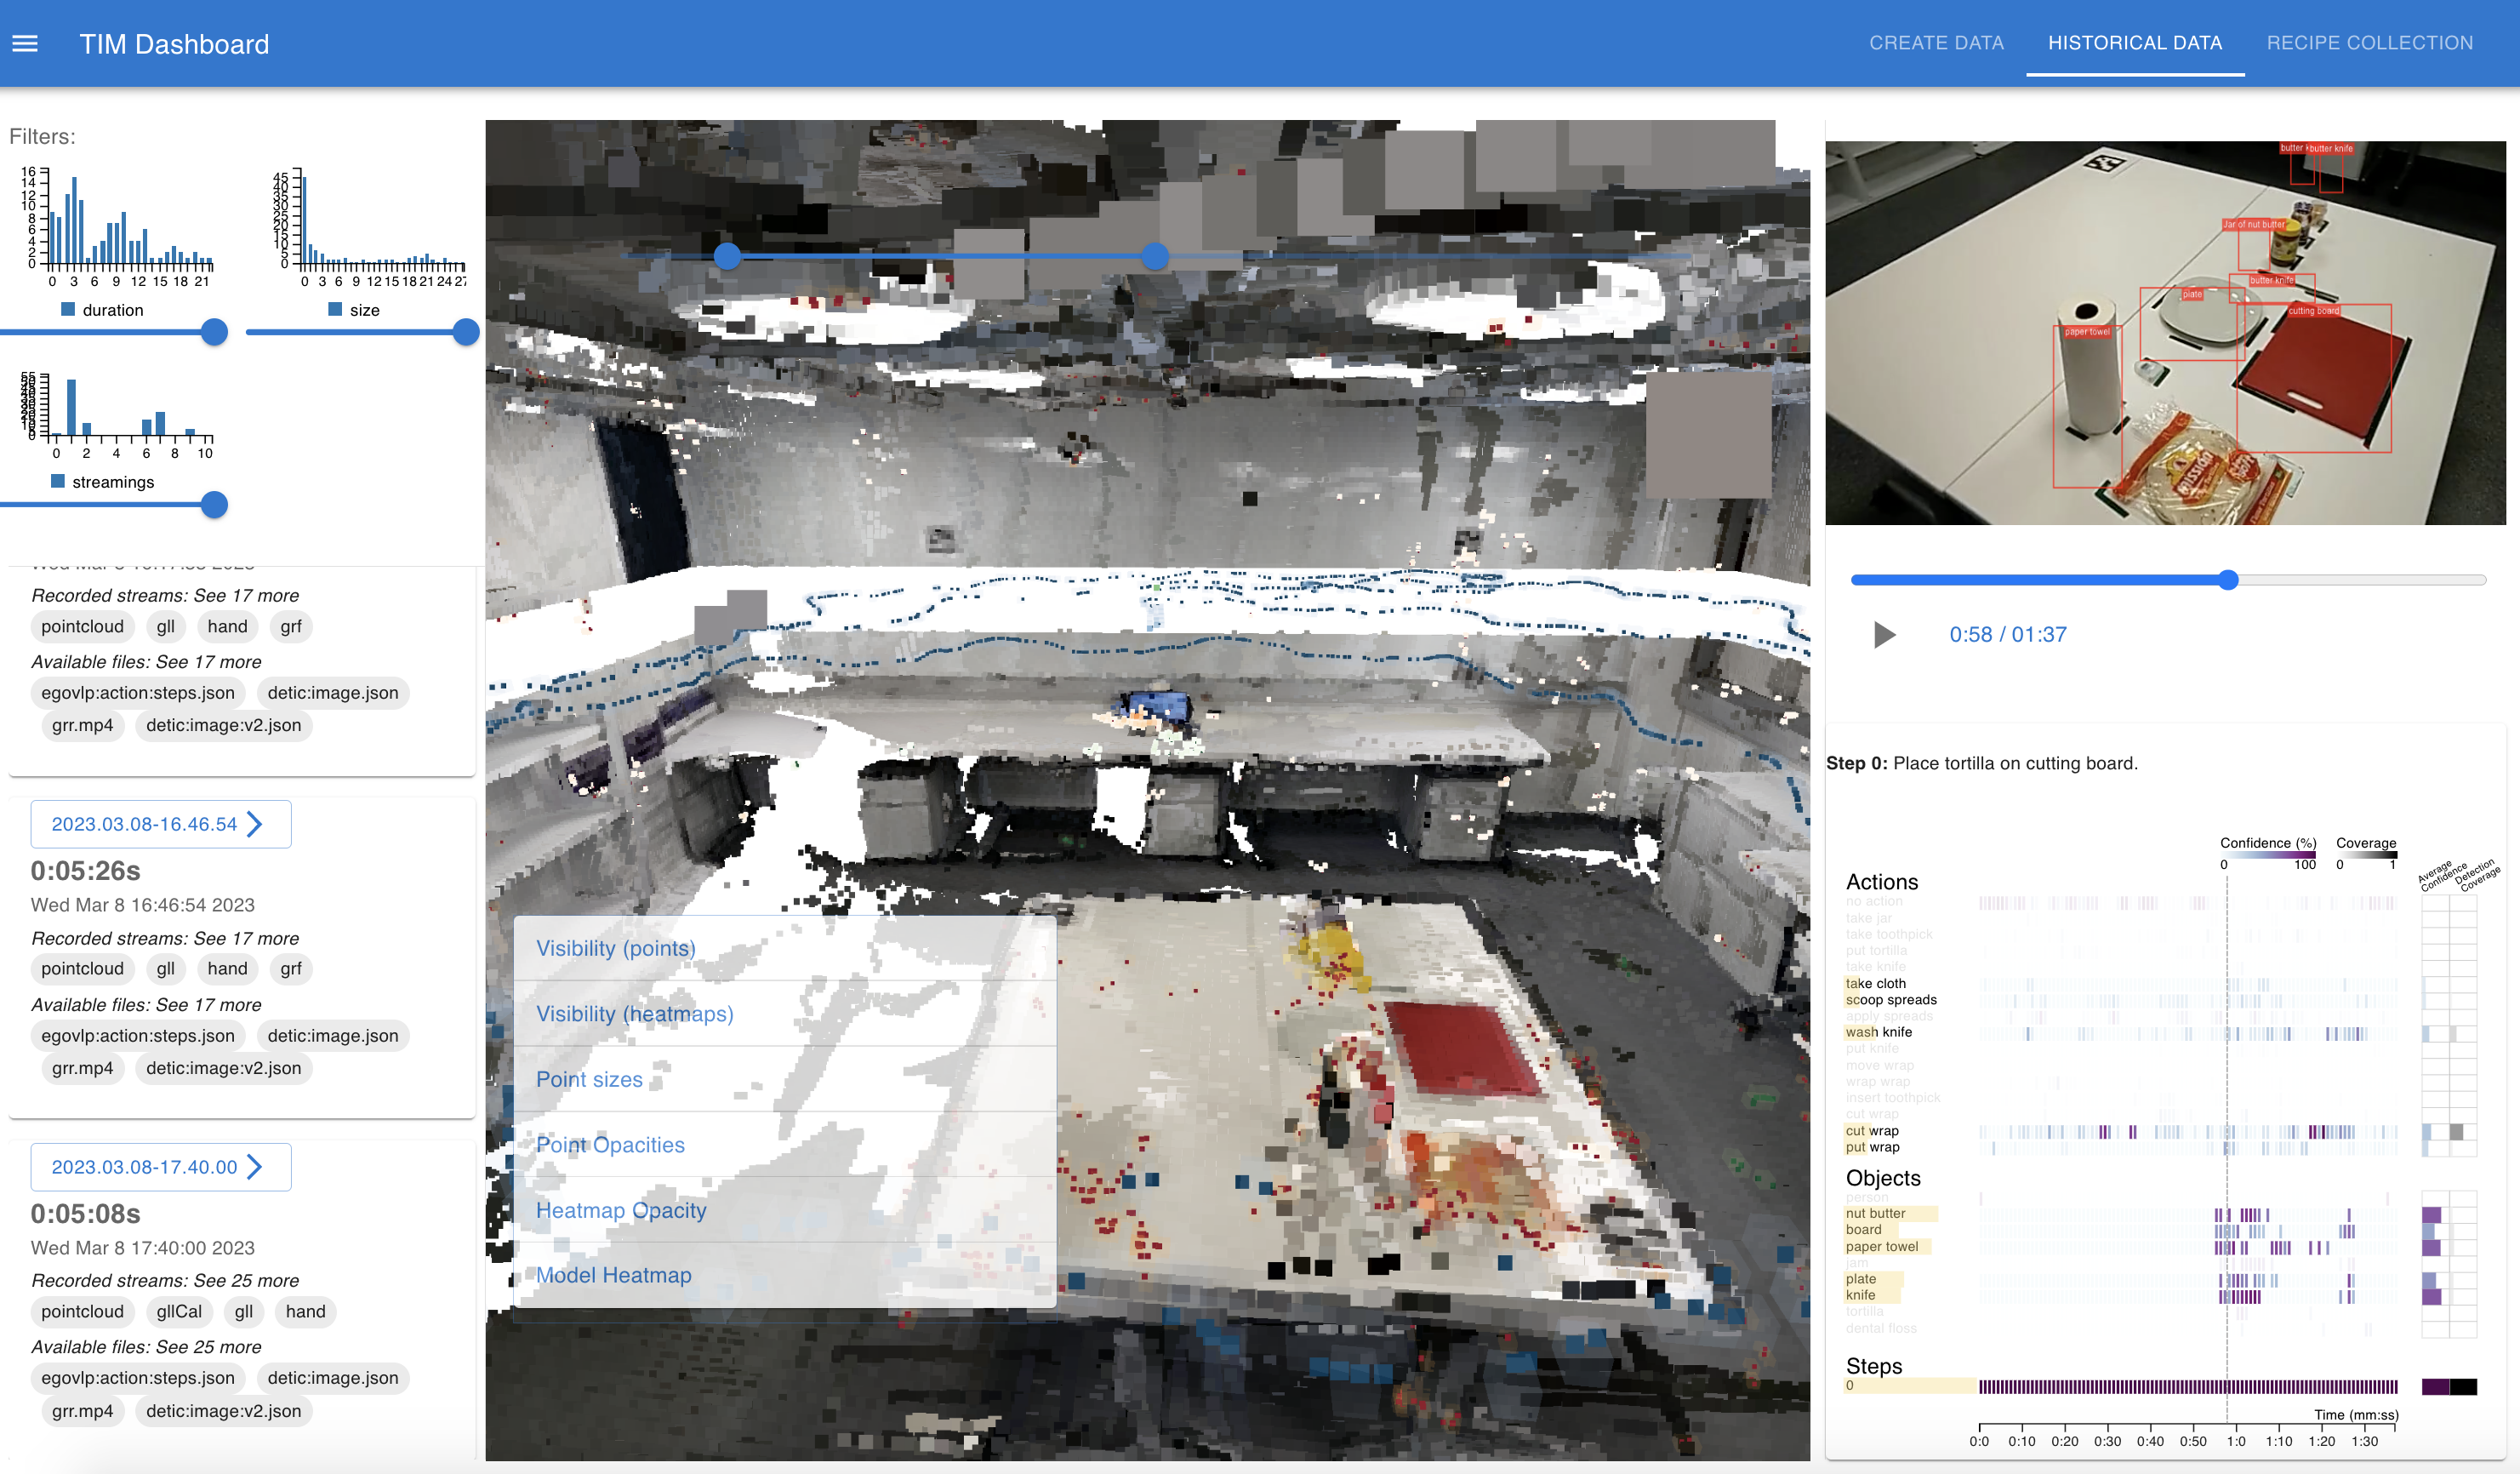 The interface of our tool.
Good Figure Design
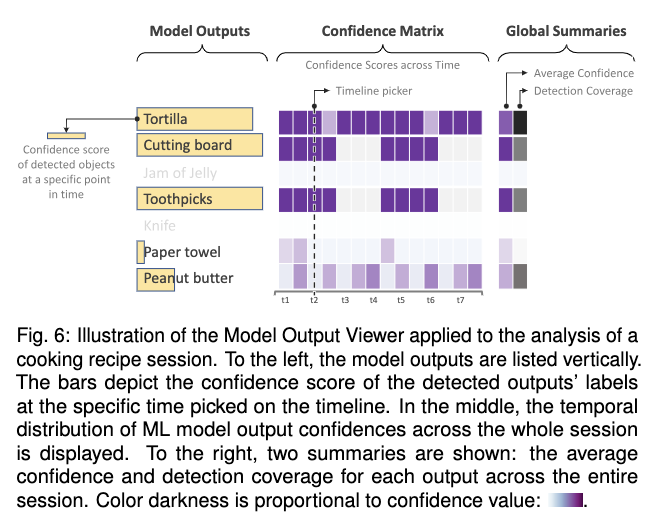
Using BibTeX
- This is the easiest way to format your bibliography and in-text citations
Using BibTeX
- Most papers have a “cite this” button with BibTeX as a format option

Using BibTeX
- Most papers have a “cite this” button with BibTeX as a format option
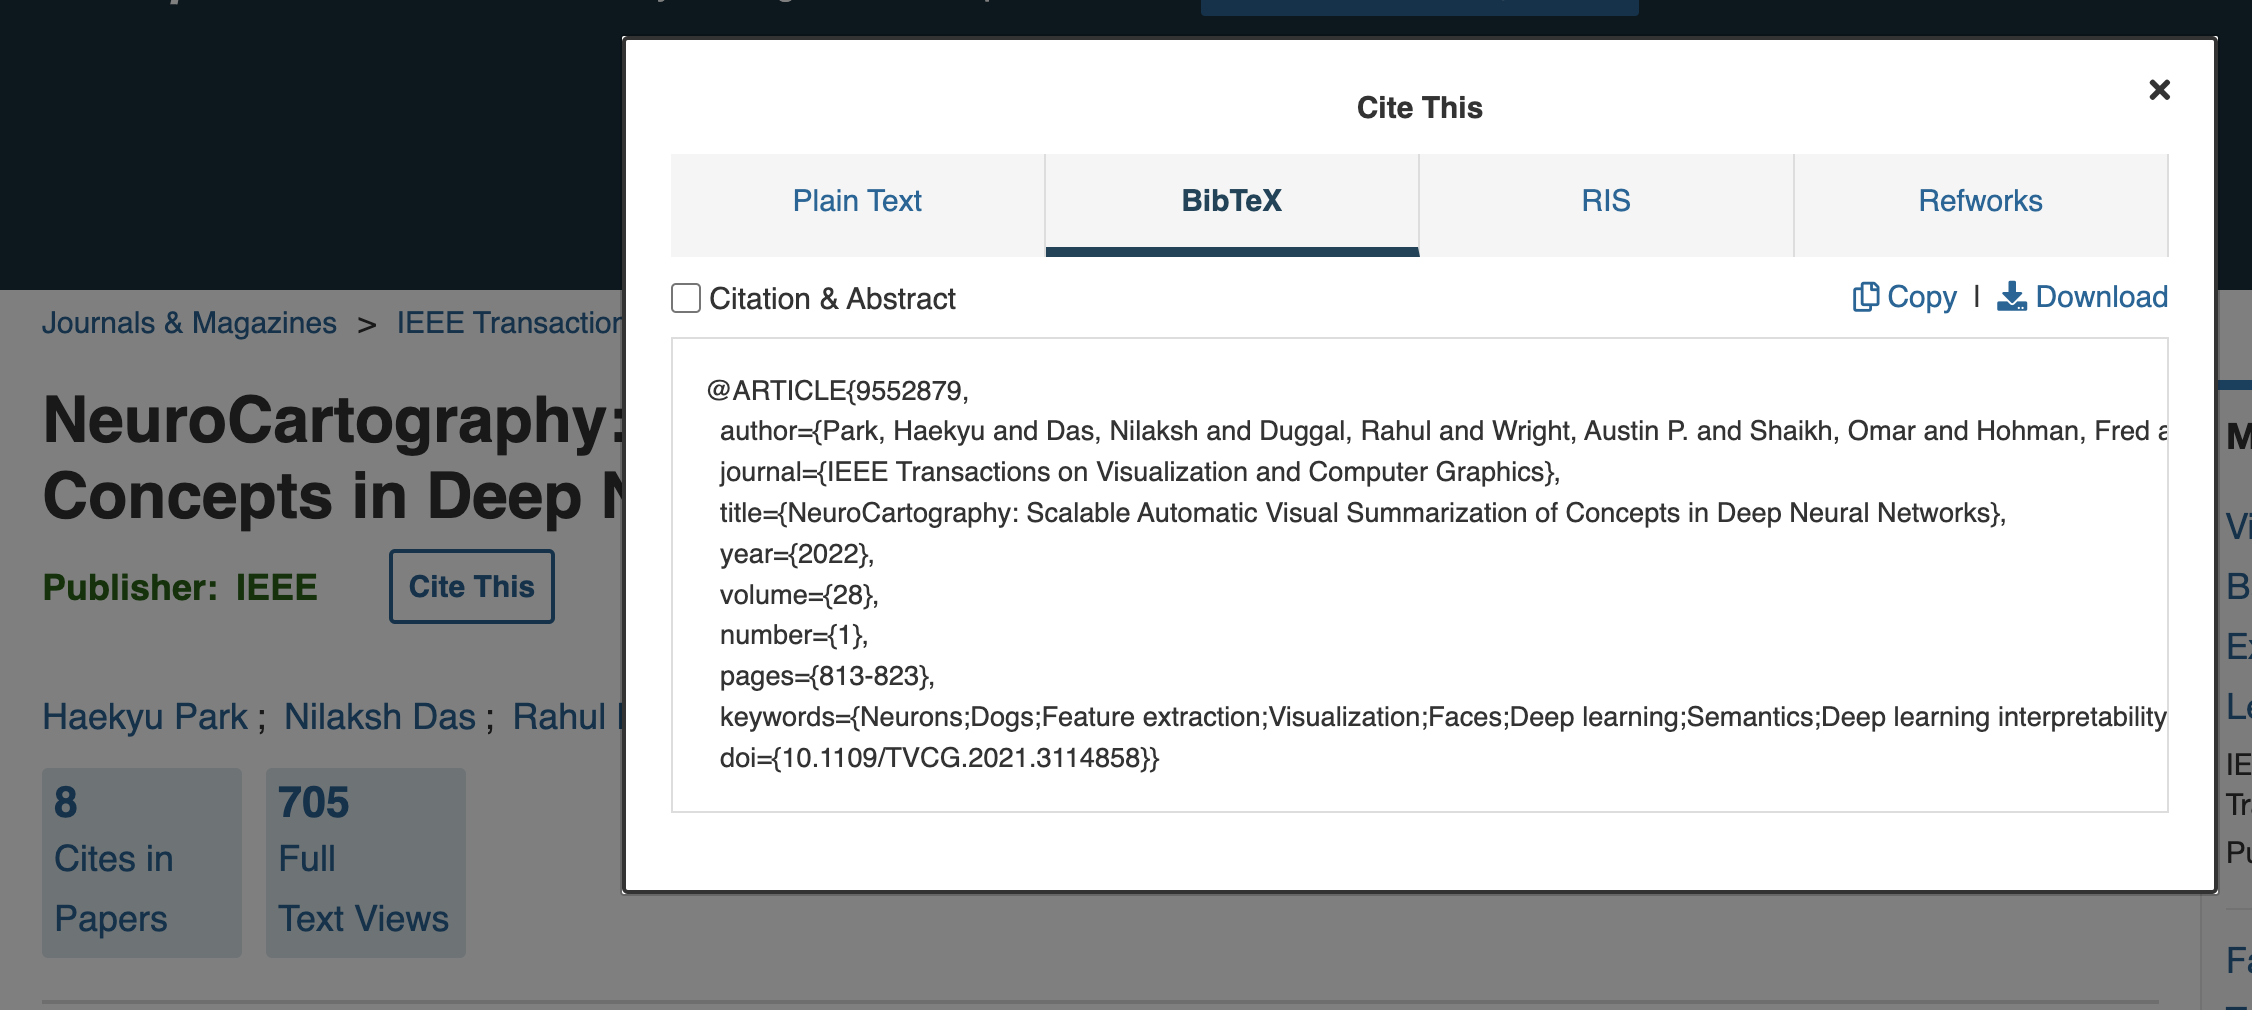
Using BibTeX
- You should put this citation in the file called “template.bib” of the template provided

Using BibTeX
- You can create in-text citations by passing the \cite command the first part of the BibTeX entry

Using BibTeX
- You can generate a bibliography at the end of your document by passing the \bibliography command the name of your .bib file
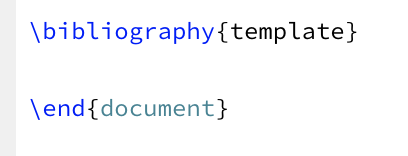
Remember
- Your paper should be a persuasive argument for why your solution to the challenge you present is a reasonable one
- Think of each section and figure as a new facet of the evidence for this argument
Visualizing Deep Learning
- Yesterday, you looked at TensorFlow Playground and CNN Explainer, two visual tools for exploring the inner workings of neural networks
- There are many other tools like this, for many different types of models
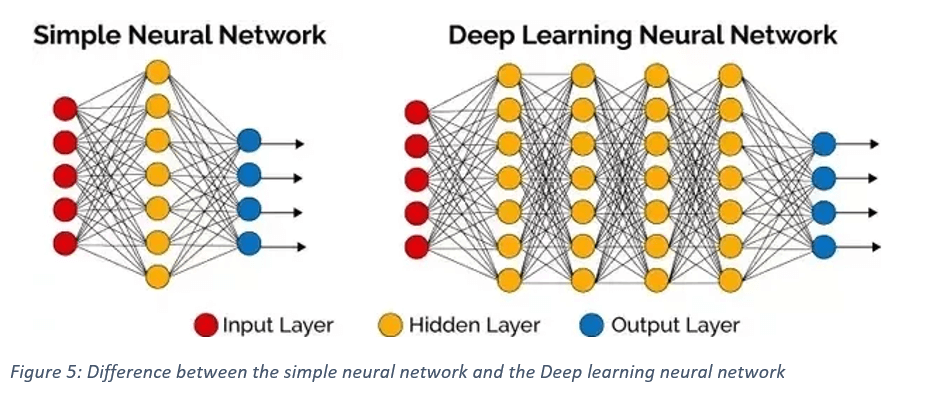
Deep Neural Networks (DNNs)
- A class of machine learning algorithms that aim to mimic the information processing of the brain
- Have more than one hidden layer
![]()
NeuroCartography
Other Tools to Explore (Pt. 1)
Other Tools to Explore (Pt. 2)
- Visual Auditor, for identifying and understanding biases in machine learning models
- Bluff, for visualizing and understanding adversarial attacks on neural networks
- Diffusion Explainer, for visualizing how stable diffusion turns text prompts into images
Further Reading
- The CNN Explainer paper
- Zeiler and Fergus’ Visualizing and Understanding Convolutional Networks
- ShapeShop: Towards Understanding Deep Learning Representations via Interactive Experimentation
