Welcome back to the Visualization for Machine Learning Lab!
Week 12: Visualization for NLP
NL as Input: ChartQA
ChartQA Dataset
- Real-world charts crawled from various online sources
- 9.6k human-authored and 23.1K Machine-generated questions
![]()
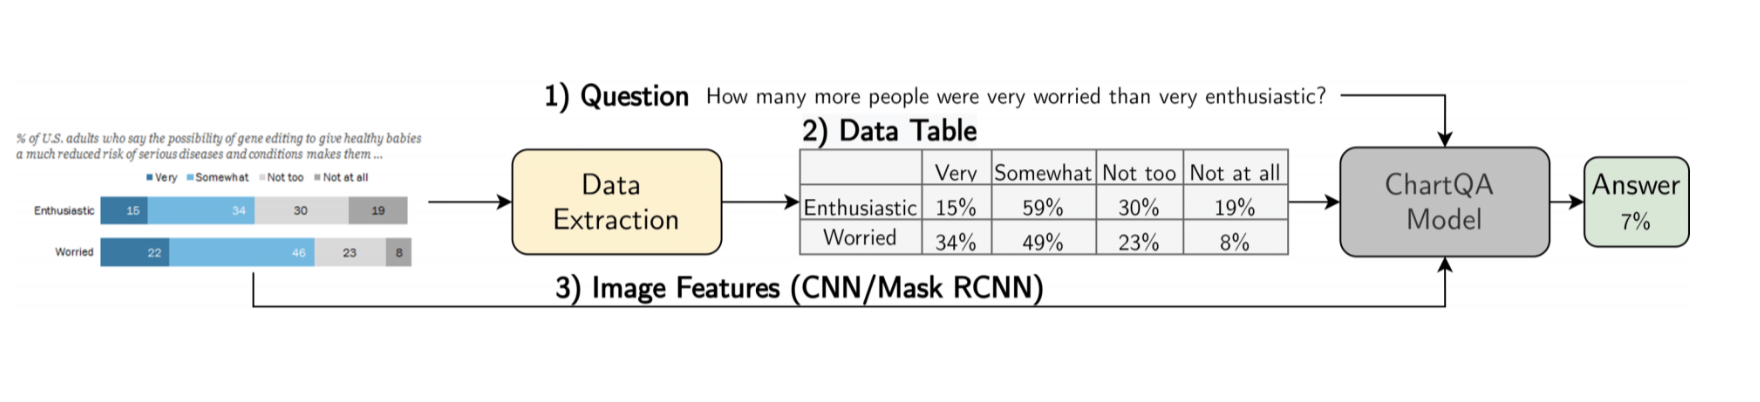
ChartQA Approach
ChartQA Evaluation
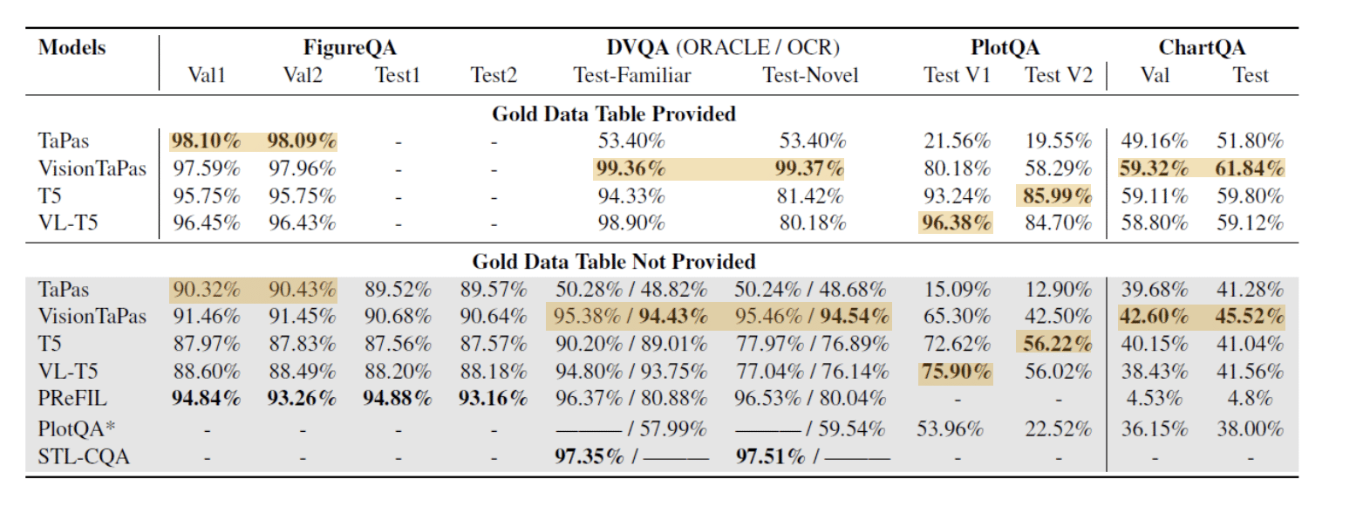
- VisionTaPas achieves SOTA performance.
- Lower accuracies in authors’ dataset compared to previous datasets (mainly due to the human-written visual and logical reasoning questions)
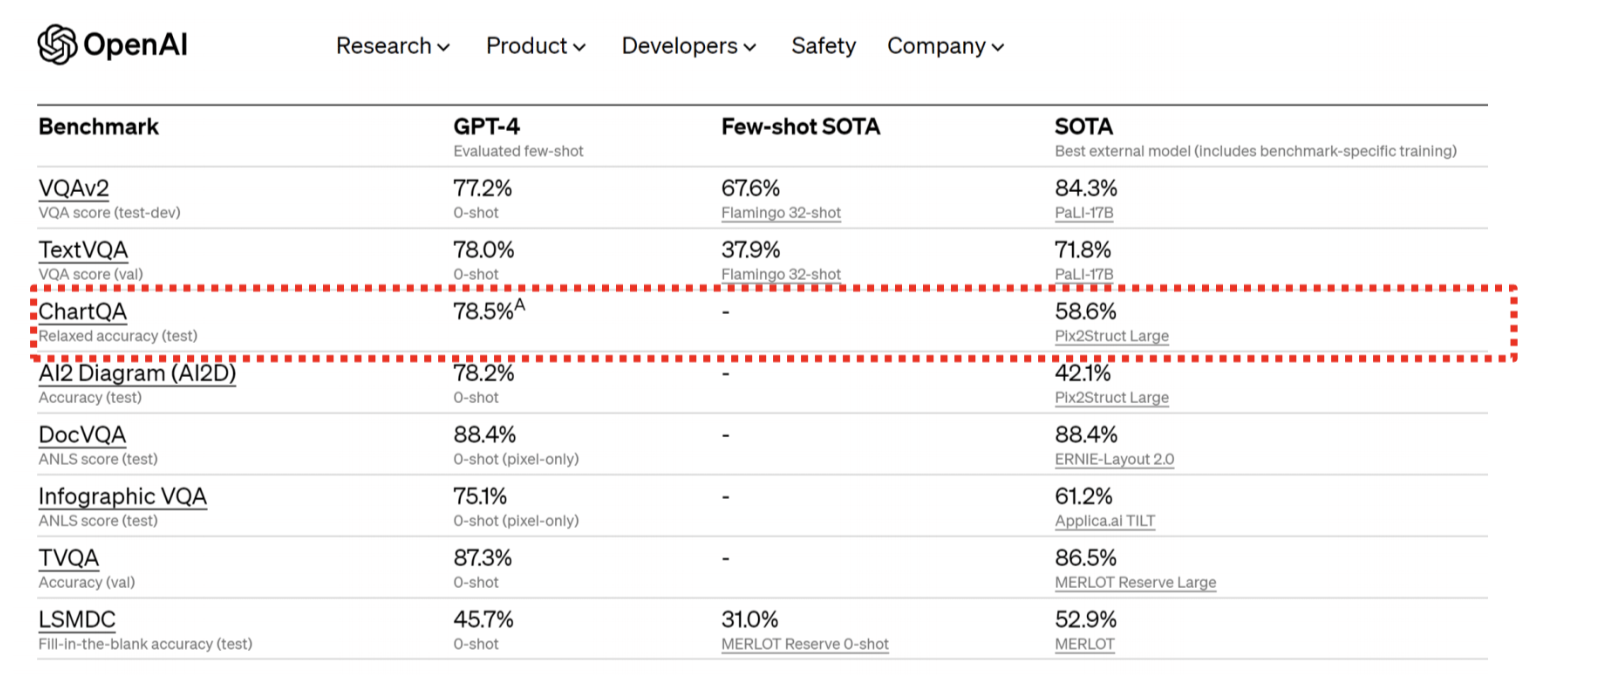
OpenAI’s Study of GPT-4 on ChartQA Benchmark
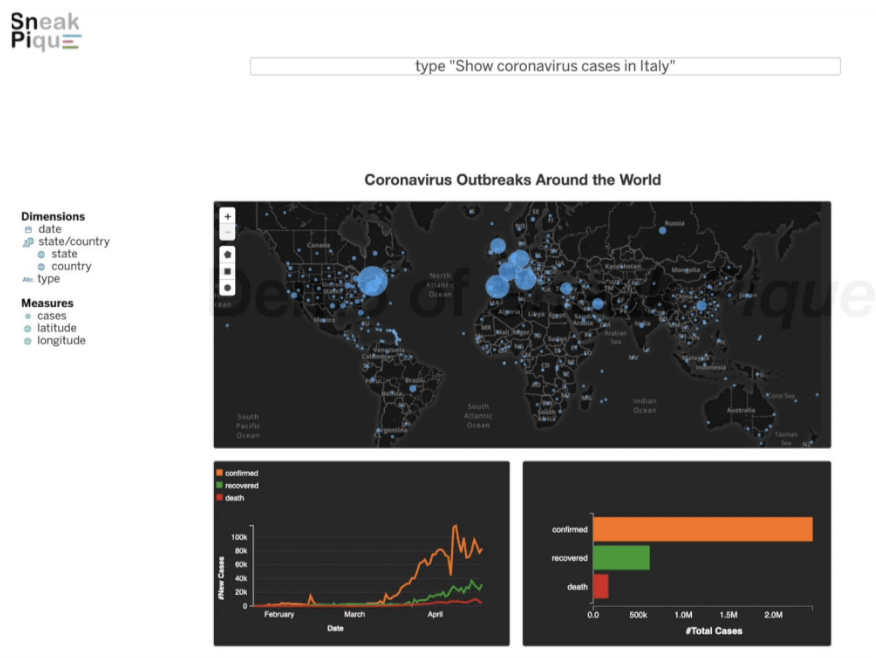
NL as Input: Multimodal Inputs for Visualizations
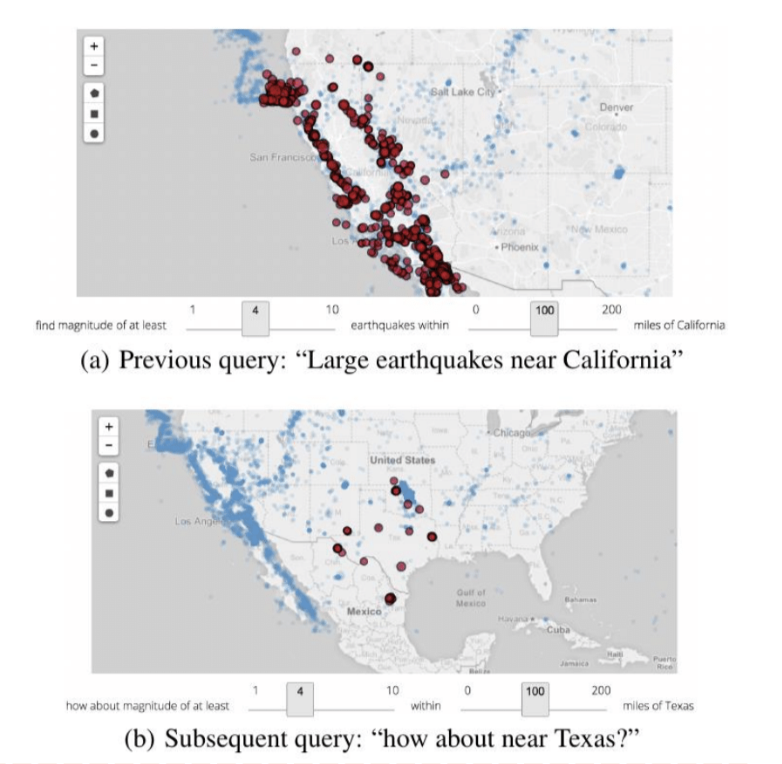
- Ambiguity Widgets: Eviza (Setlur et al., 2016)
- Allows users to rectify queries
![]()
NL as Input: Multimodal Inputs for Visualizations
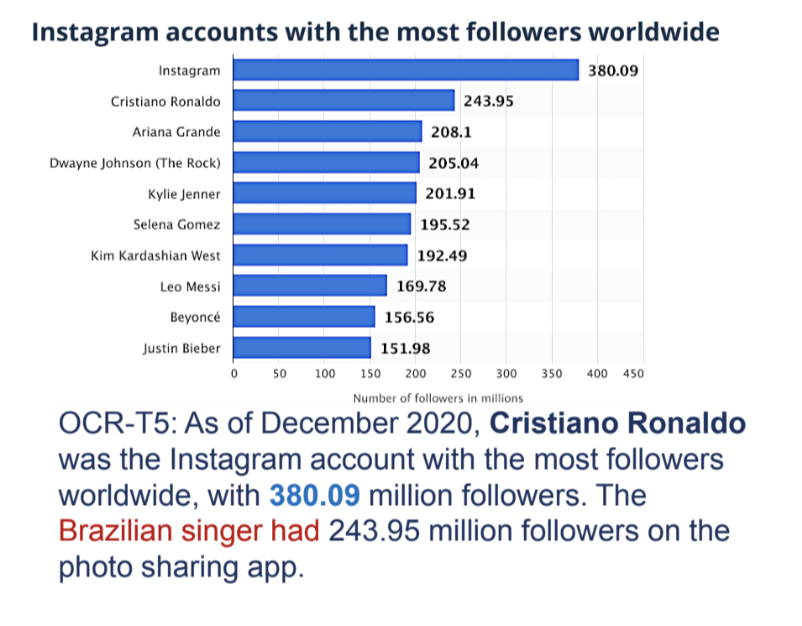
NL as Output: Chart-to-Text
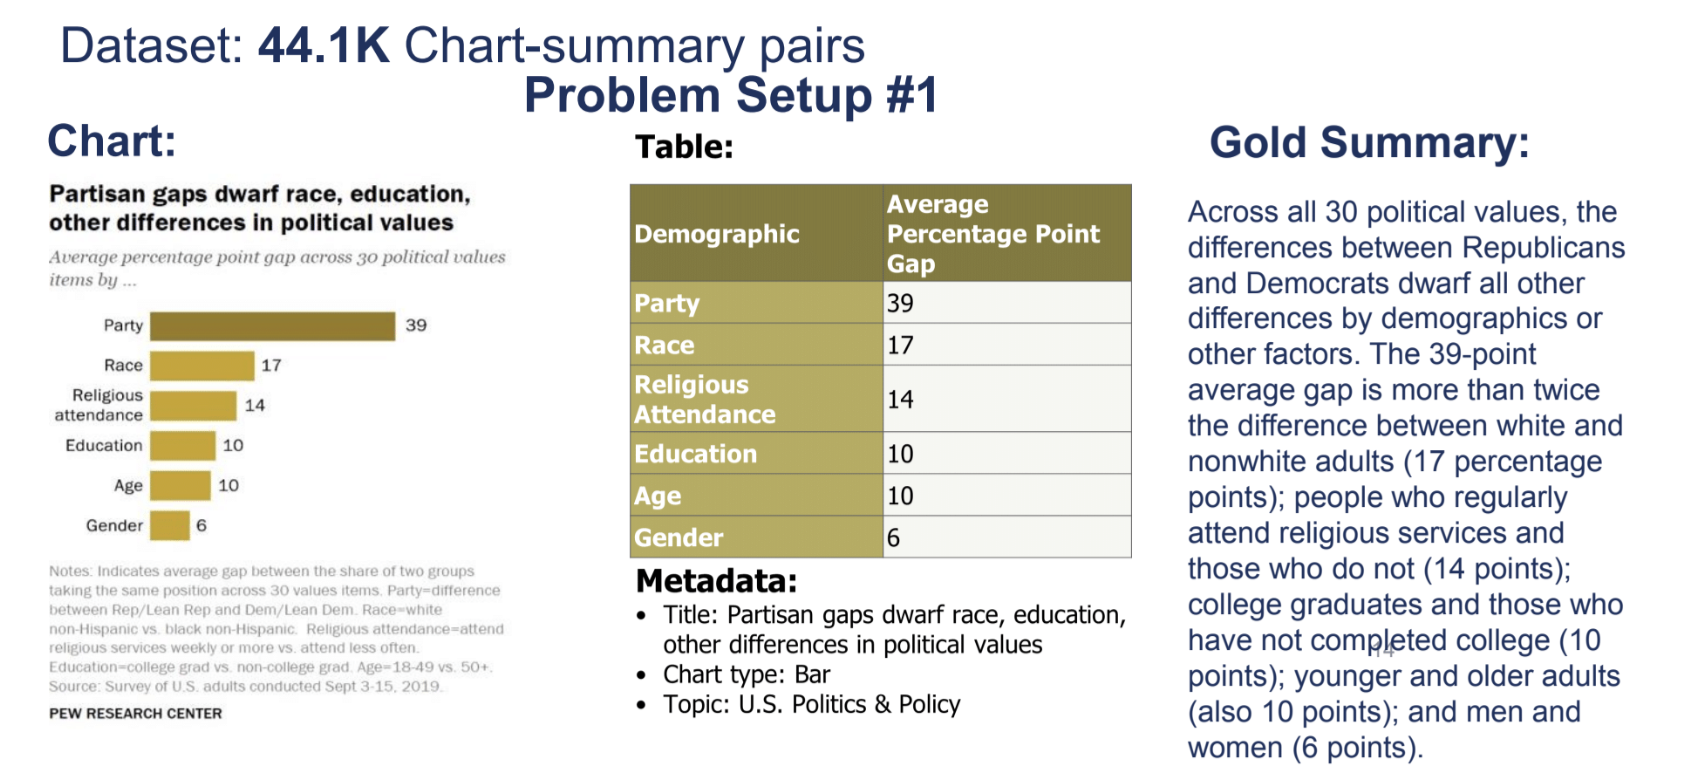
NL as Output: Chart-to-Text
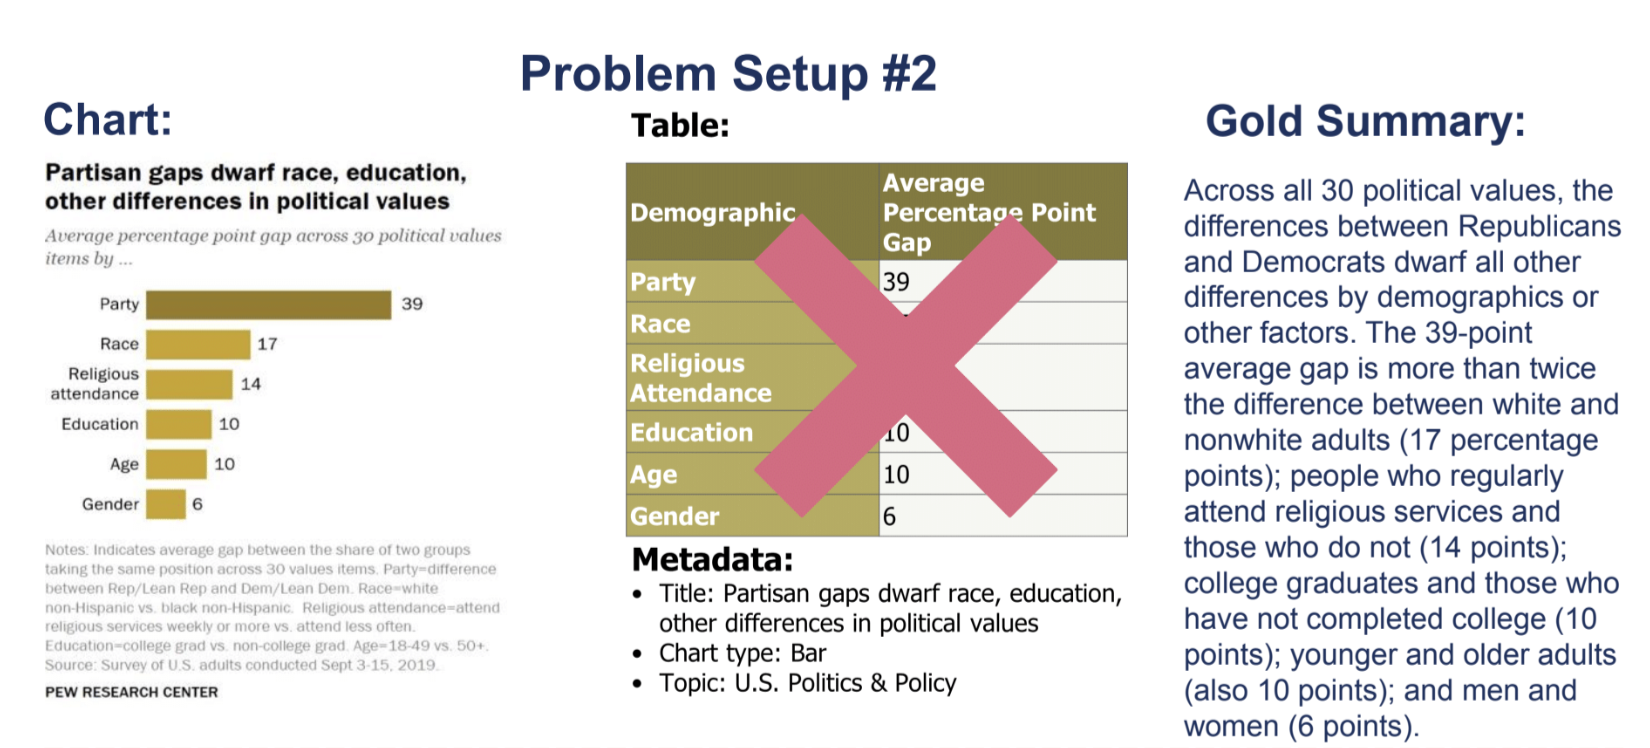
Chart-to-Text Example Models
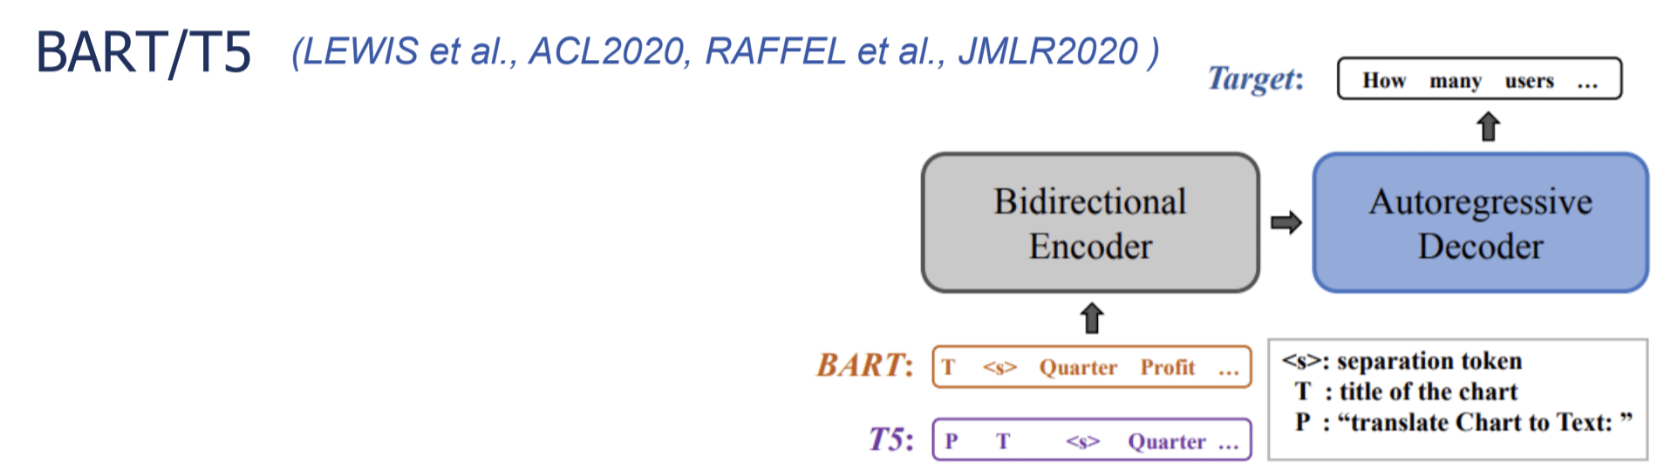
- Full fine-tuning BART/T5 on authors’ datasets
- Setup 1: Linearizes the table as the input
- Setup 2: Send OCR text from the chart image as the input
- Prefix to T5: “translate Chart to Text:”
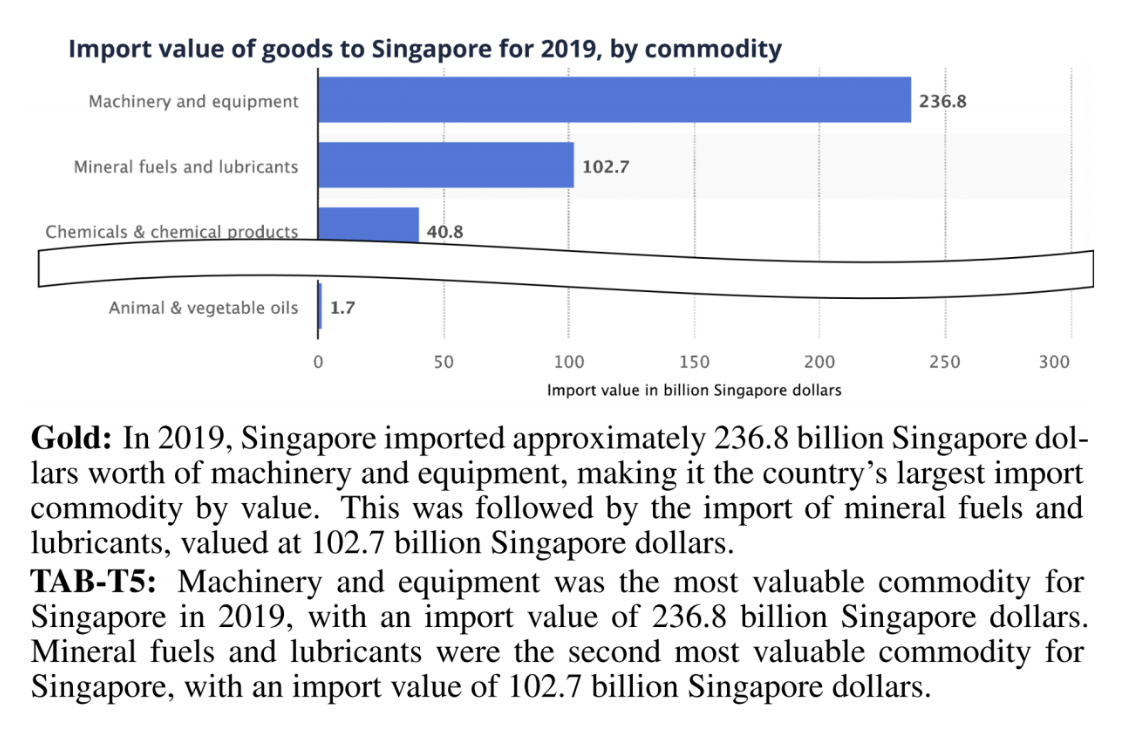
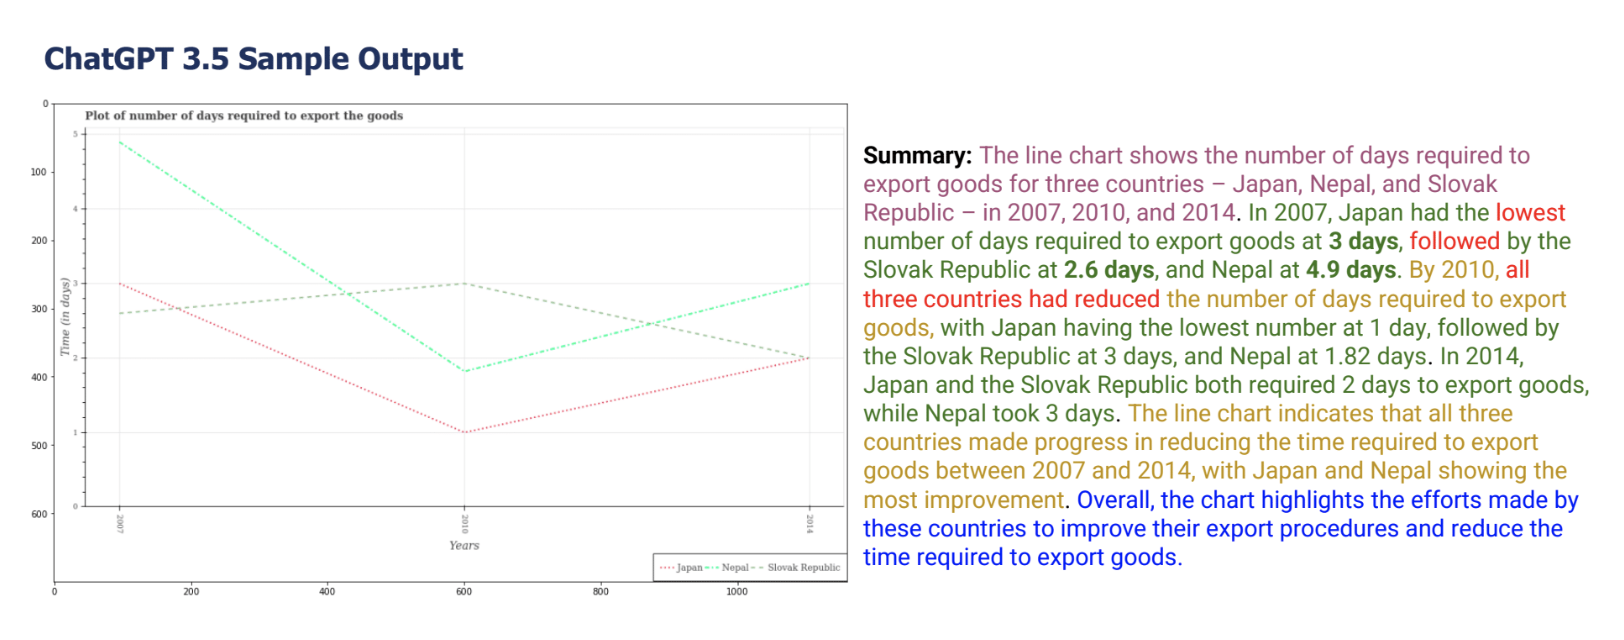
Chart-to-Text Sample Output
VisText
- 12.4K Charts with generated + crowd-sourced captions
- Scene graphs with a hierarchical representation of a chart’s visual elements
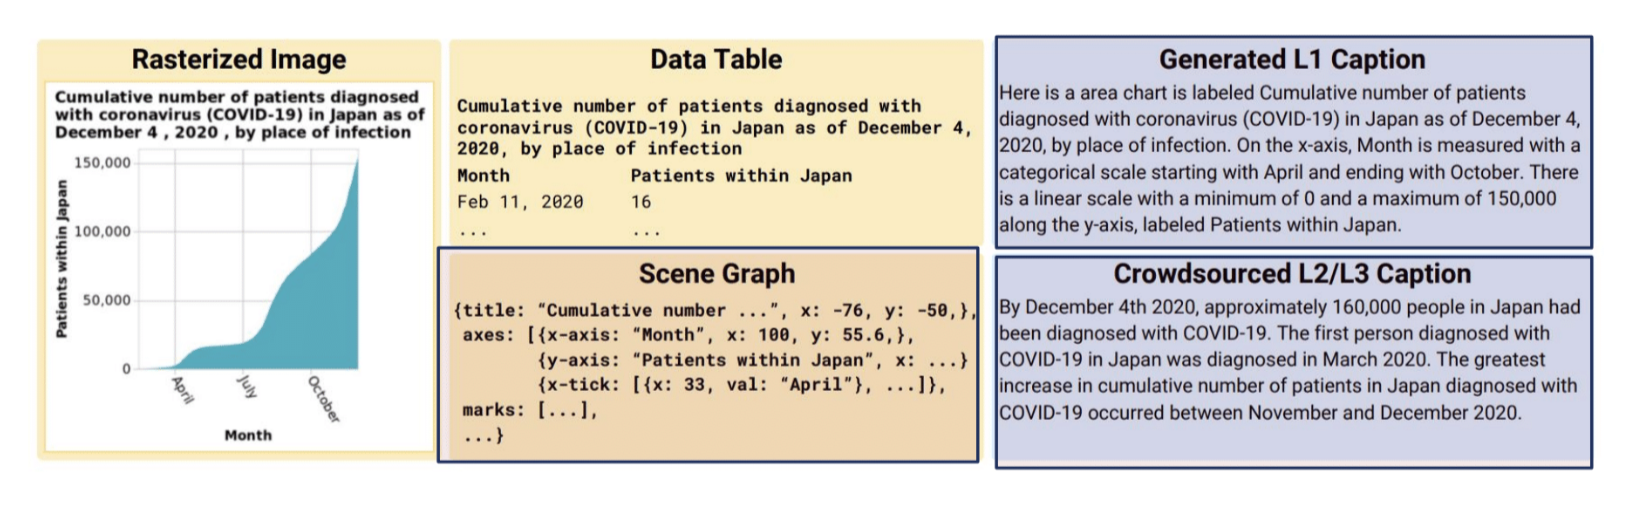
VisText Sample Output
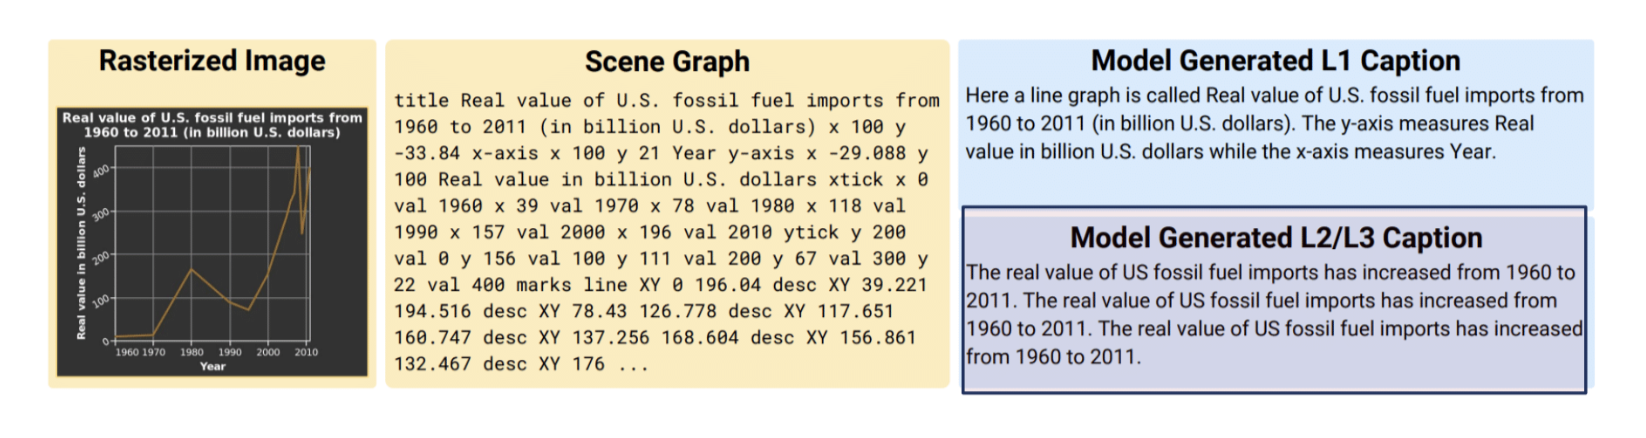
- Correctly identifies upword trends, but repeats this claim twice
NL as Output: Open-Ended Question Answering with Charts
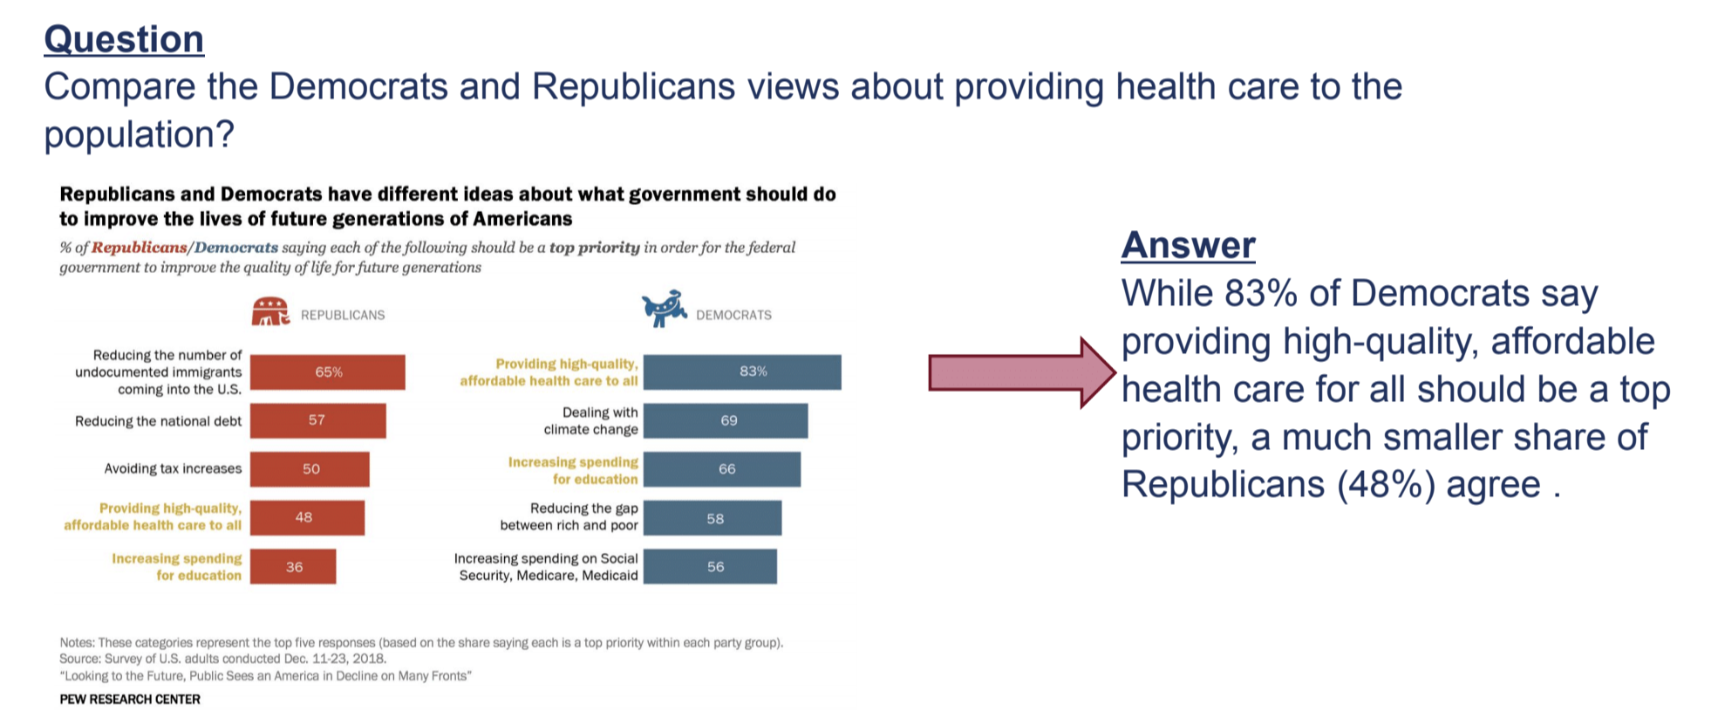
Combining Language and Visualizations as Output
- Roles of natural language
- Generating explanatory answer
- Explaining the answer
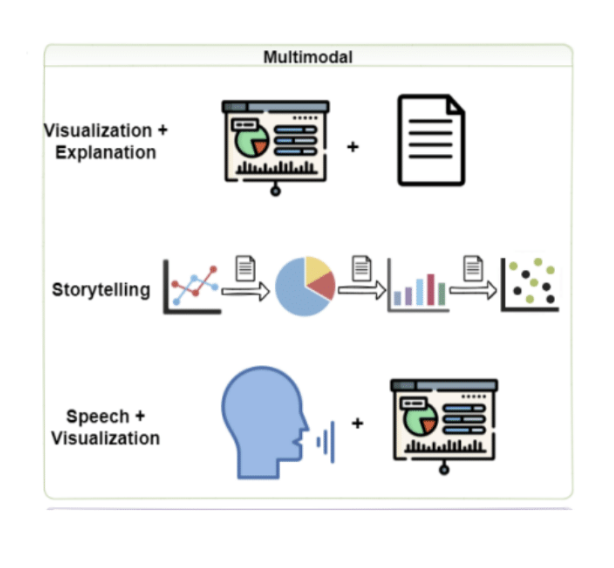
Combining Language and Visualizations as Output
- An example of combining text and vis as a multimodal output
Combining Language and Visualizations as Output
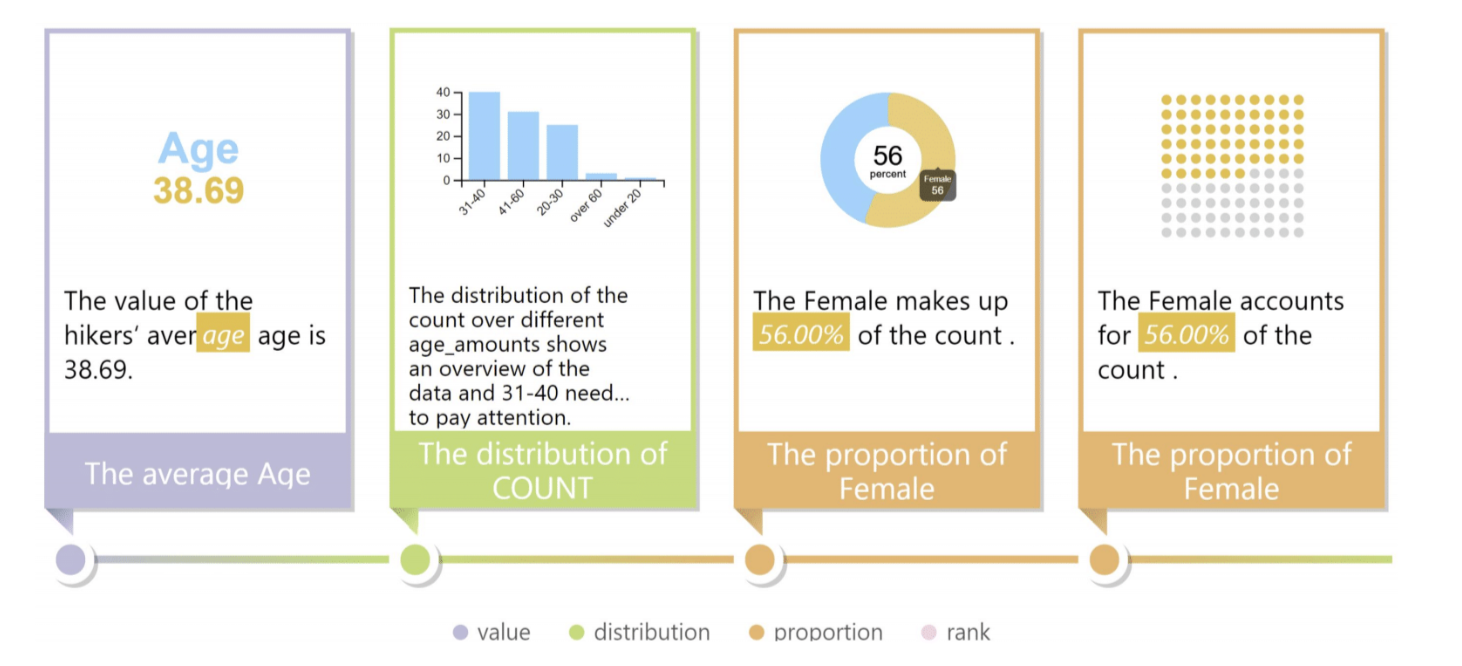
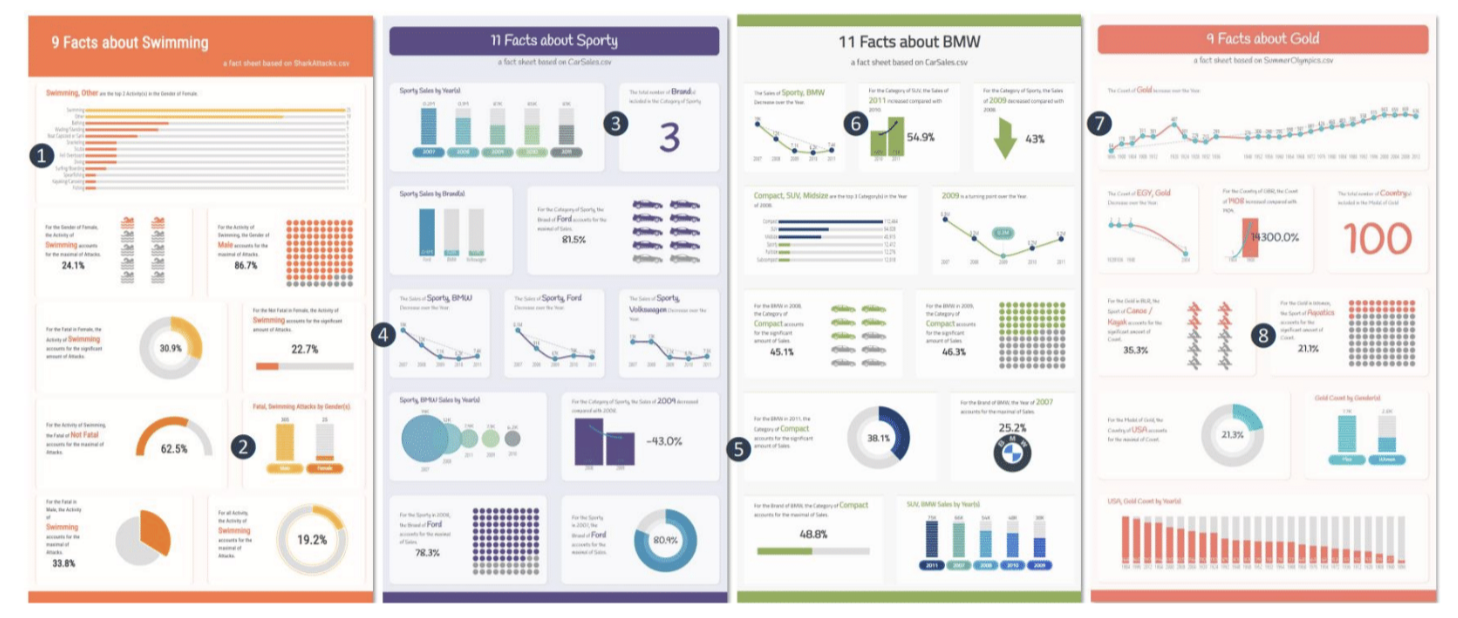
- DataShot (Yun et al., 2019)
Conversational QA With Visualization
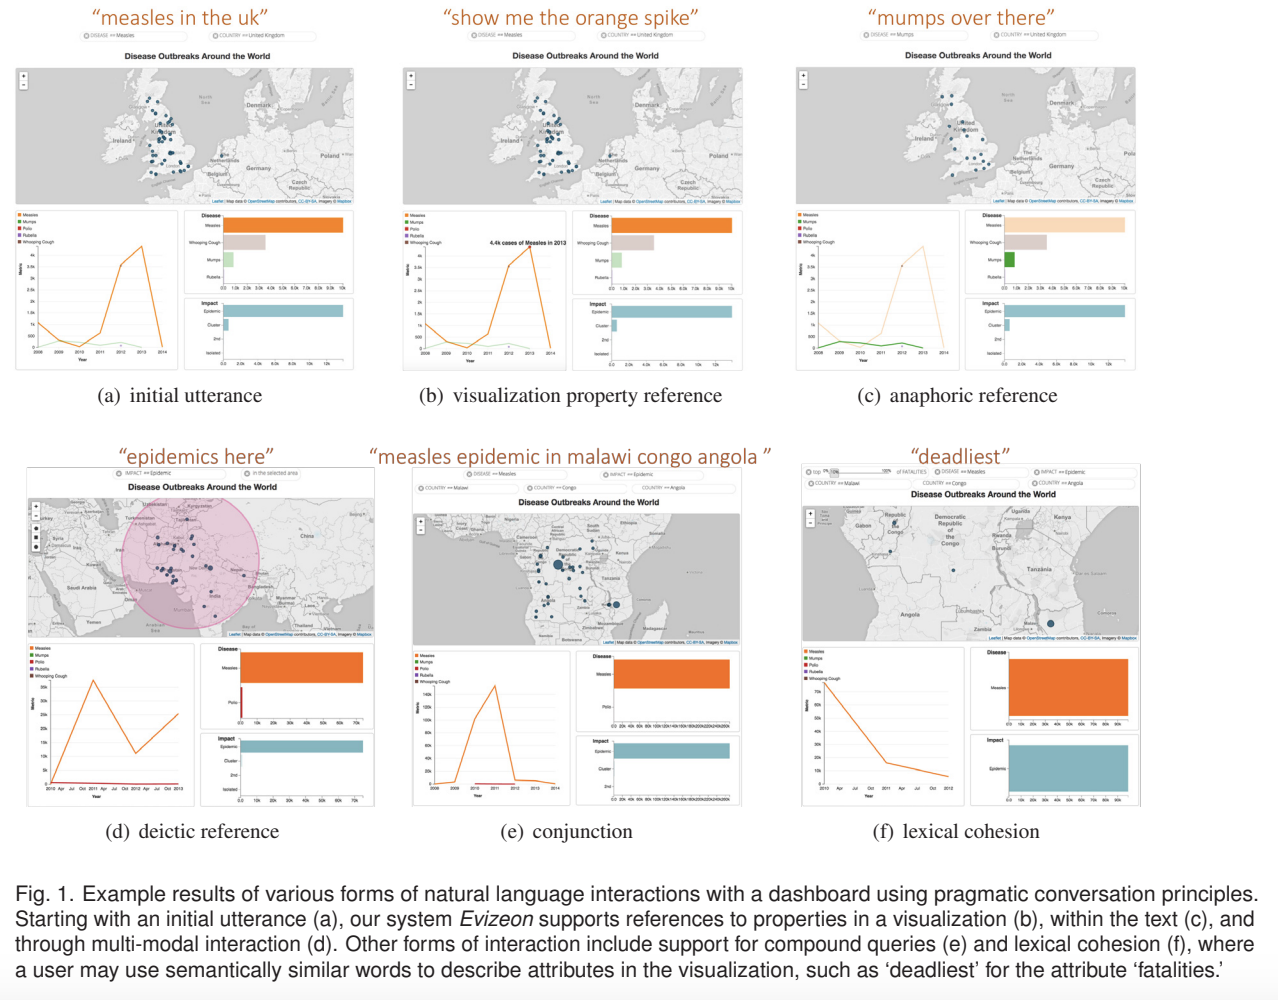
- Evizeon (Hoque et al., TVCG 2017)
Open Challenges & Ongoing Research
Open Challenges & Ongoing Research
Open Challenges & Ongoing Research
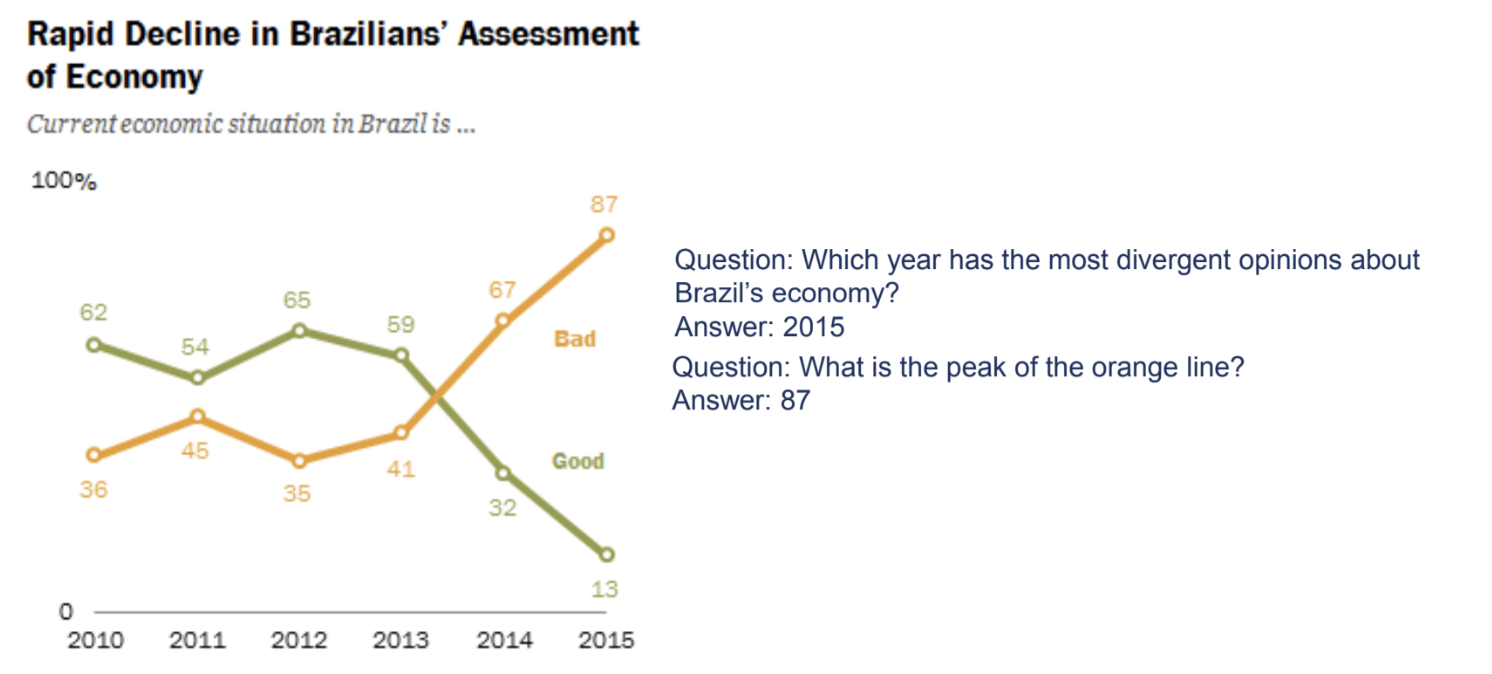
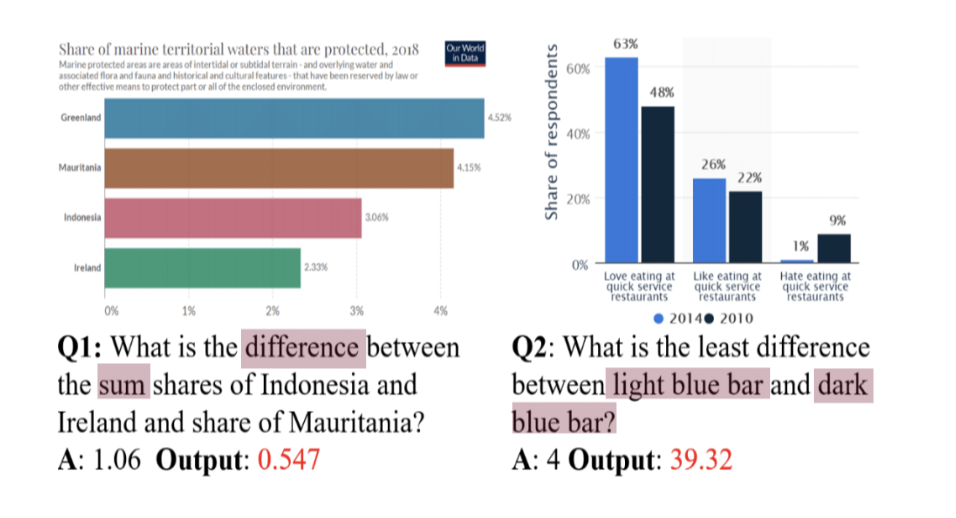
- Improving logical and visual reasoning
![]()
Open Challenges & Ongoing Research
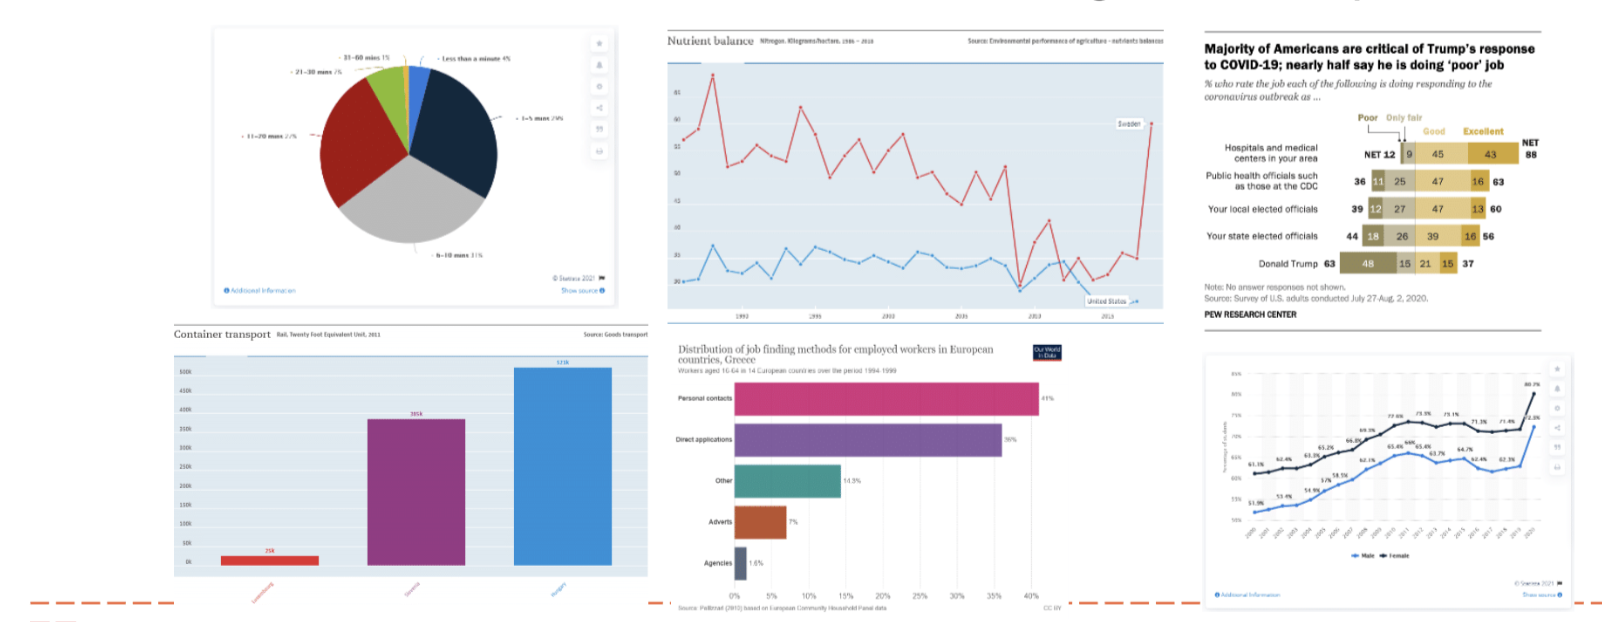
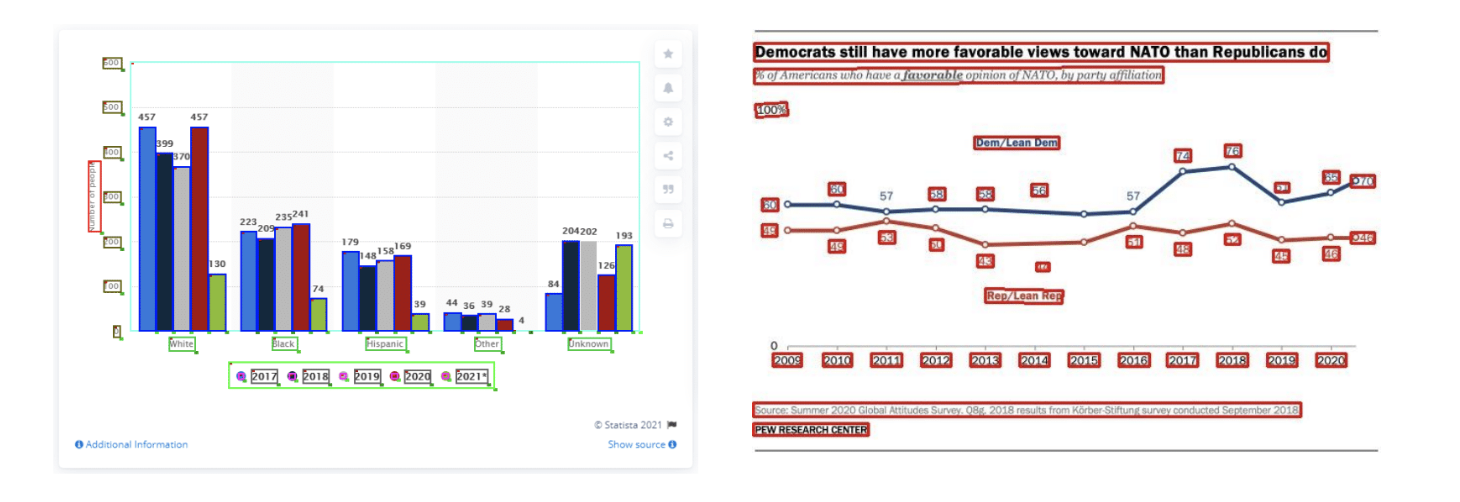
- Computer vision challenges (e.g. chart data extraction)
![]()
Open Challenges & Ongoing Research
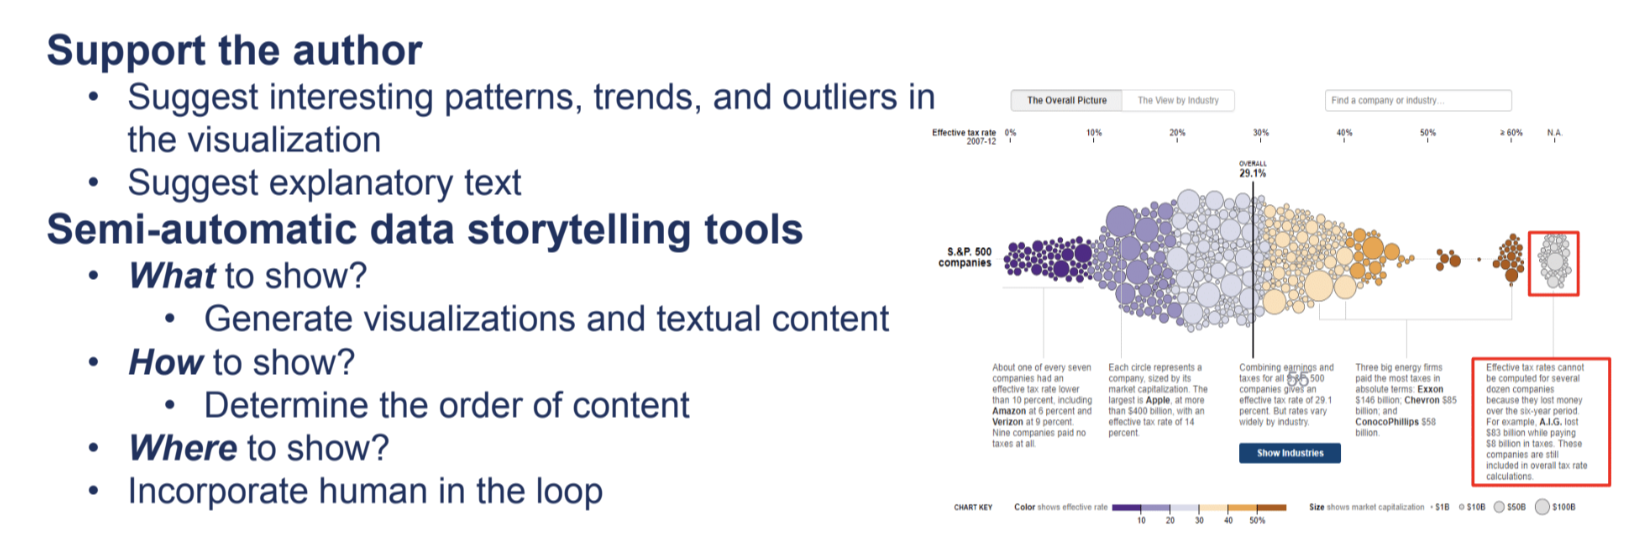
- How can we effectively combine text and visualization in data stories?
![]()
Open Challenges & Ongoing Research
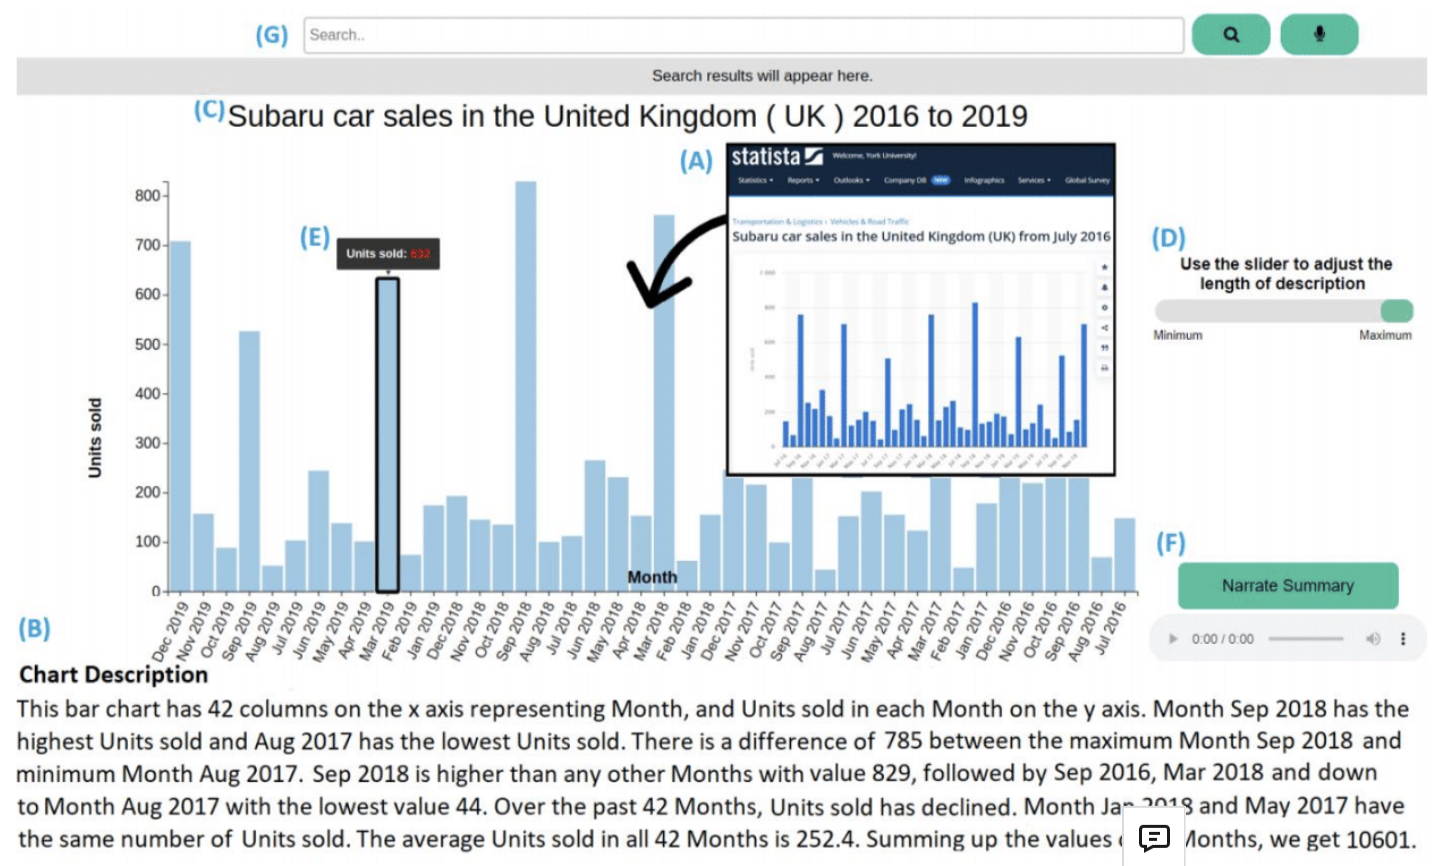
- NLP for Visualization accessiblity
![]()
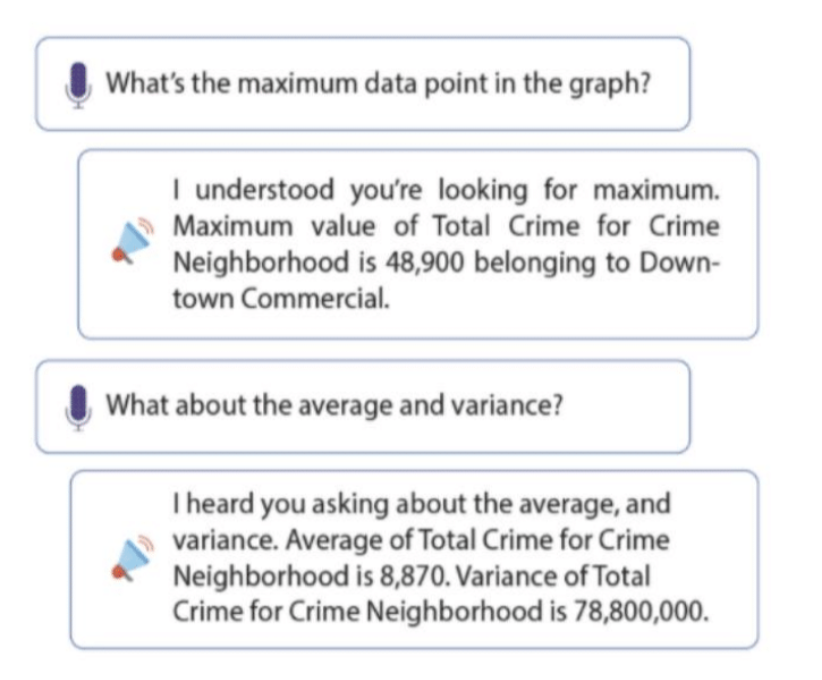
Open Challenges & Ongoing Research
- NLP for Visualization accessiblity
![]()