Welcome back to the Visualization for Machine Learning Lab!
## Miscellaneous * Proposal grades and feedback are on Brightspace * Check PDFs for comments * Longer comments may need to be viewed in a PDF reader (like Acrobat) rather than the browser * Presentations 5/2 * Written report due sometime during finals week (will get back to you with a date on Monday) * Homework 4 (OPTIONAL - extra credit) on Brightspace * Amount of extra credit TBD * Due April 19th ## NLP + Vis Applications * These slides are adapted from a half-day tutorial at the 2023 EMNLP Conference by Shafiq Joty (Salesforce AI Research and Nanyang Technological University), Enamul Hoque (York University), and Jesse Vig (Salesforce AI Research) * You can find their full tutorial slides [here](https://nlp4vis.github.io/) ## What Can NLP + Vis Be Used For? * Visual text analytics * Natural language interfaces for visualizations * Text generations for visualizations * Automatic visual story generation * Visualization retrieval and recommendation * Etc. ## What Can NLP + Vis Be Used For? * We will first divide these applications into two categories: * Natural language as **input** * Natural language as **output** ## NL as Input: ChartQA 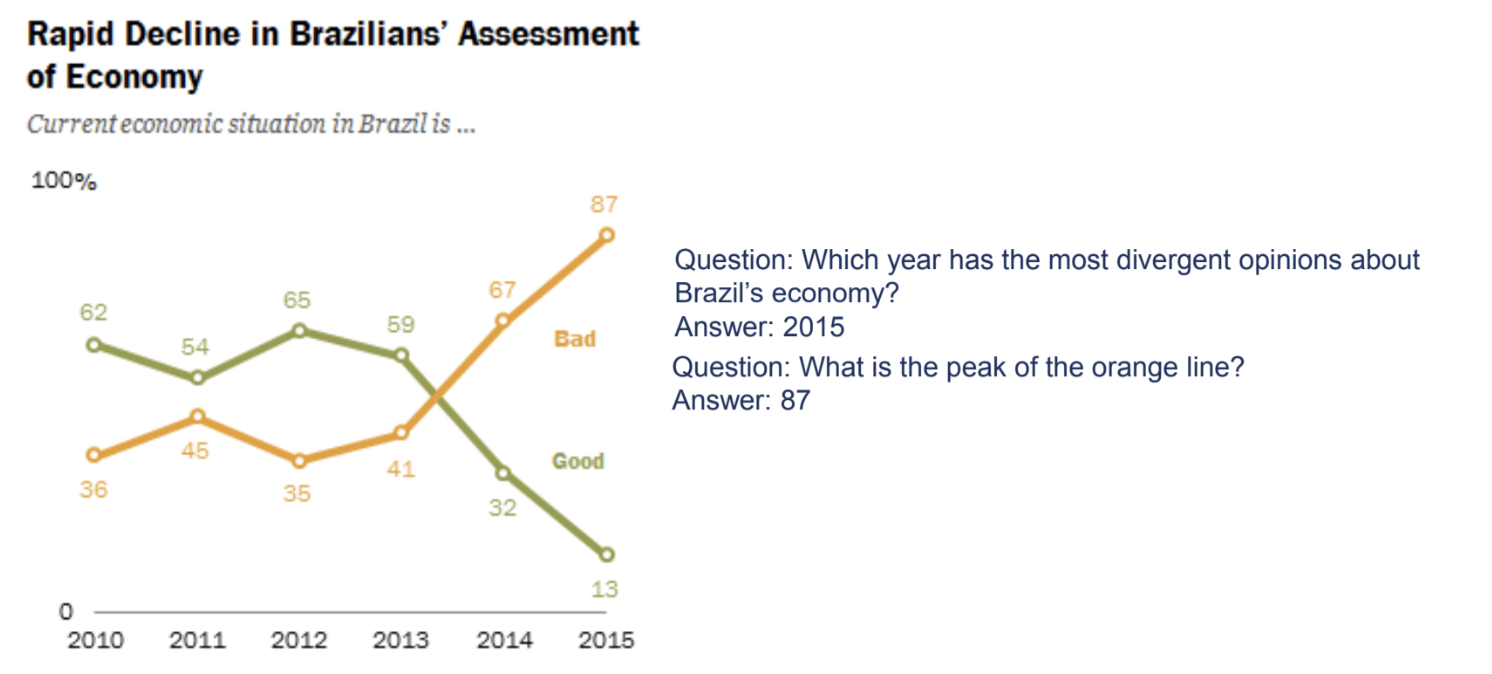 ::: footer Ref: @masry-etal-2022-chartqa ::: ## ChartQA Dataset * Real-world charts crawled from various online sources * 9.6k human-authored and 23.1K Machine-generated questions 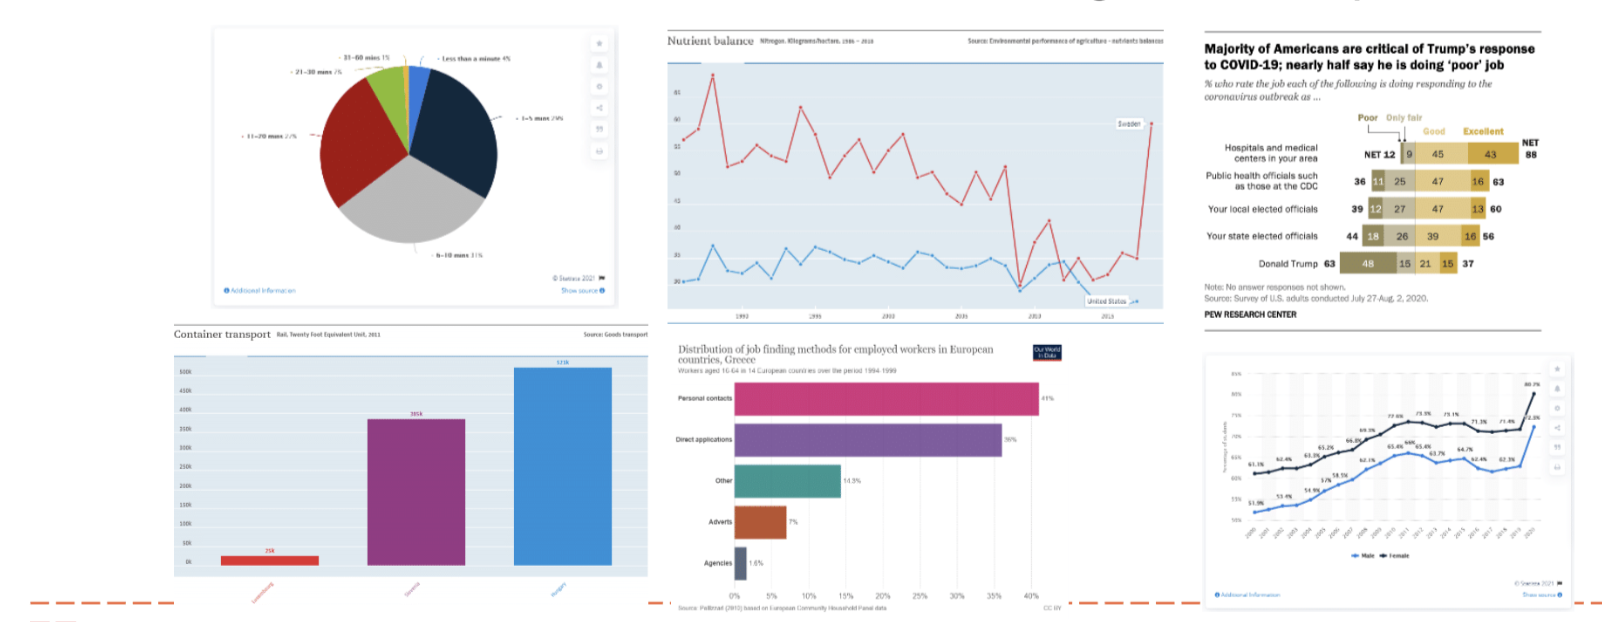 ::: footer Ref: @masry-etal-2022-chartqa ::: ## ChartQA Approach 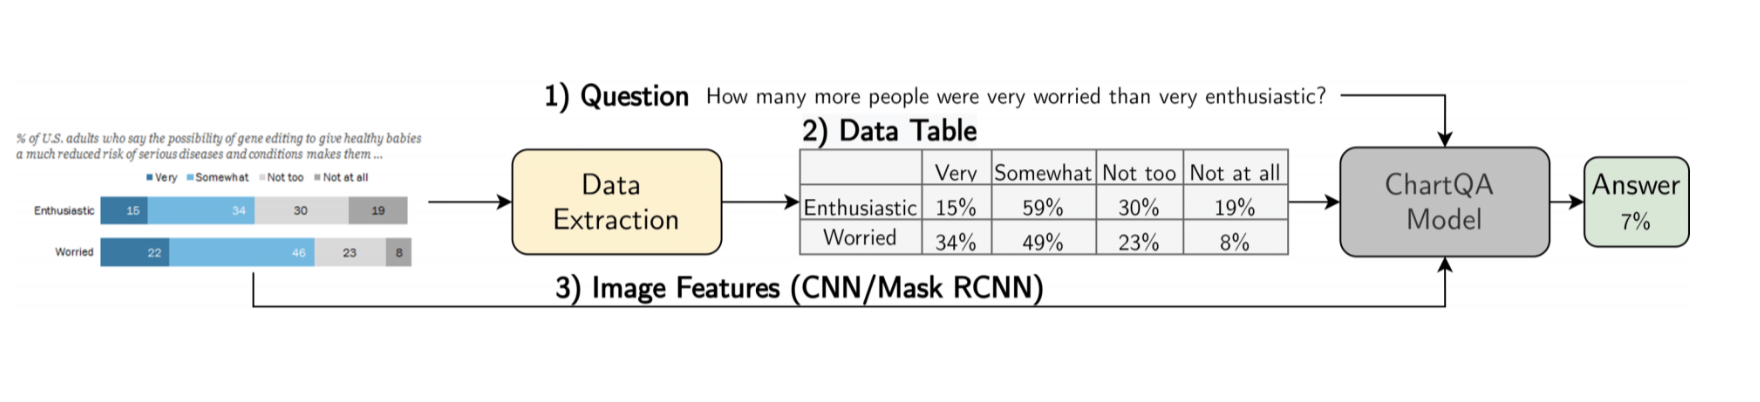 ::: footer Ref: @masry-etal-2022-chartqa ::: ## ChartQA Evaluation 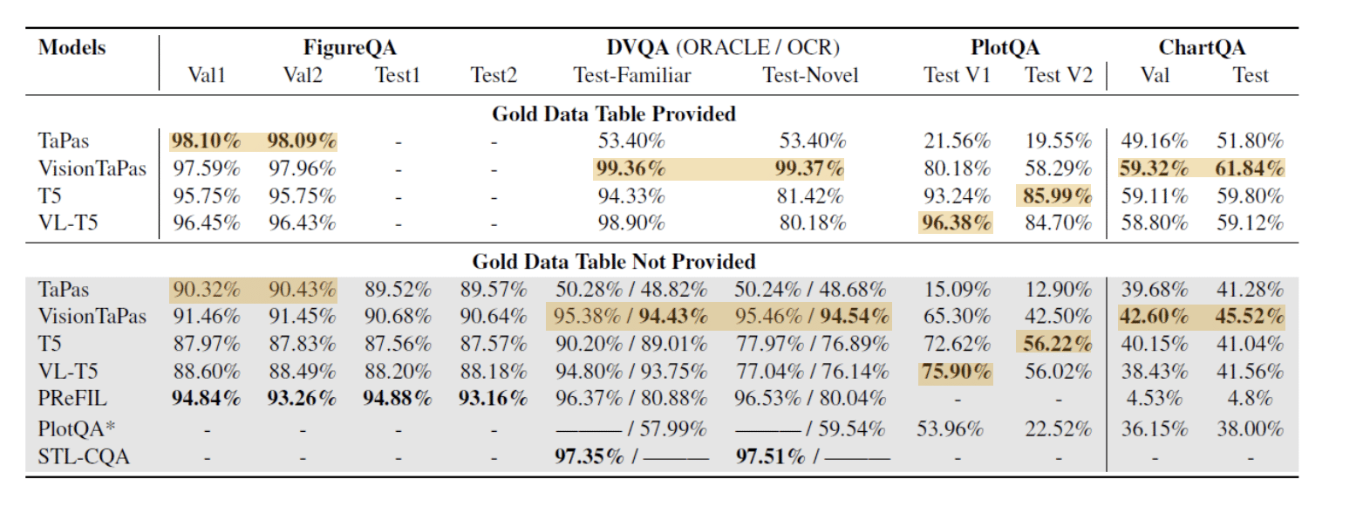 * VisionTaPas achieves SOTA performance. * Lower accuracies in authors' dataset compared to previous datasets (mainly due to the human-written visual and logical reasoning questions) ## OpenAI’s Study of GPT-4 on ChartQA Benchmark 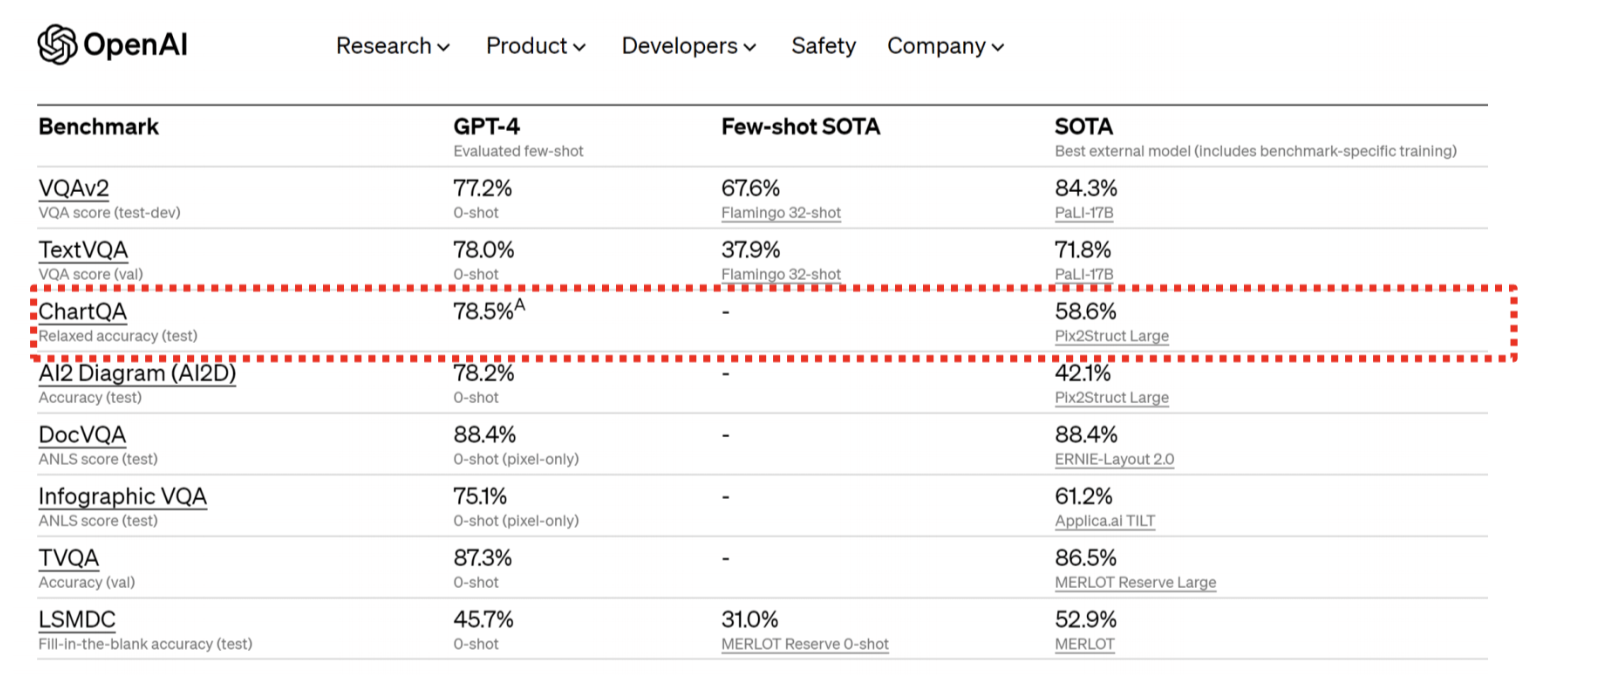 ::: footer Ref: https://openai.com/research/gpt-4 ::: ## NL as Input: Multimodal Inputs for Visualizations * Ambiguity Widgets: Eviza (Setlur et al., 2016) * Allows users to rectify queries 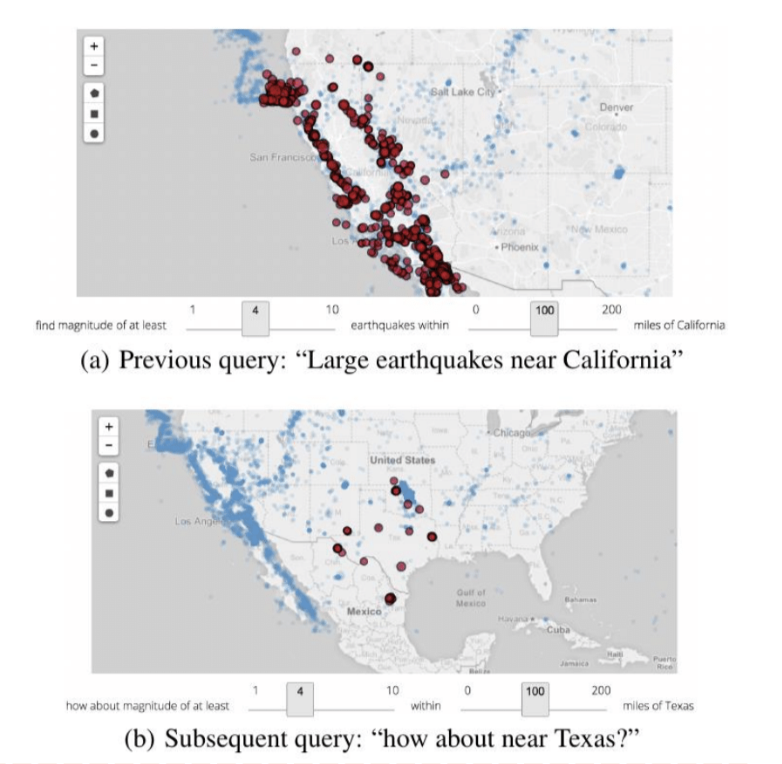{width=50%} ## NL as Input: Multimodal Inputs for Visualizations * Query completion through text and interactive vis: Sneak Pique (Setlur et al., 2020) ::: footer Ref: @10.1145/3379337.3415813 ::: ## NL as Input: Multimodal Inputs for Visualizations 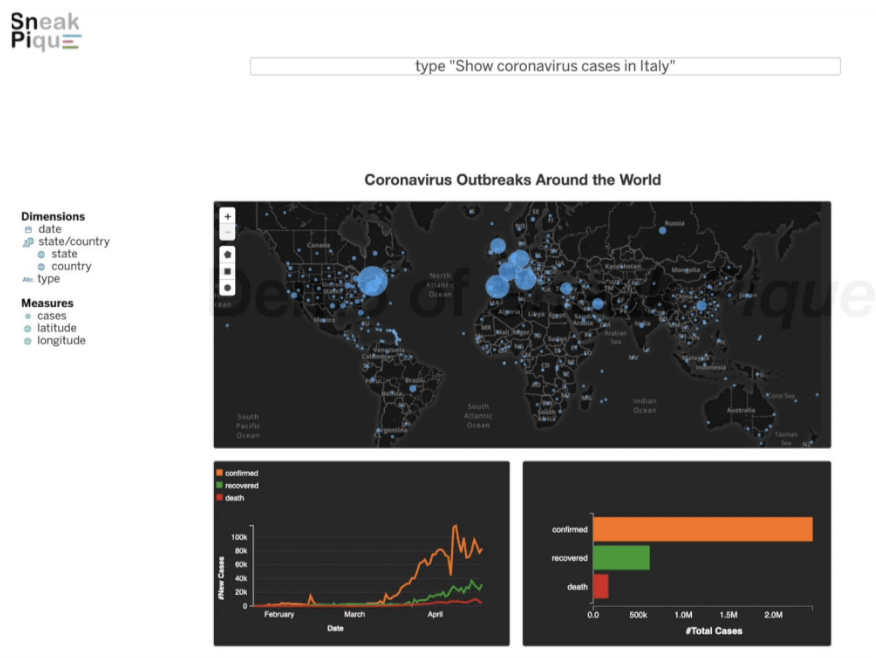 ::: footer Ref: @10.1145/3379337.3415813 ::: ## NL as Output: Chart-to-Text 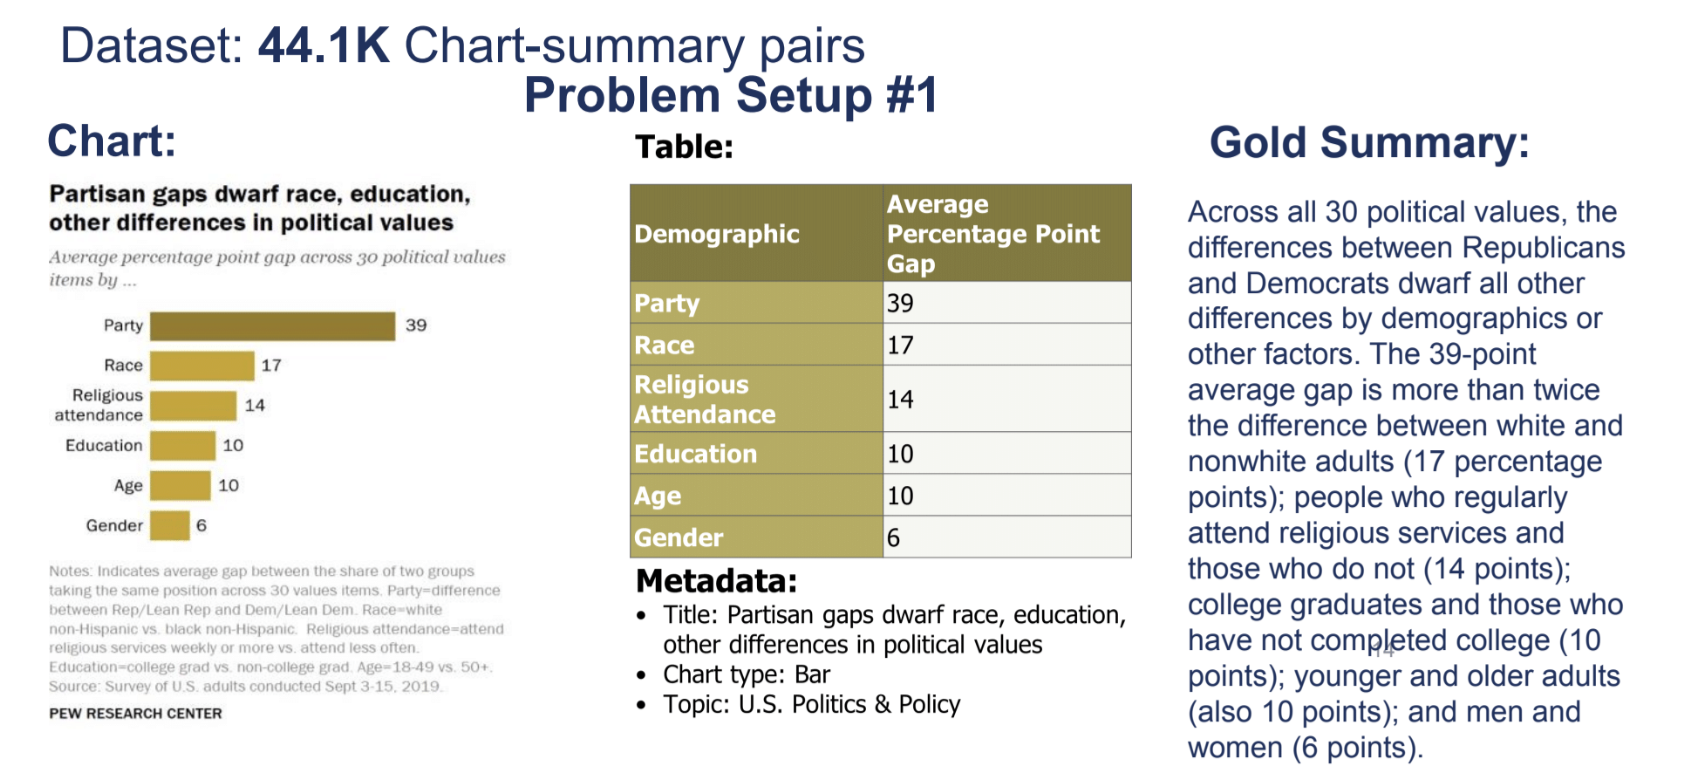 ::: footer Ref: @kantharaj-etal-2022-chart ::: ## NL as Output: Chart-to-Text 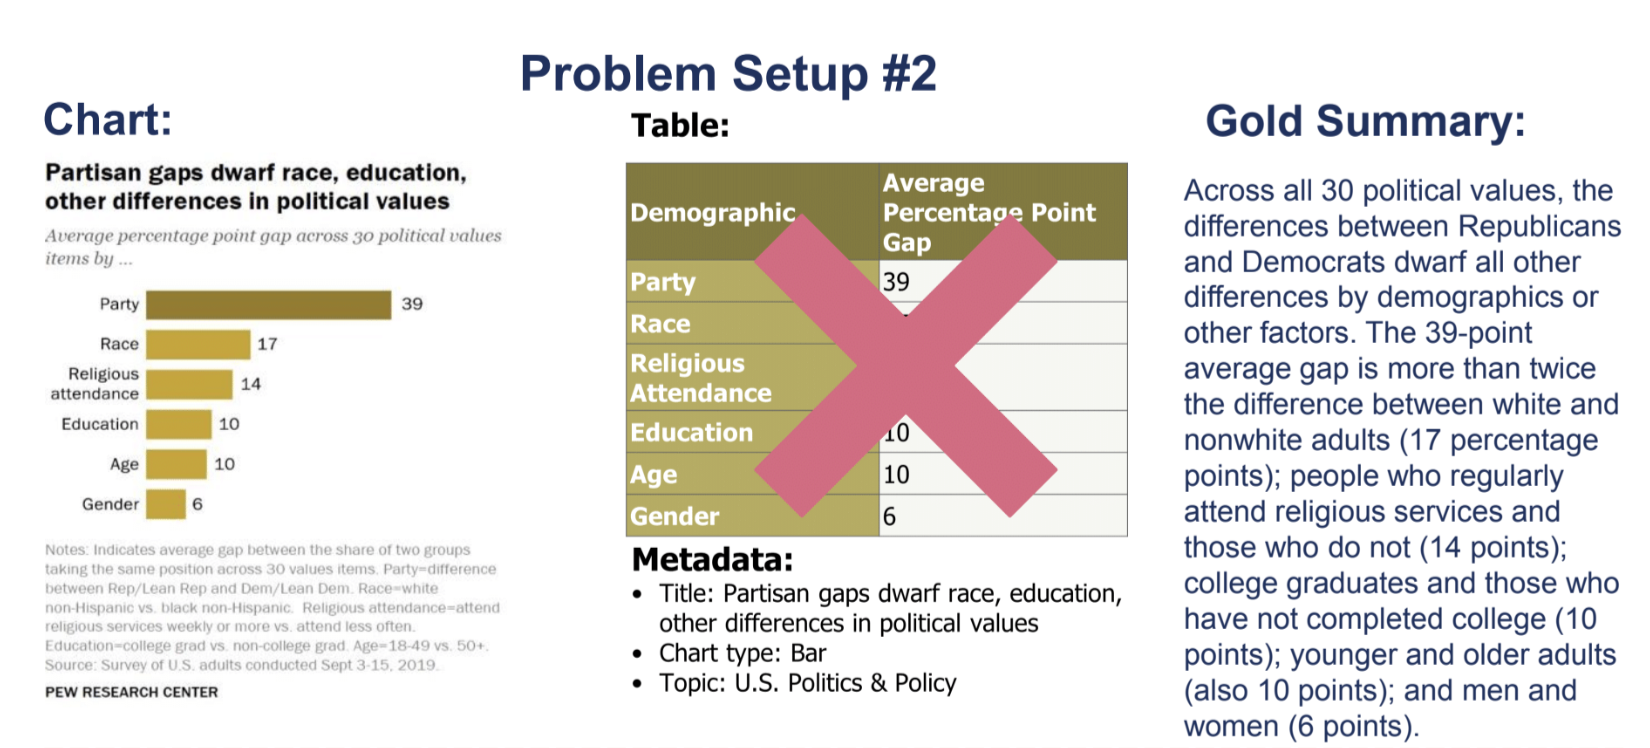 ::: footer Ref: @kantharaj-etal-2022-chart ::: ## Chart-to-Text Example Models 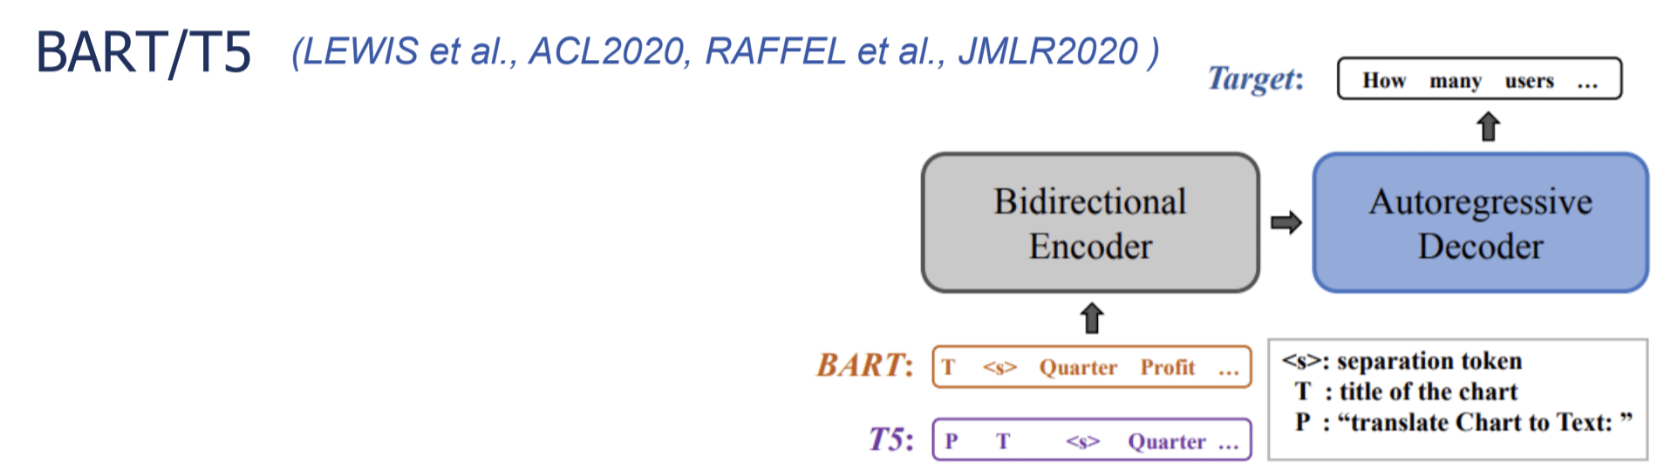 * Full fine-tuning BART/T5 on authors' datasets * Setup 1: Linearizes the table as the input * Setup 2: Send OCR text from the chart image as the input * Prefix to T5: “translate Chart to Text: ” ::: footer Ref: @kantharaj-etal-2022-chart ::: ## Chart-to-Text Sample Output 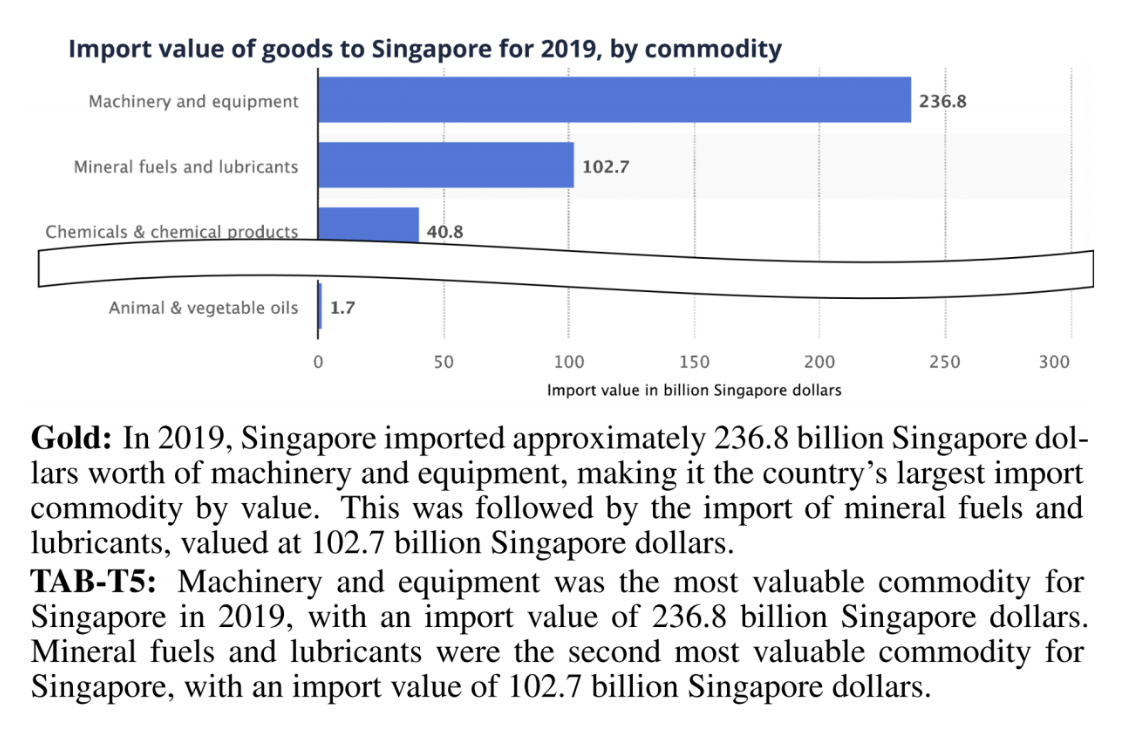 ::: footer Ref: @kantharaj-etal-2022-chart ::: ## VisText * 12.4K Charts with generated + crowd-sourced captions * Scene graphs with a hierarchical representation of a chart's visual elements 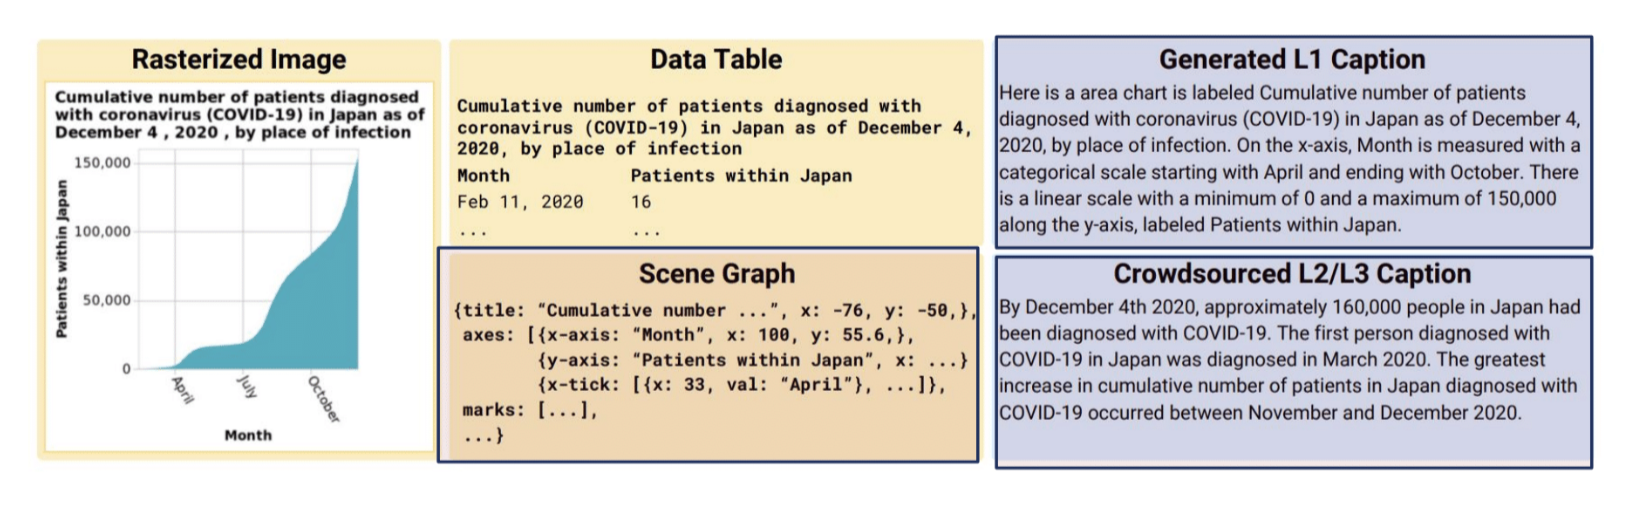 ::: footer Ref: @tang-etal-2023-vistext ::: ## VisText Sample Output 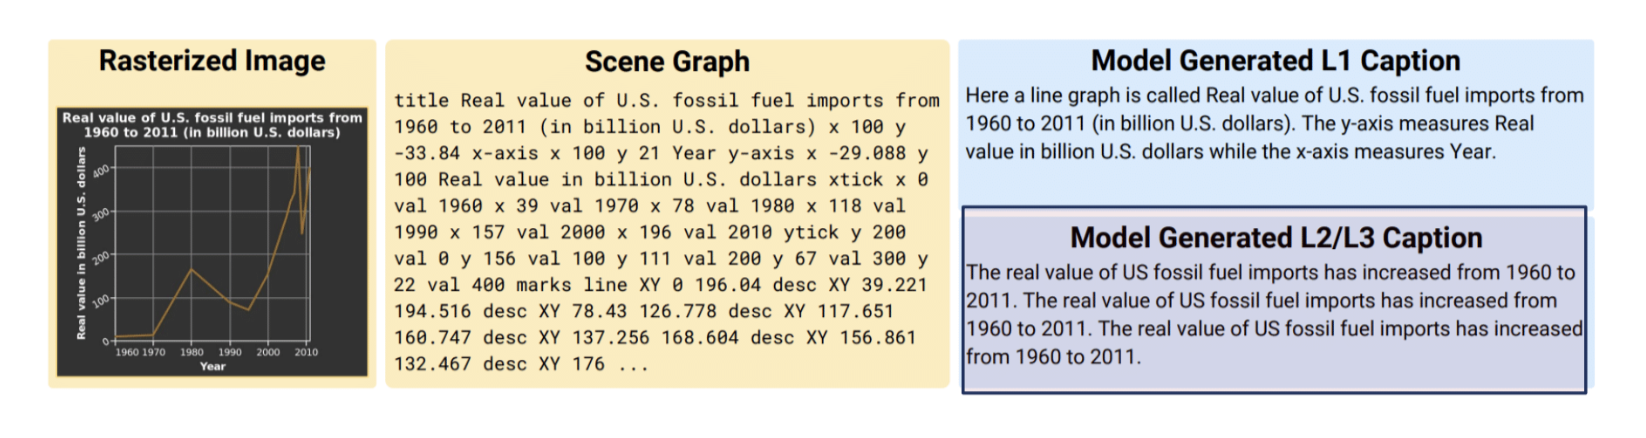 * Correctly identifies upword trends, but repeats this claim twice ::: footer Ref: @tang-etal-2023-vistext ::: ## NL as Output: Open-Ended Question Answering with Charts 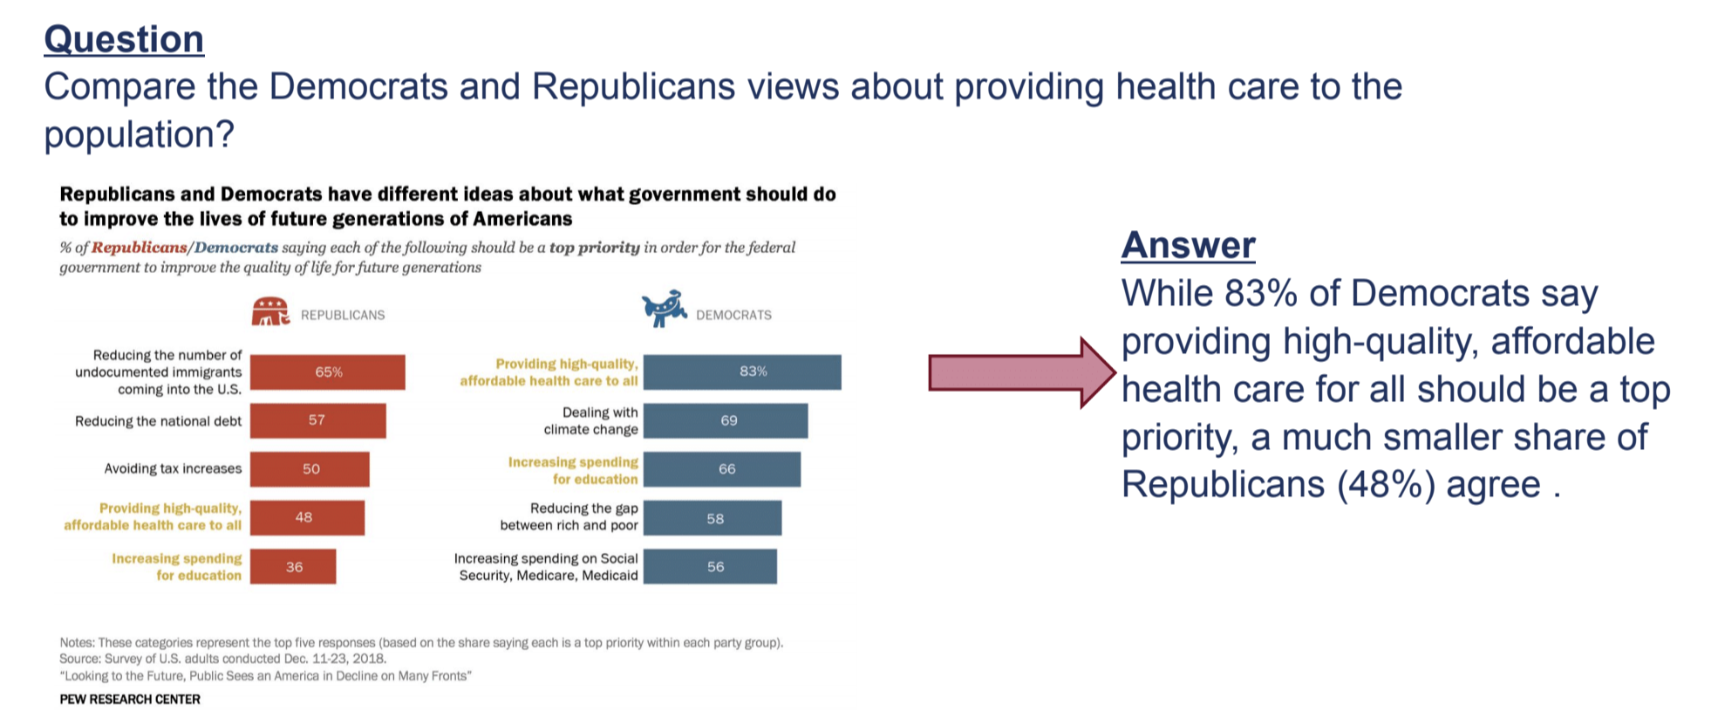 ::: footer Ref: @kantharaj-etal-2022-opencqa ::: ## Combining Language and Visualizations as Output * Roles of natural language * Generating explanatory answer * Explaining the answer 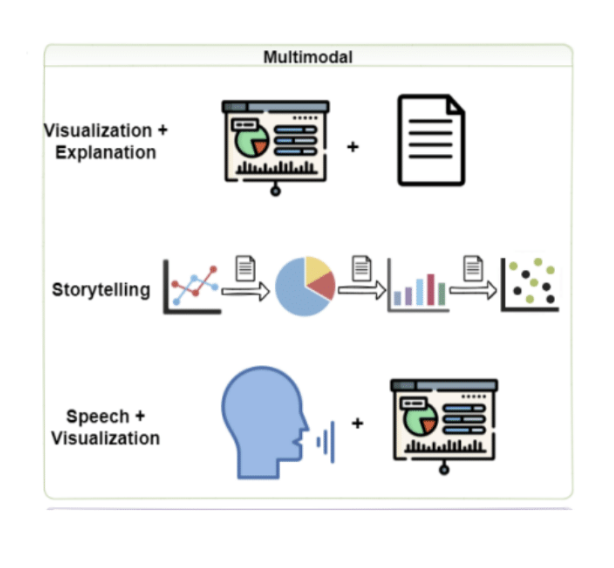 ## Combining Language and Visualizations as Output * An example of combining text and vis as a multimodal output 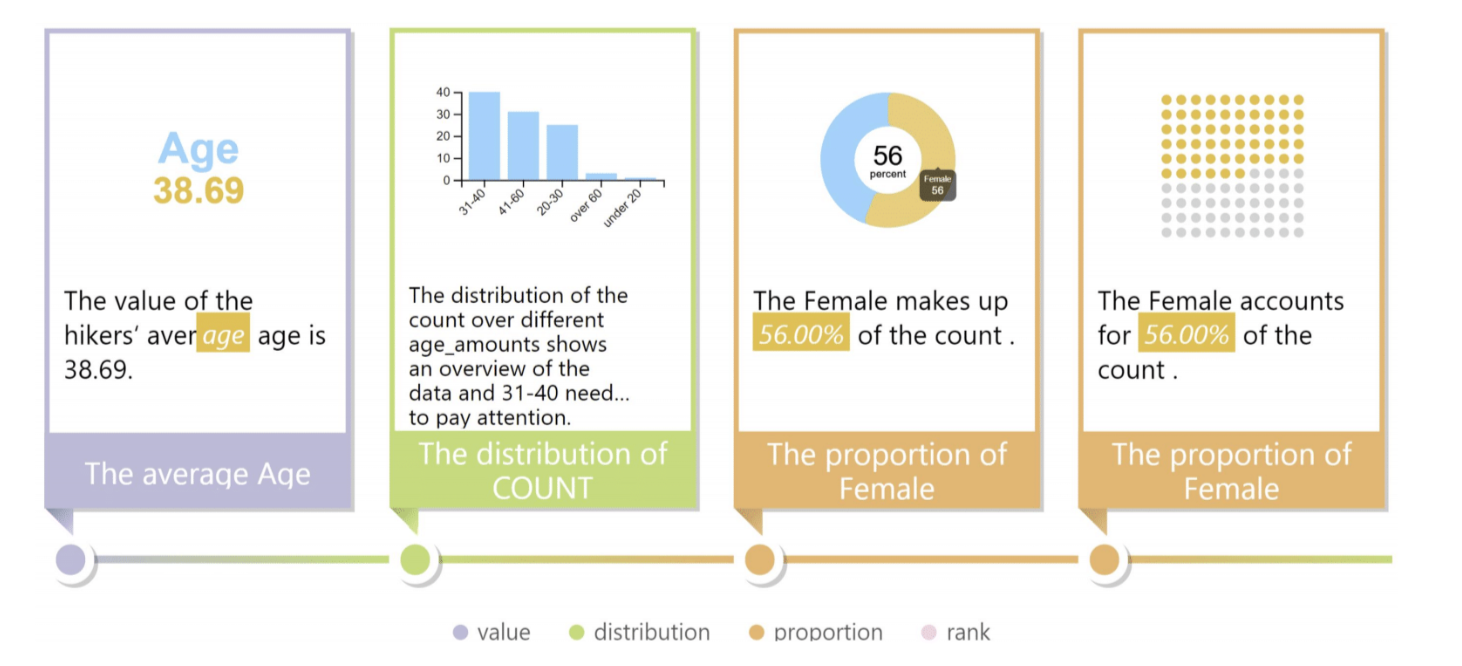 ::: footer Ref: @DBLP:journals/corr/abs-2010-09975 ::: ## Combining Language and Visualizations as Output * DataShot (Yun et al., 2019) 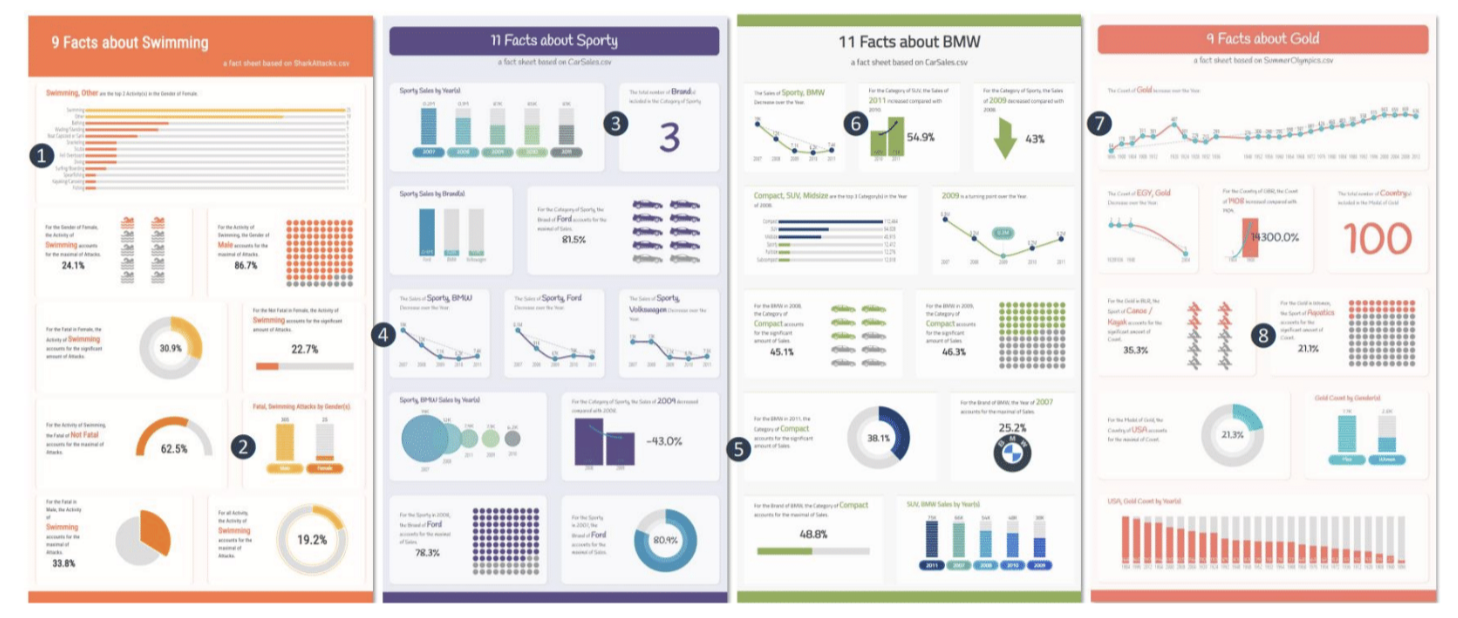 ::: footer Ref: @Wang2020DataShotAG ::: ## Conversational QA With Visualization * Evizeon (Hoque et al., TVCG 2017) 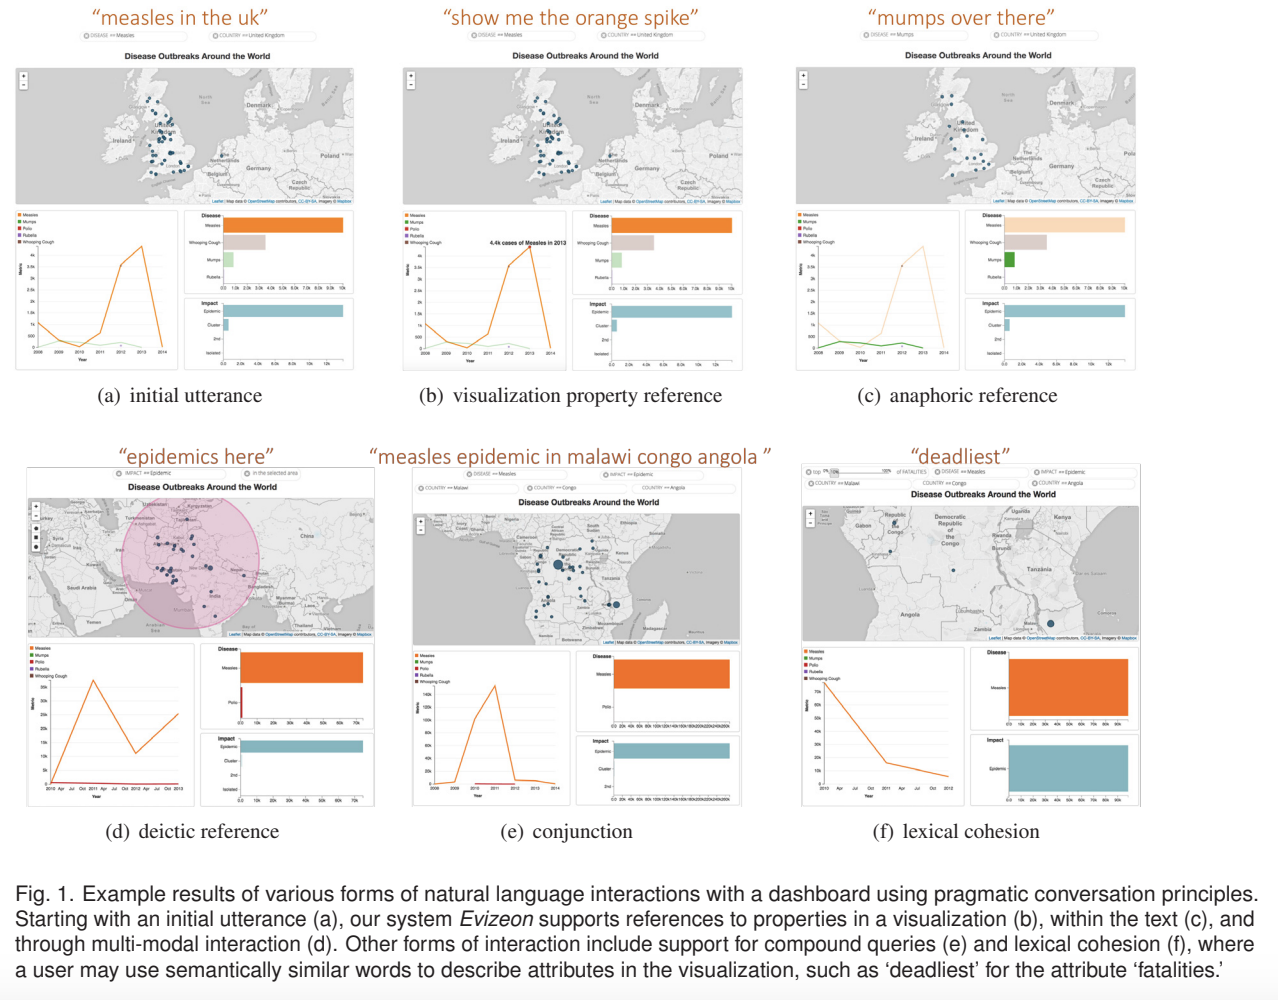 ## Open Challenges & Ongoing Research * Design of natural language interfaces * Must consider richness and ambiguities of natural language * Complex reasoning required to predict the answer * Computer vision challenges for automatic understanding of image charts * Inherently interdisciplinary (HCI, ML, NLP, InfoVis, Computer Vision) ## Open Challenges & Ongoing Research * Dataset creation * Need for large-scale, real-world benchmark datasets * Most existing datasets lack realism * For many problem setups, there is no benchmark ## Open Challenges & Ongoing Research * Challenges with natural language generation * Hallucinations * Factual errors * Perceptual and reasoning aspects * Computer Vision Challenges ## Open Challenges & Ongoing Research 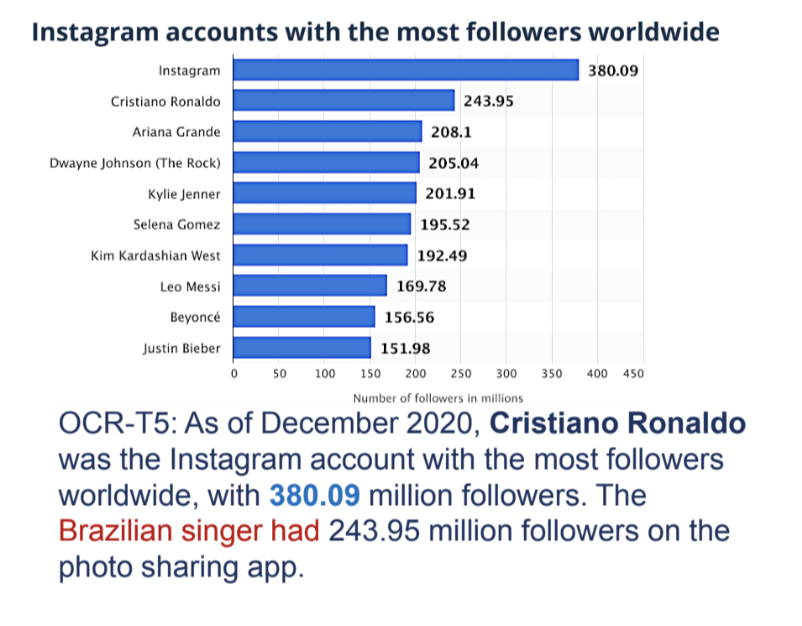 ## Open Challenges & Ongoing Research 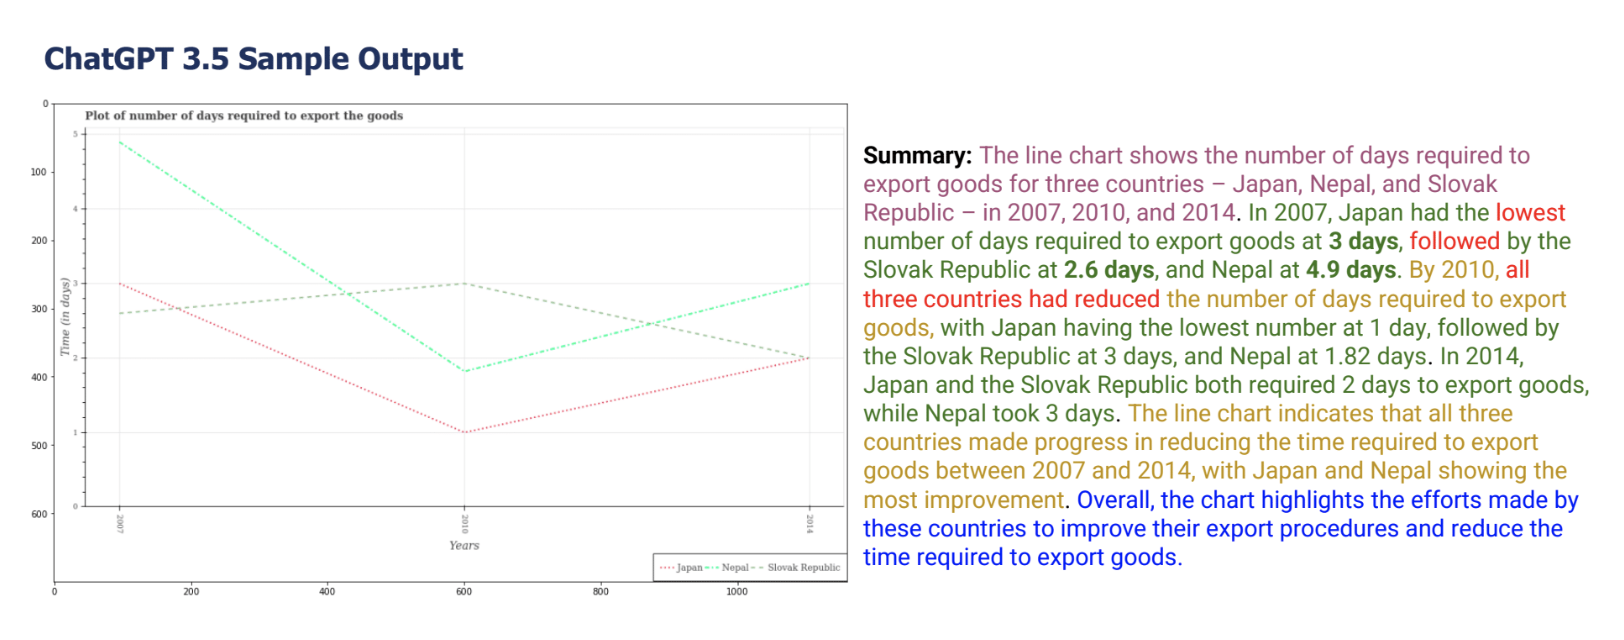 ## Open Challenges & Ongoing Research * Improving logical and visual reasoning 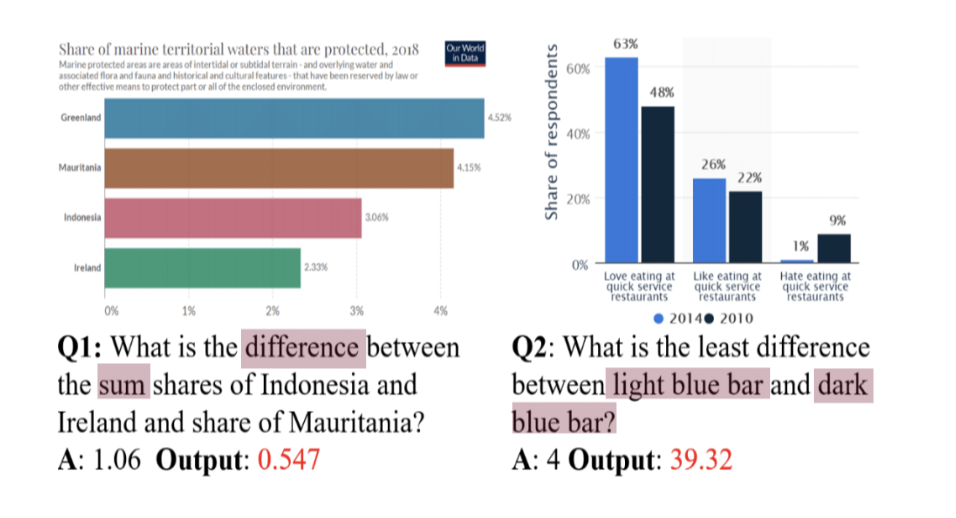 ::: footer Ref: @masry-etal-2022-chartqa ::: ## Open Challenges & Ongoing Research * Computer vision challenges (e.g. chart data extraction) 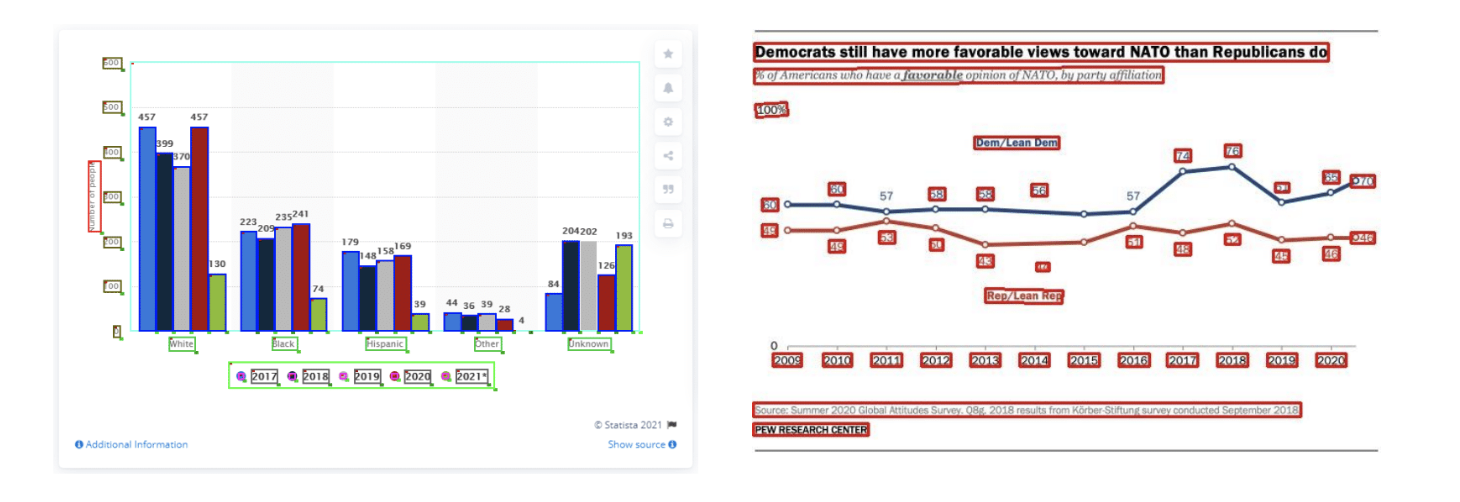 ::: footer Ref: @masry-etal-2022-chartqa ::: ## Open Challenges & Ongoing Research * How can we effectively combine text and visualization in data stories? 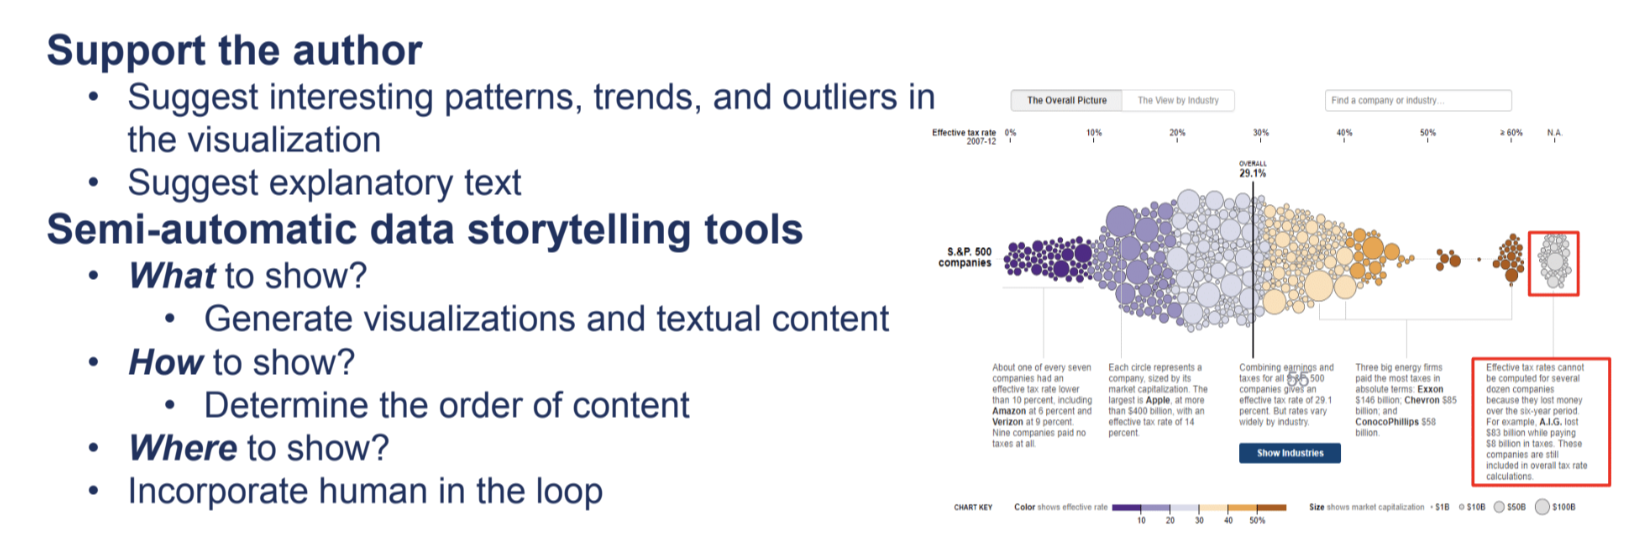 ## Open Challenges & Ongoing Research * NLP for Visualization accessiblity 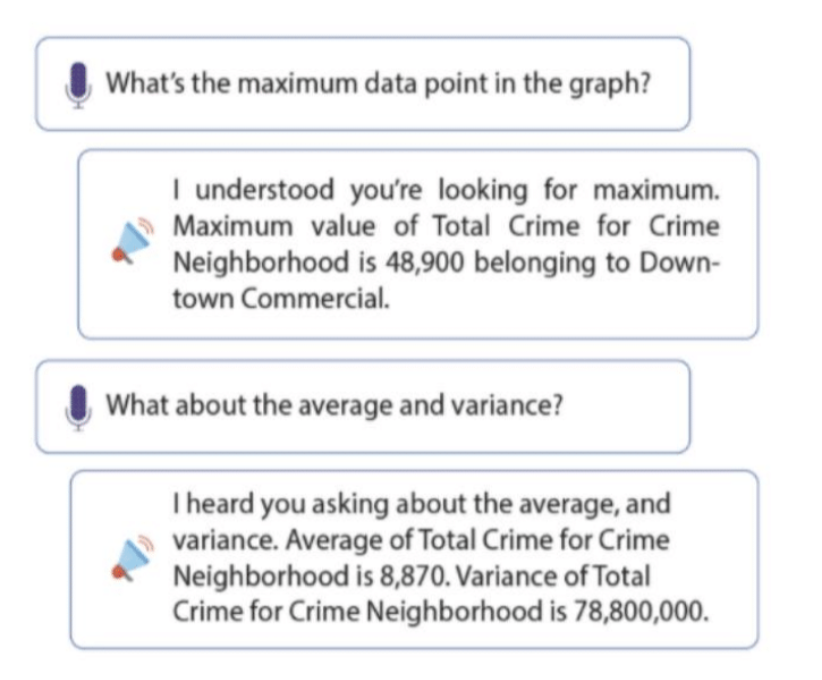{width=70%} ::: footer Ref: @10.1145/3491102.3517431 ::: ## Open Challenges & Ongoing Research * NLP for Visualization accessiblity 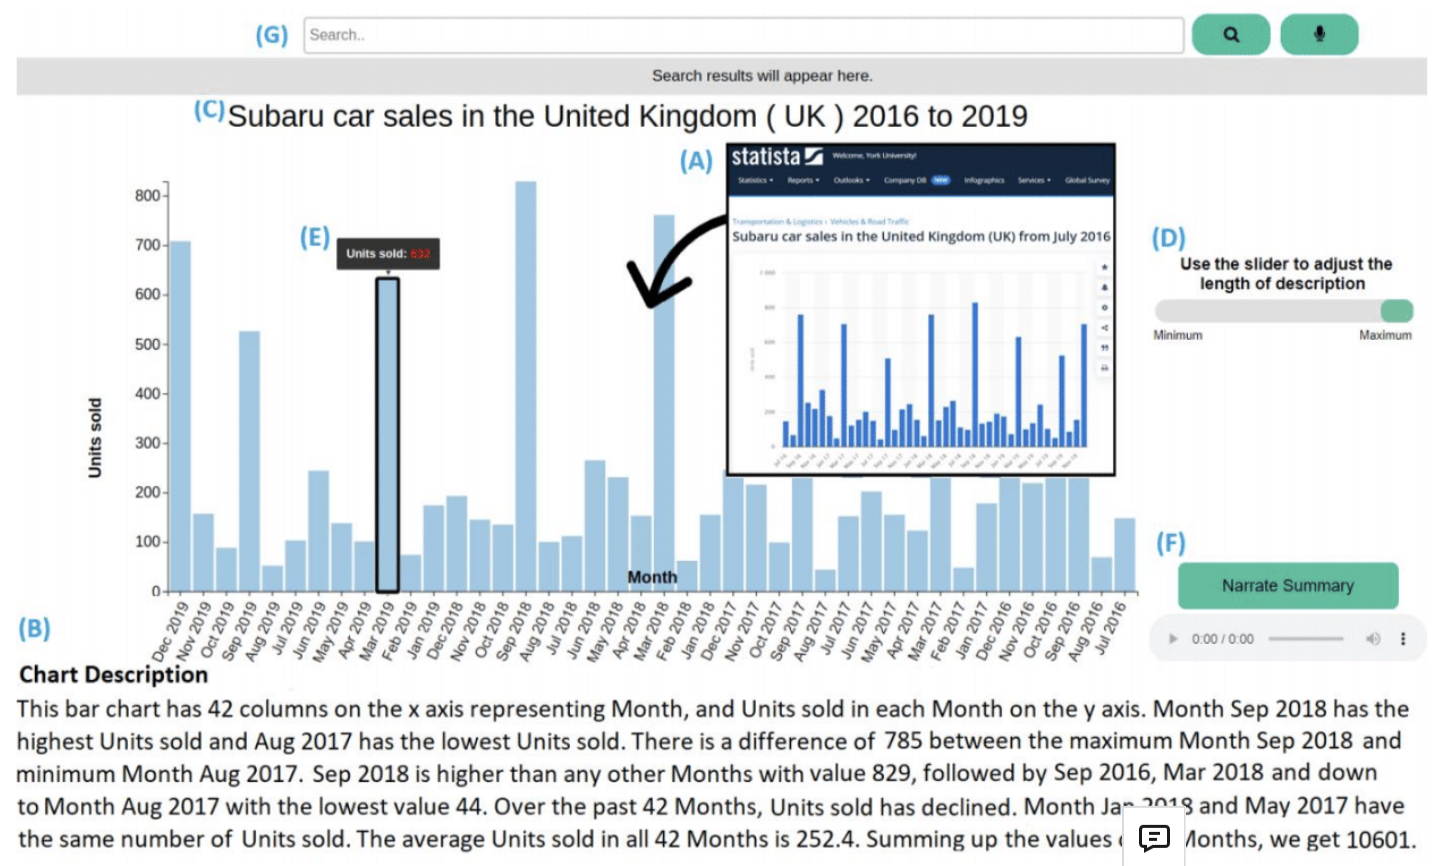{width=90%} ::: footer Ref: @Alam_et_al ::: ## Project Proposal Feedback * For the remainder of the lab, please look over the feedback on your project proposals with your group members * Any questions? Concerns? Any progress you want feedback on? Feel free to ask now ## References
