Welcome back to the Visualization for Machine Learning Lab!
Week 9: Topological Data Analysis
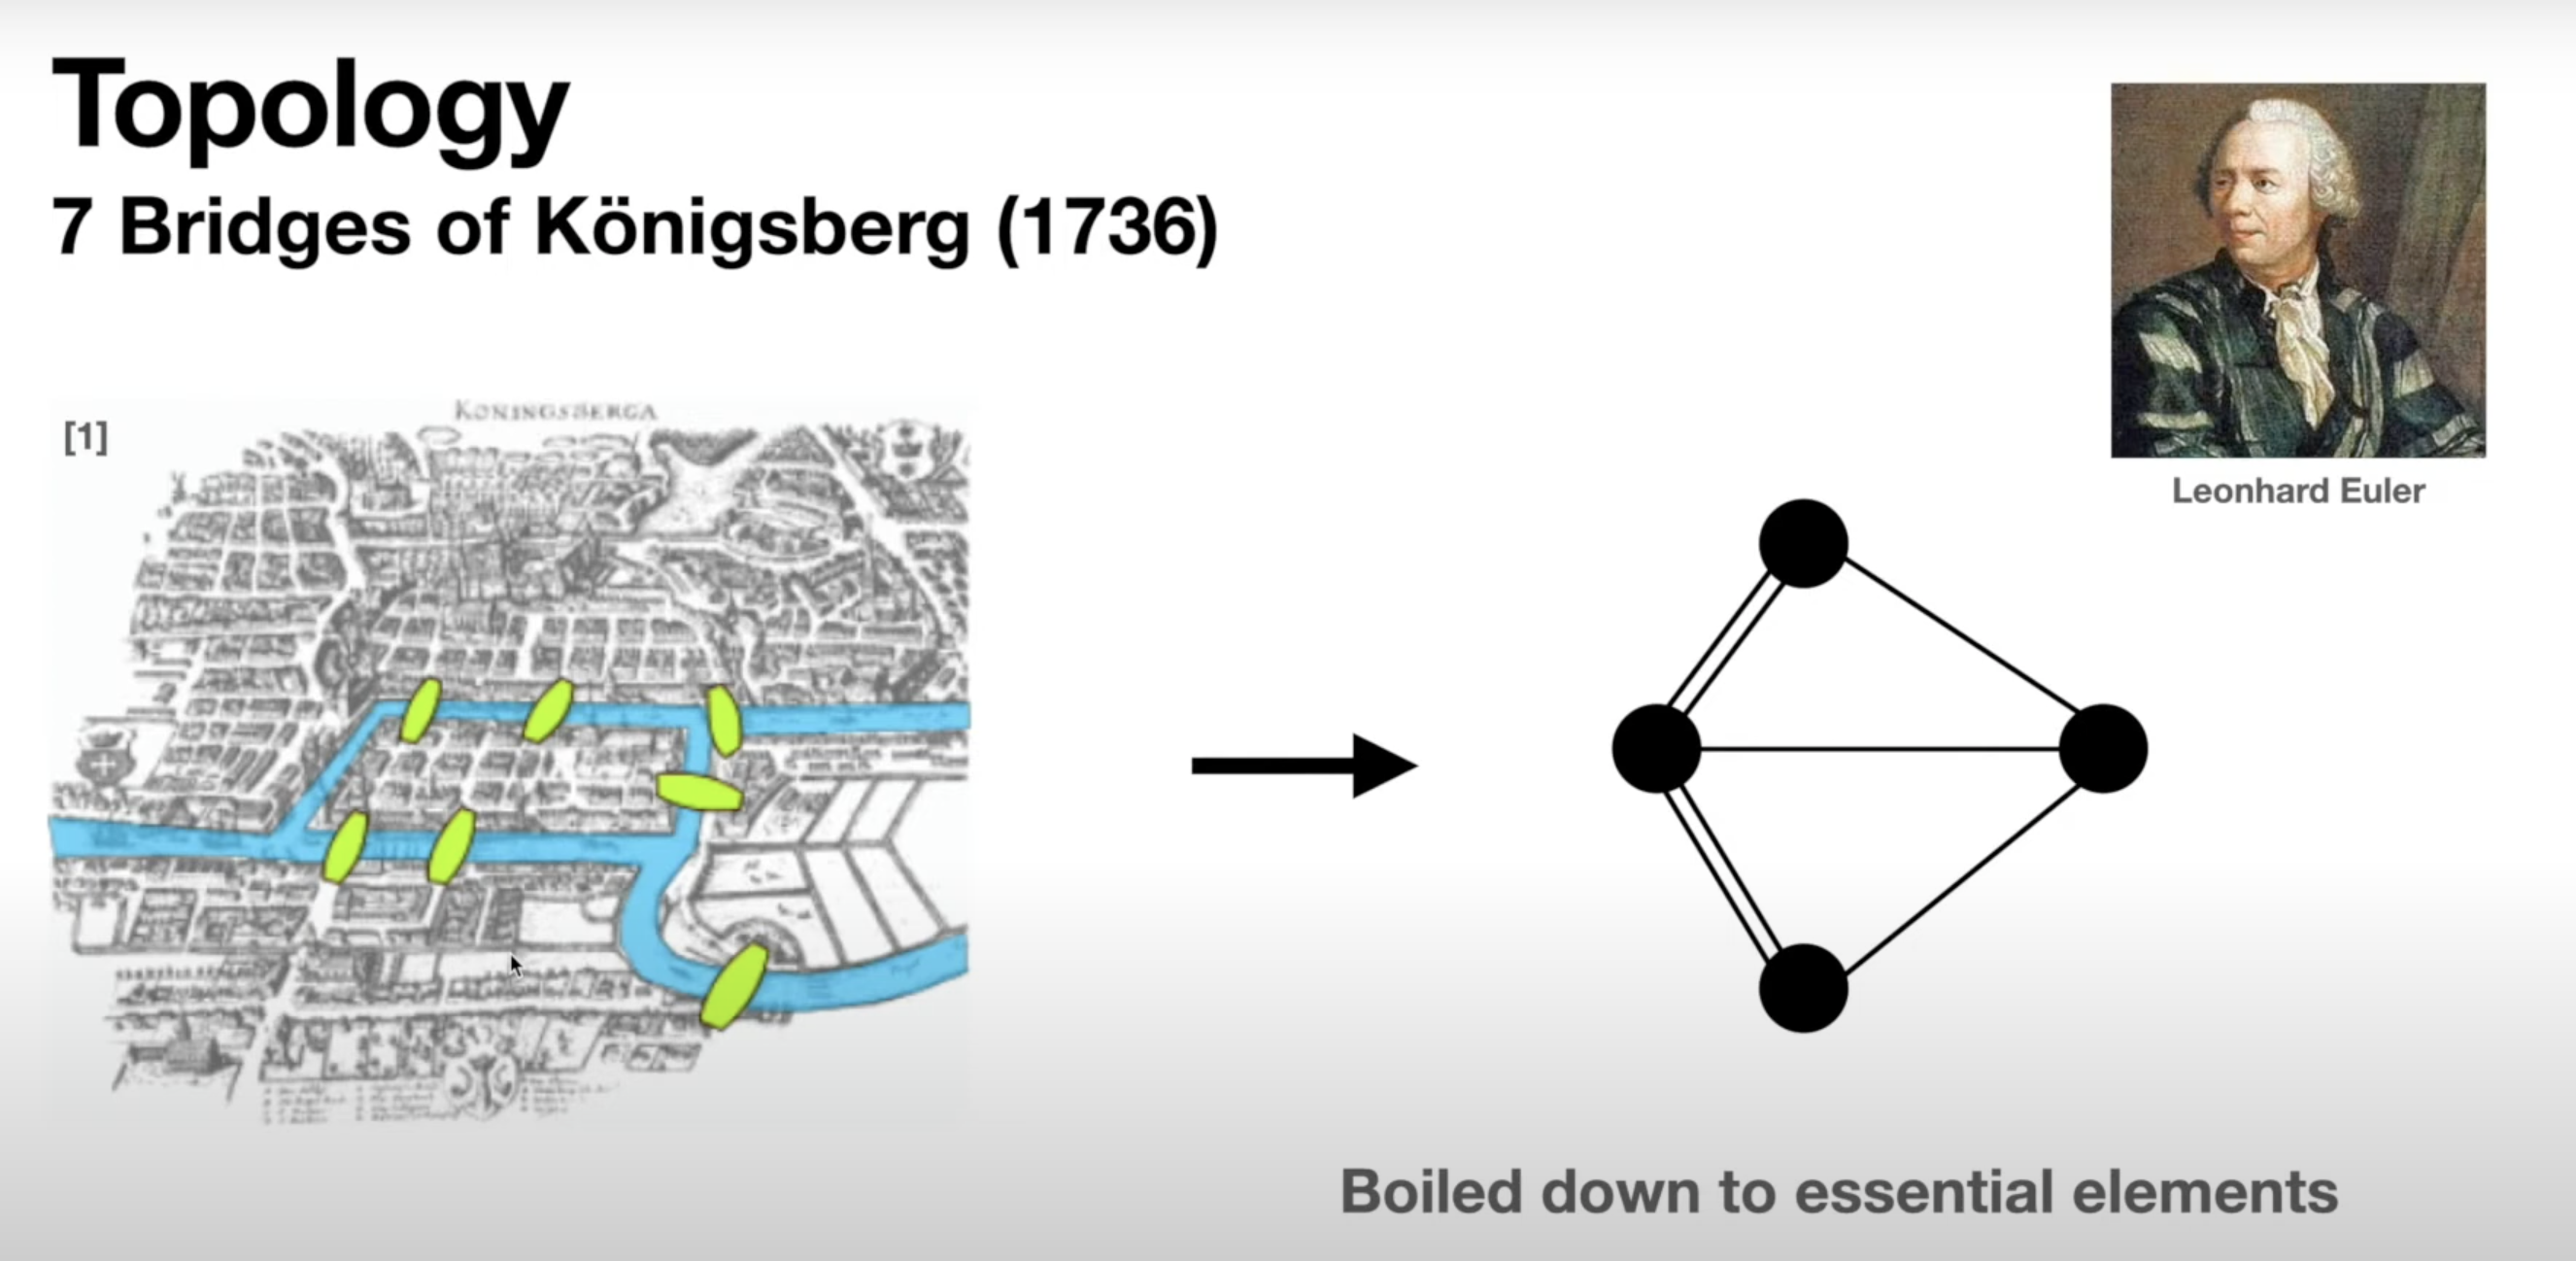
The Seven Bridges of Königsberg
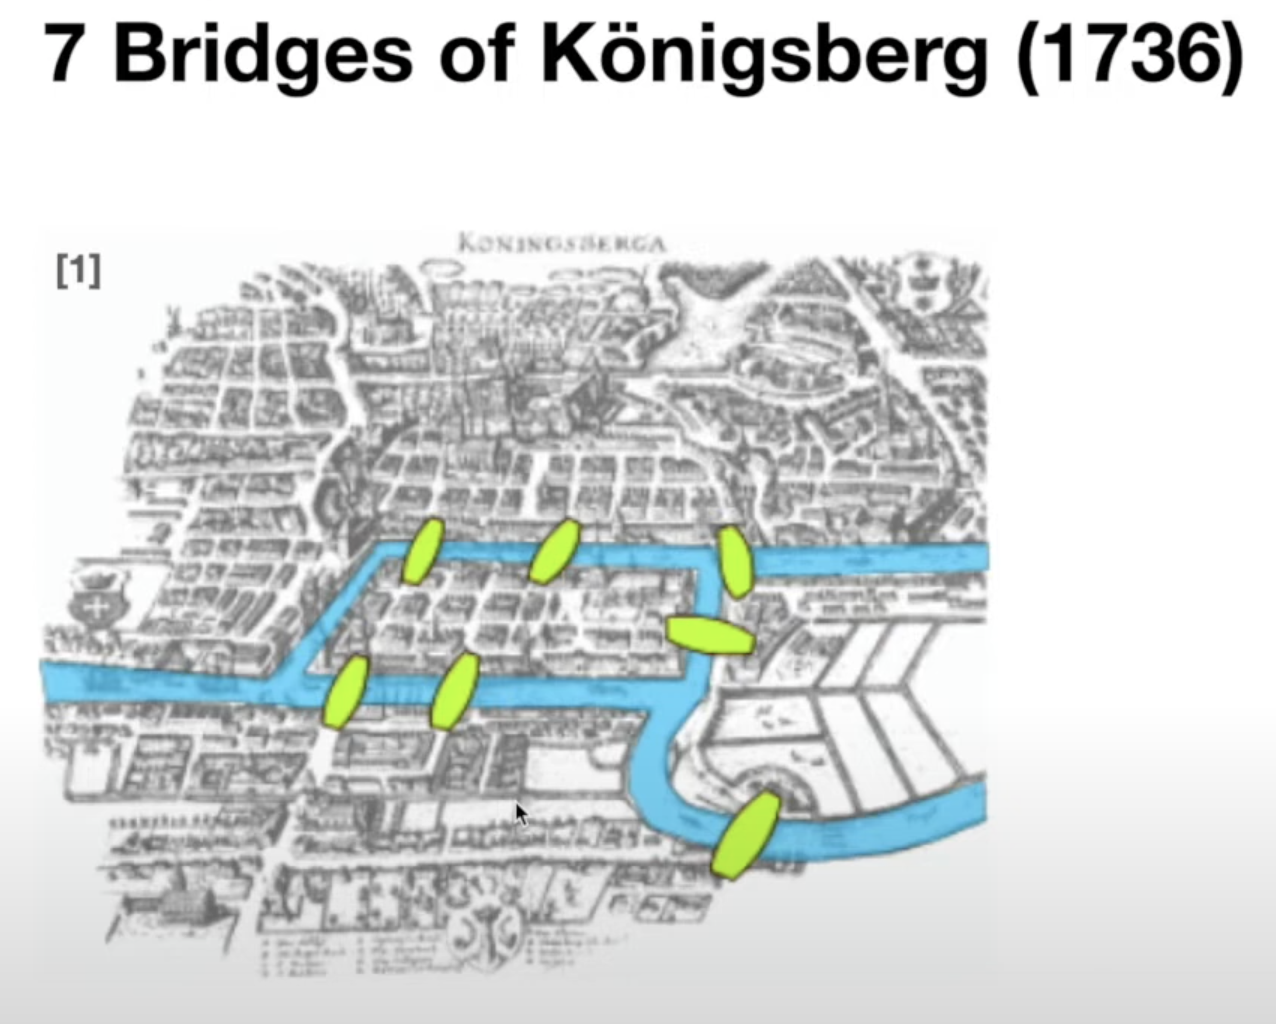
The Seven Bridges of Königsberg
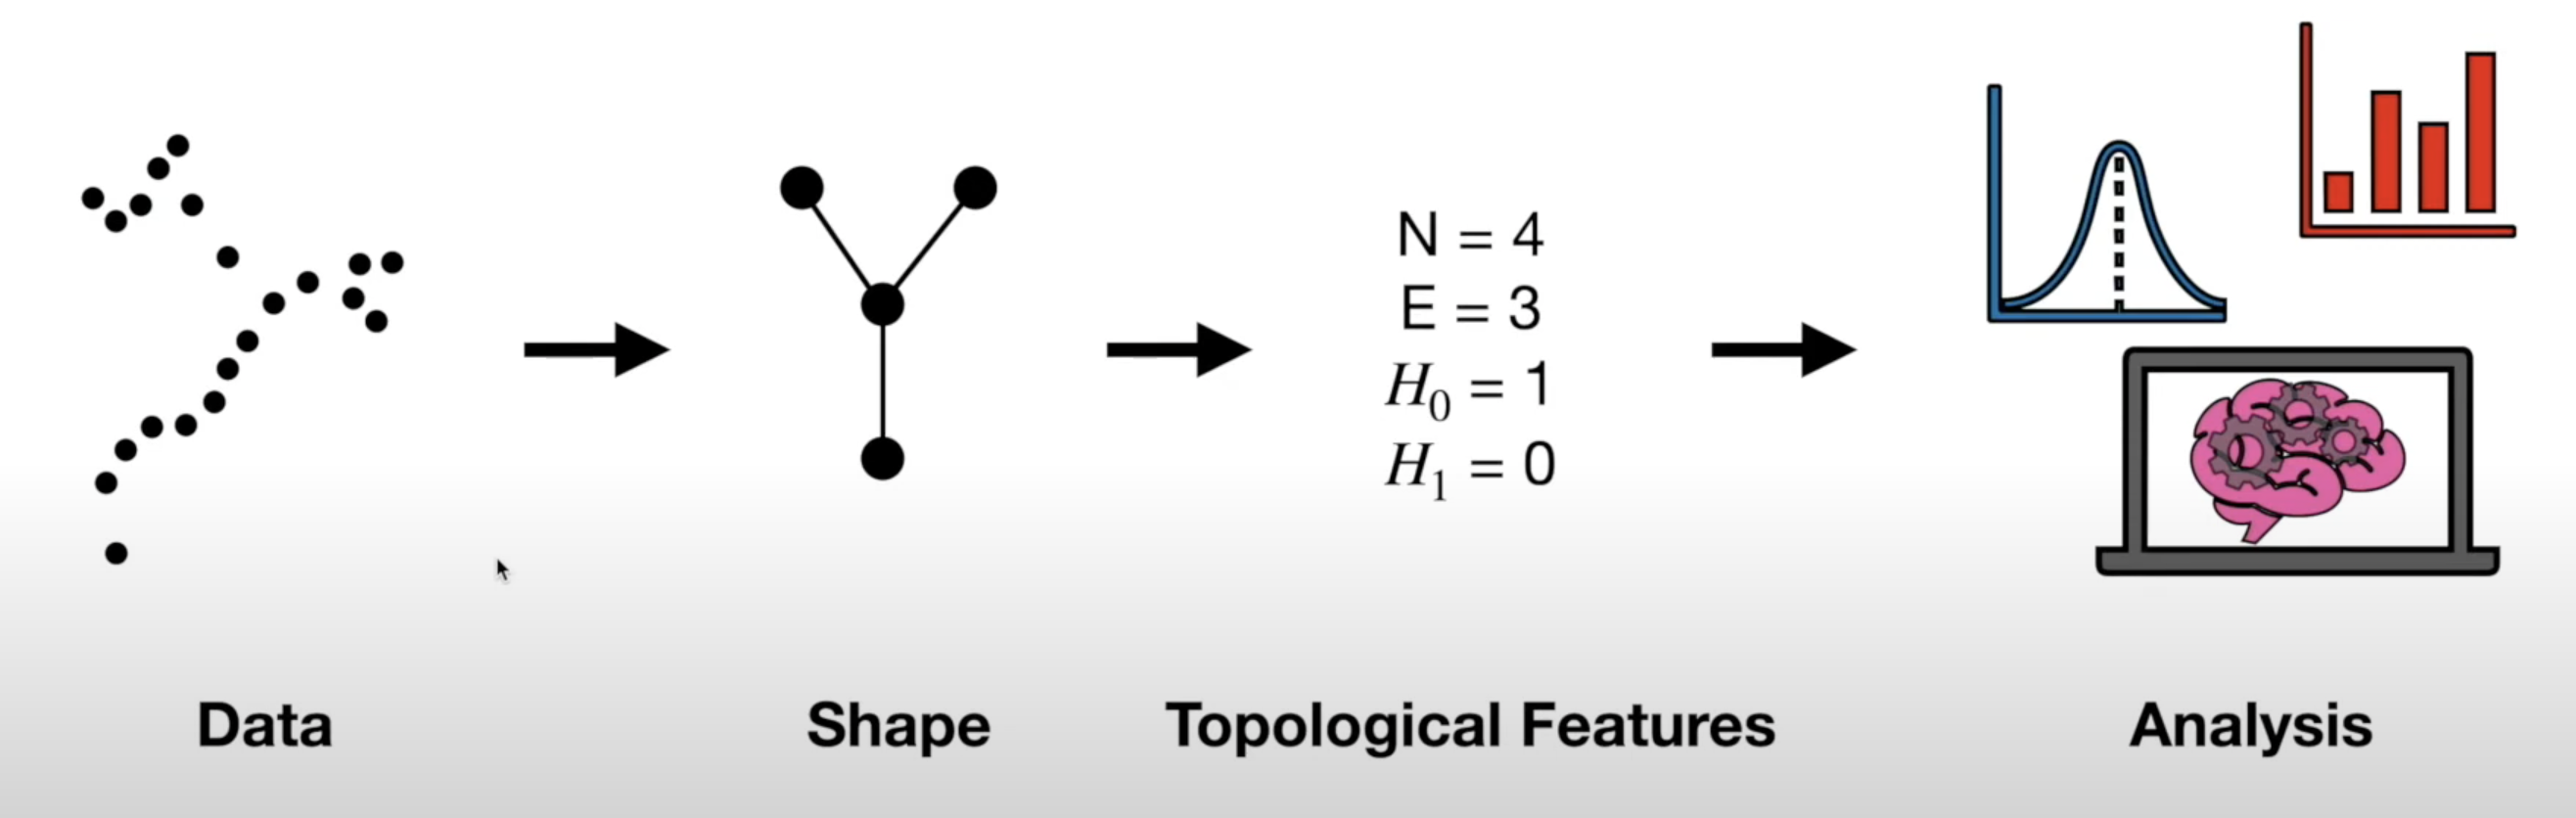
General TDA Pipeline
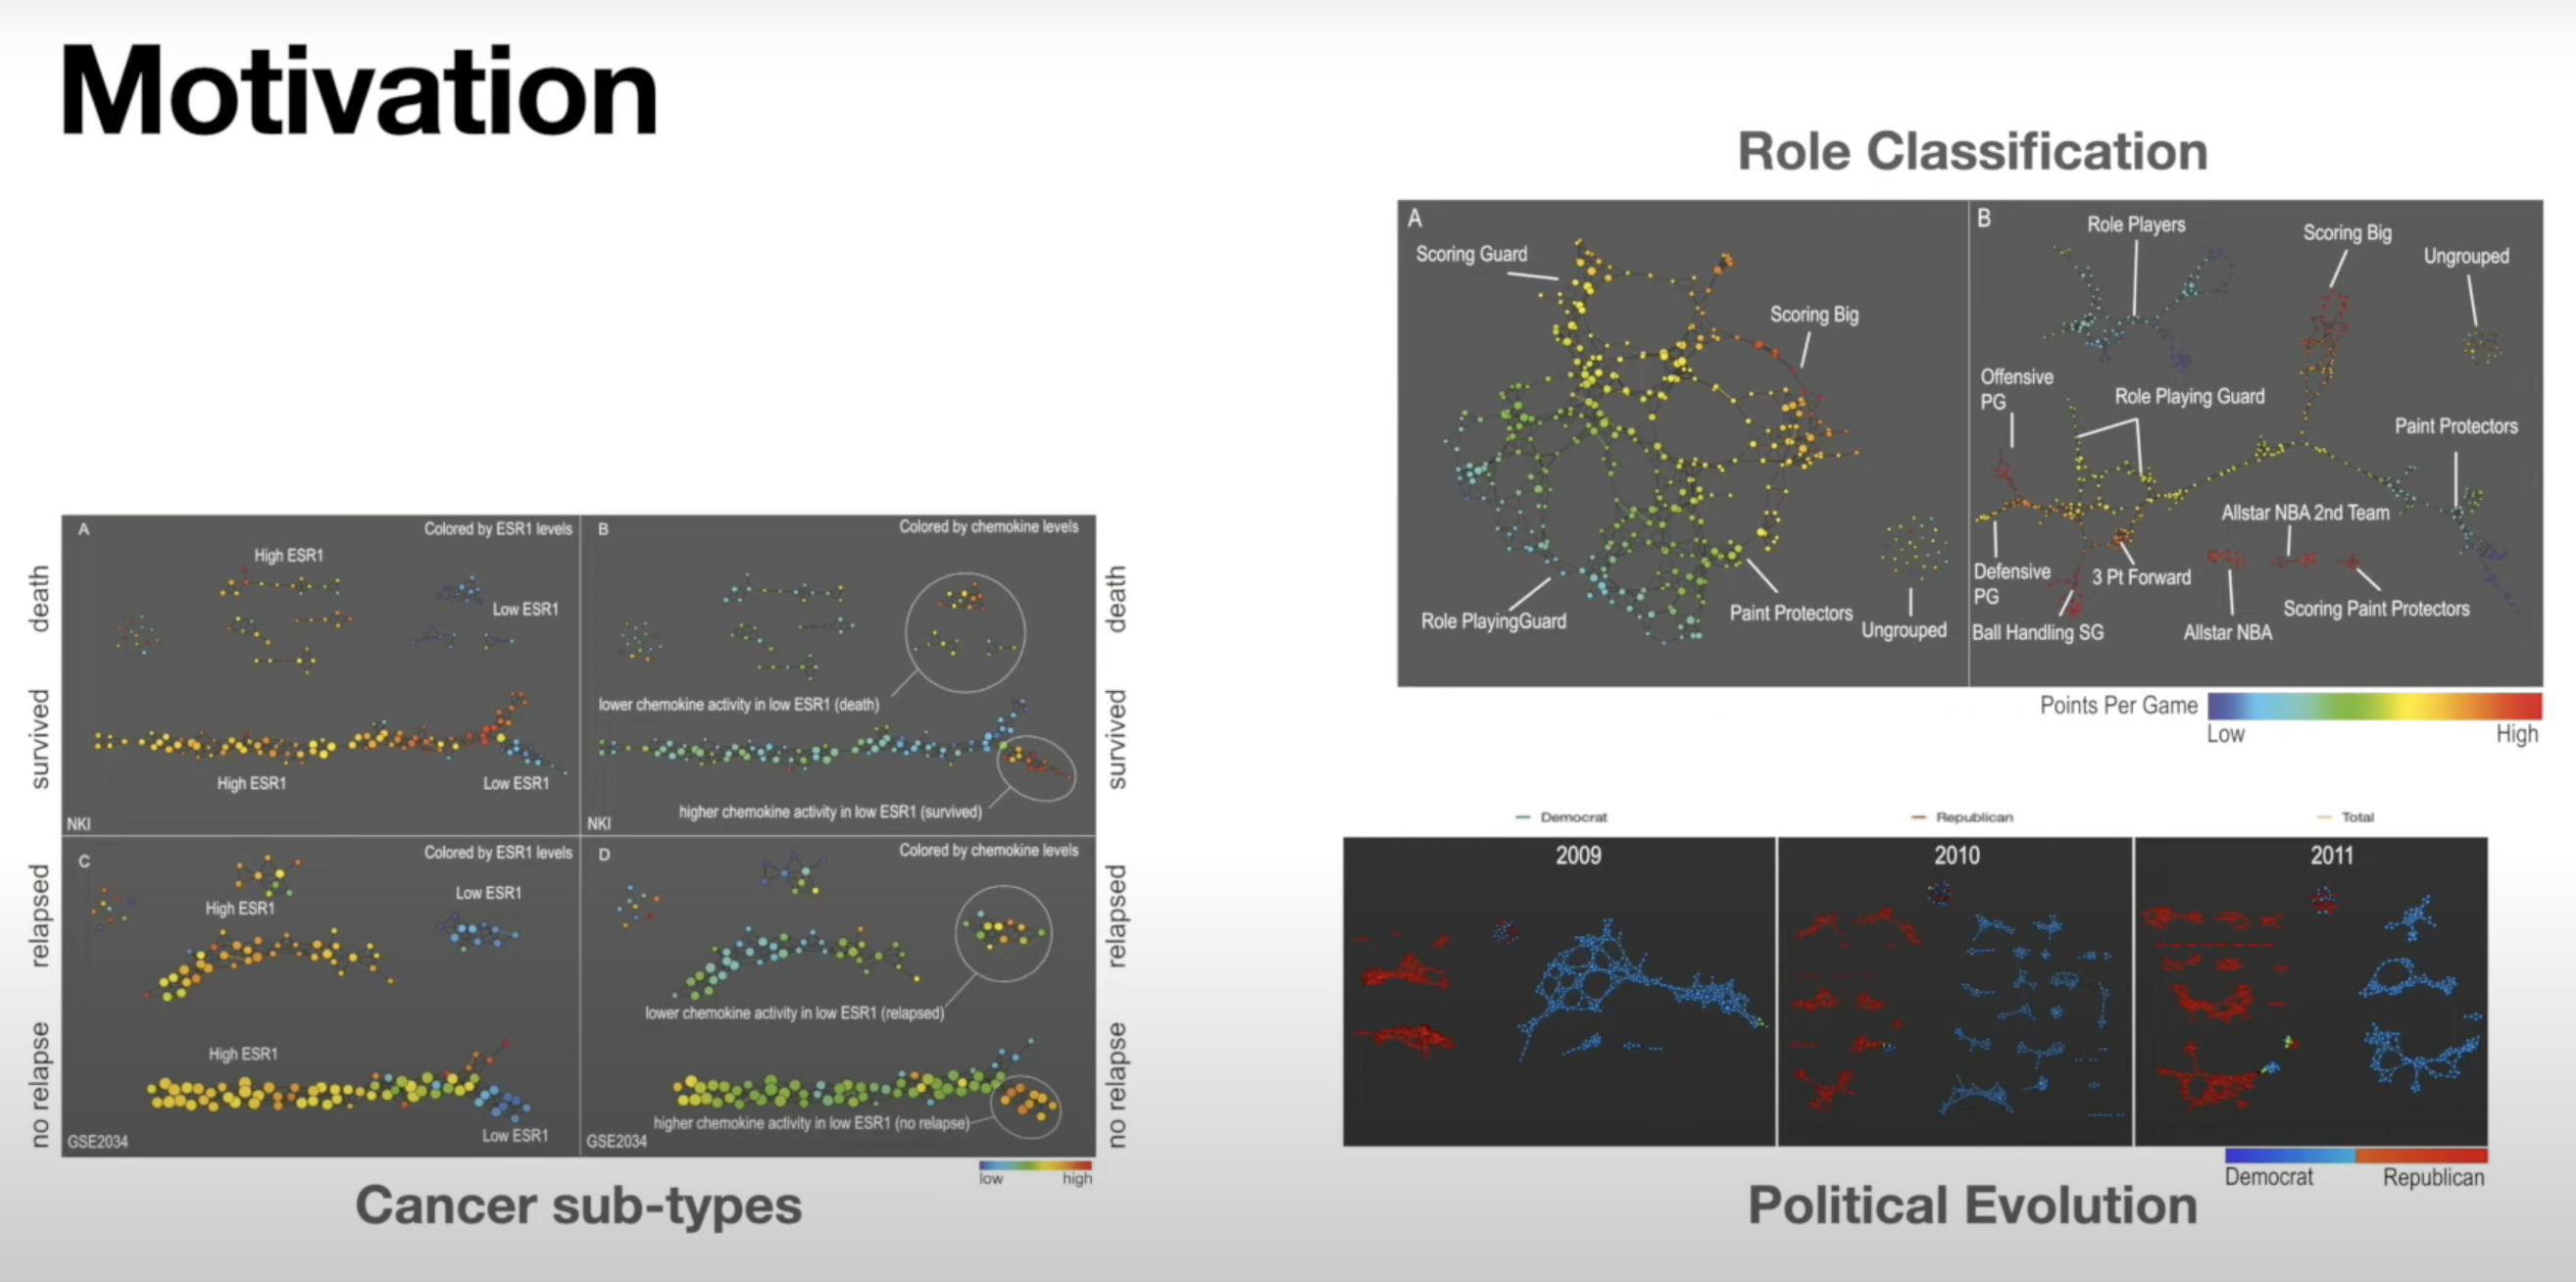
Real World Applications of TDA
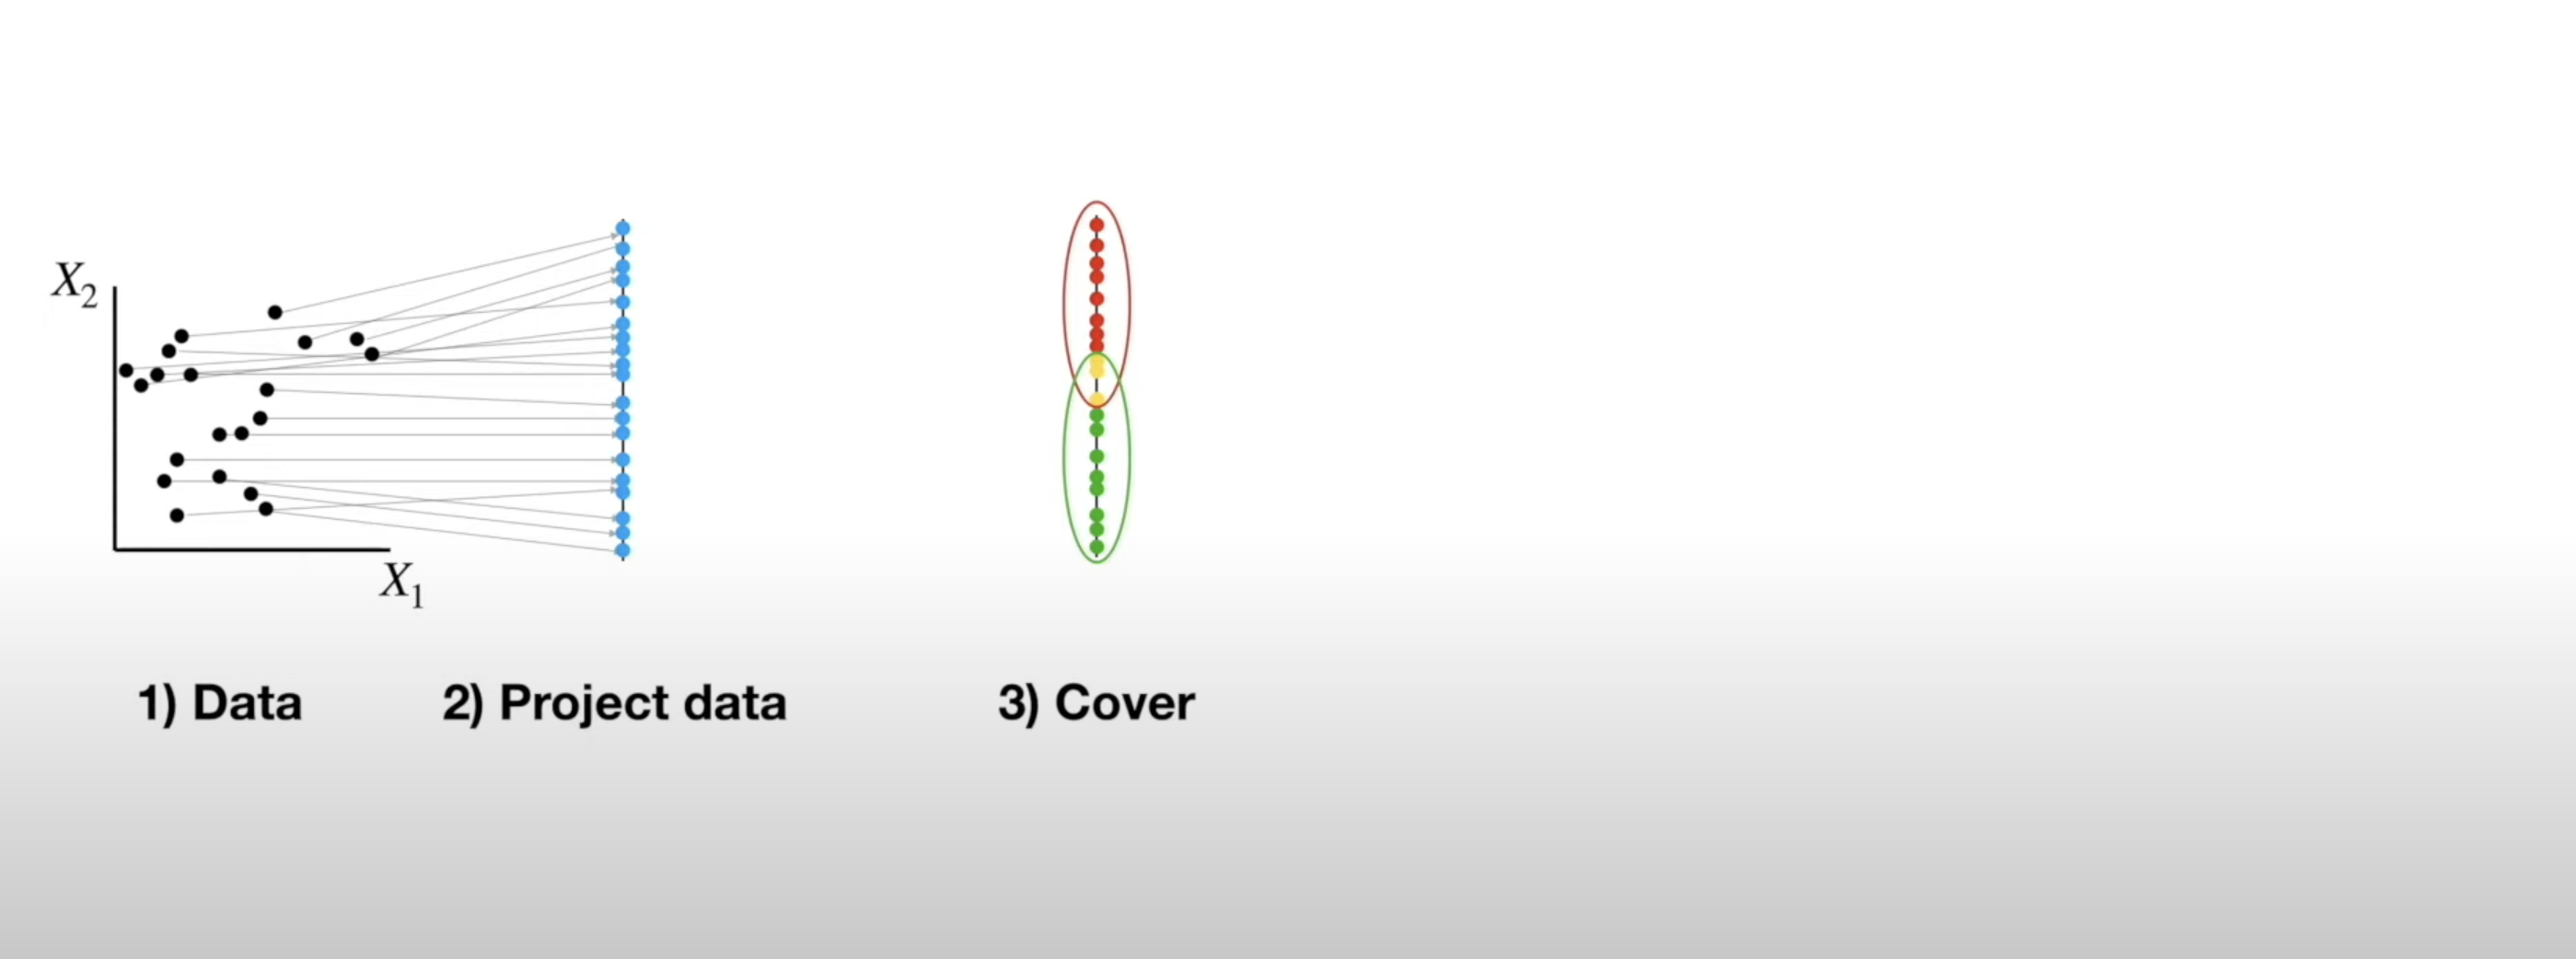
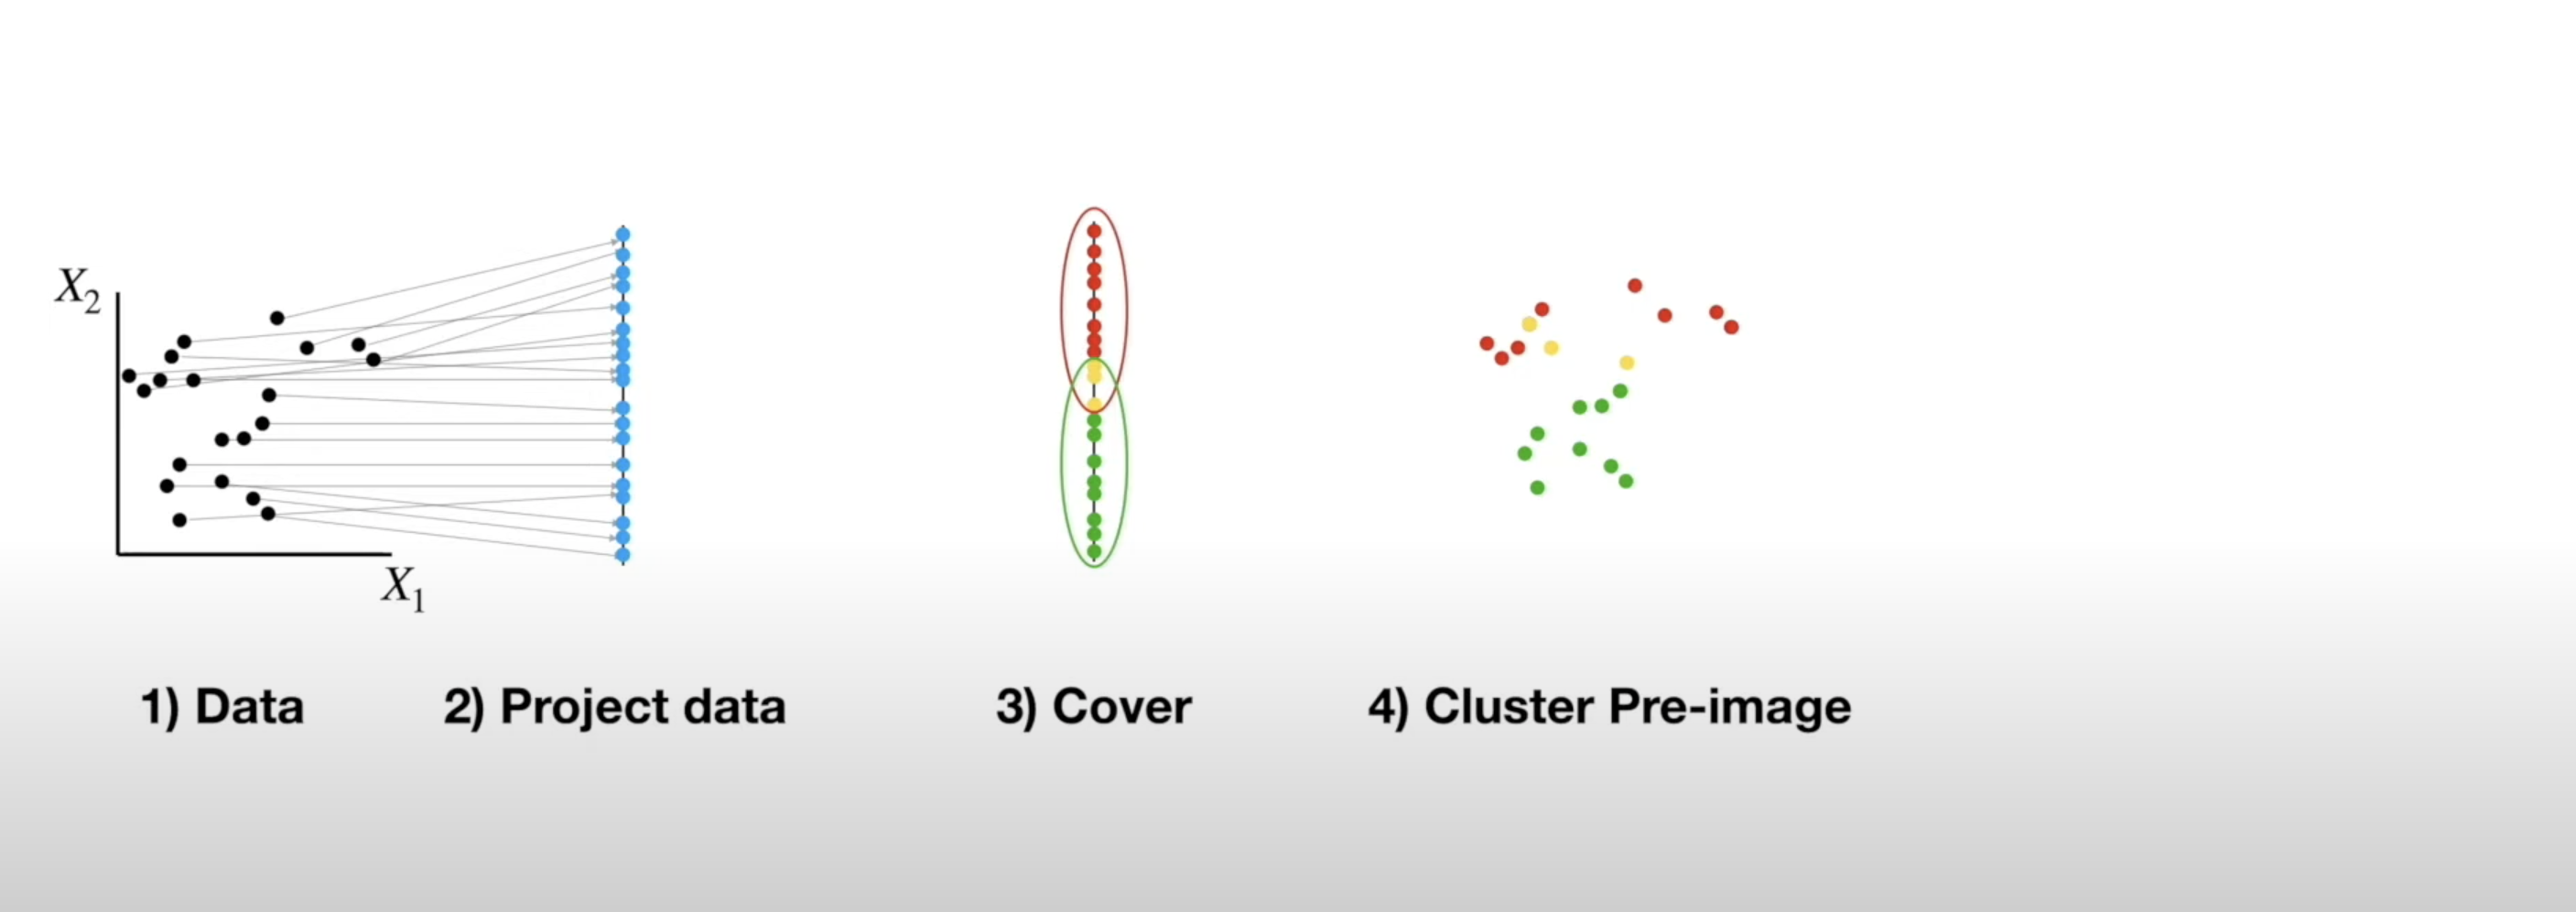
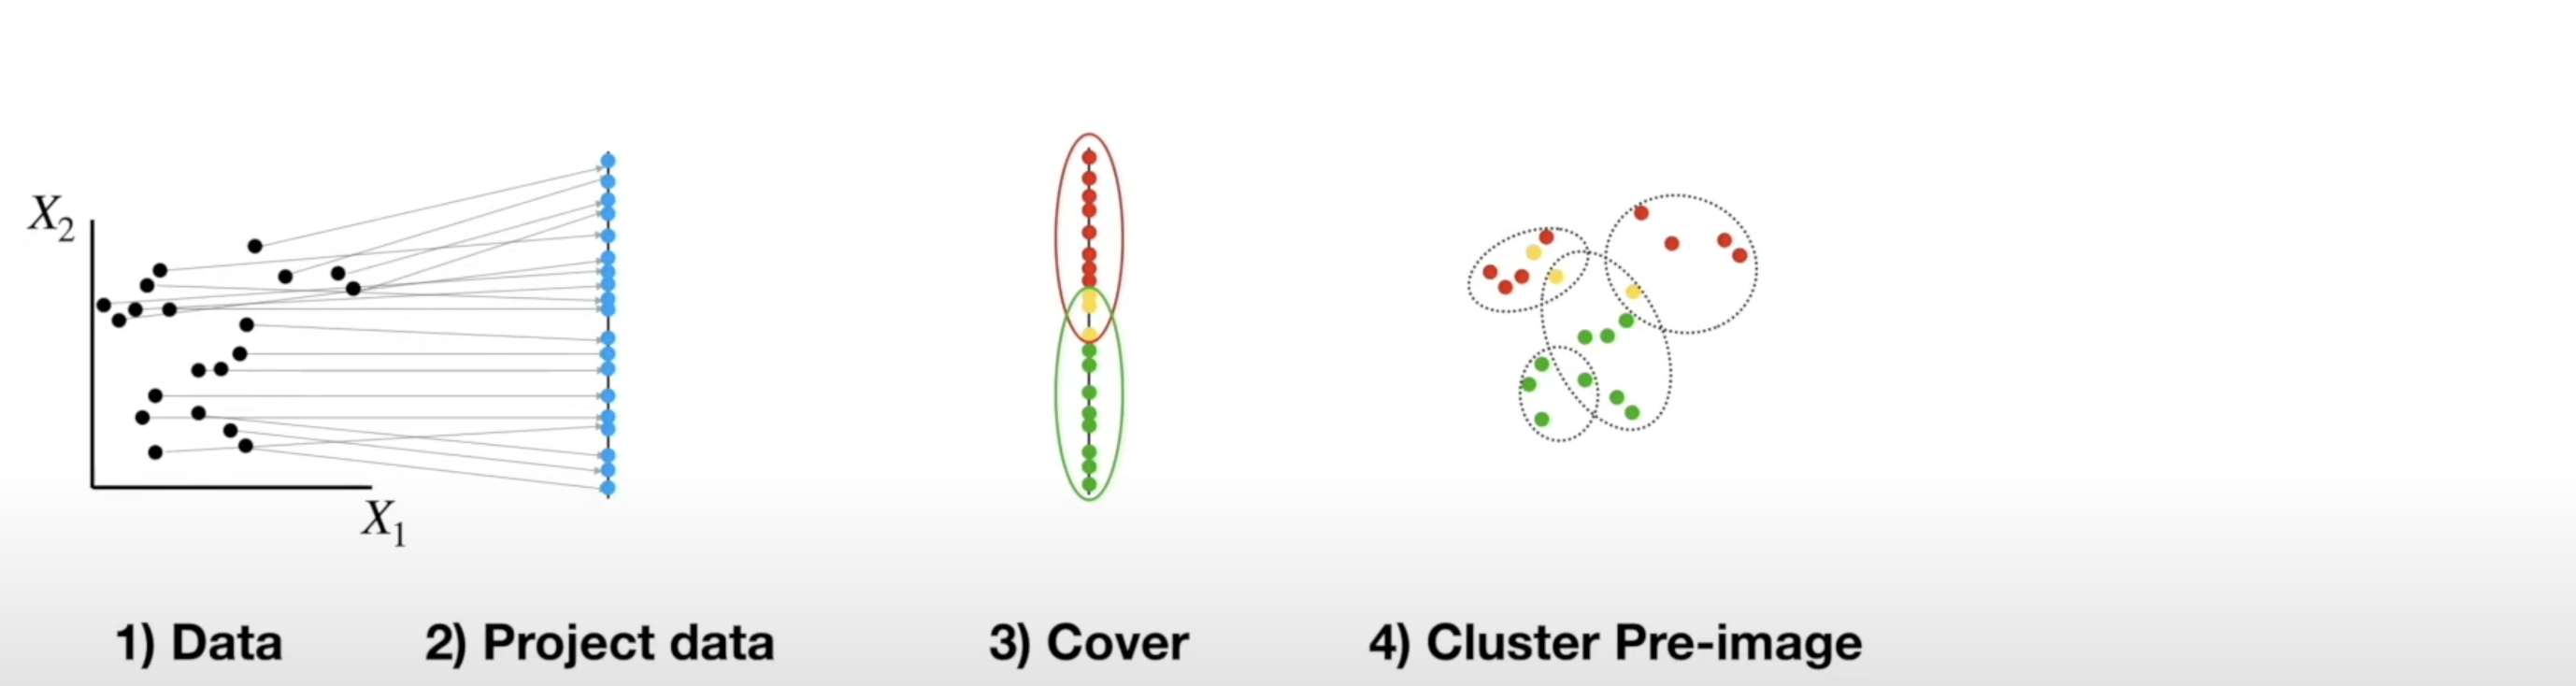
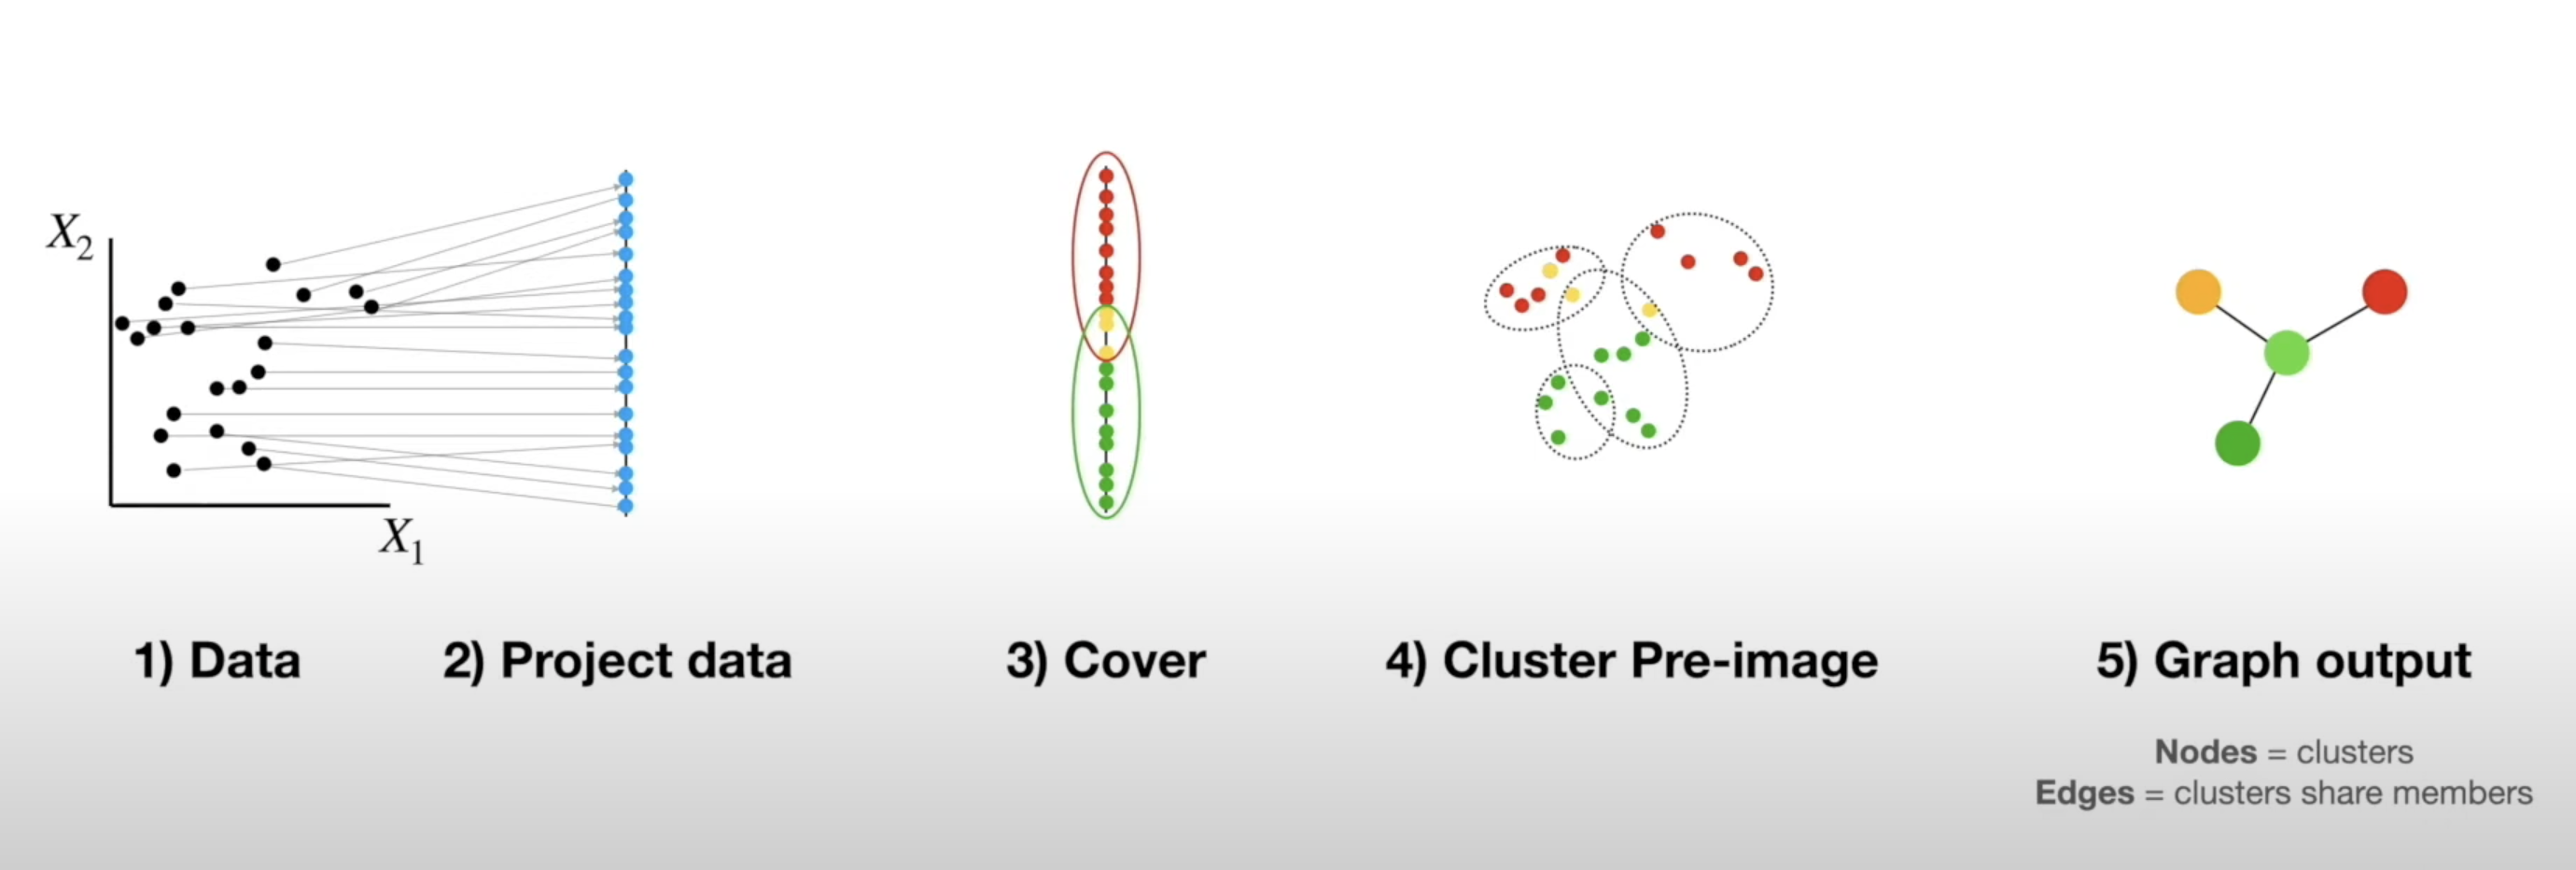
Mapper Algorithm
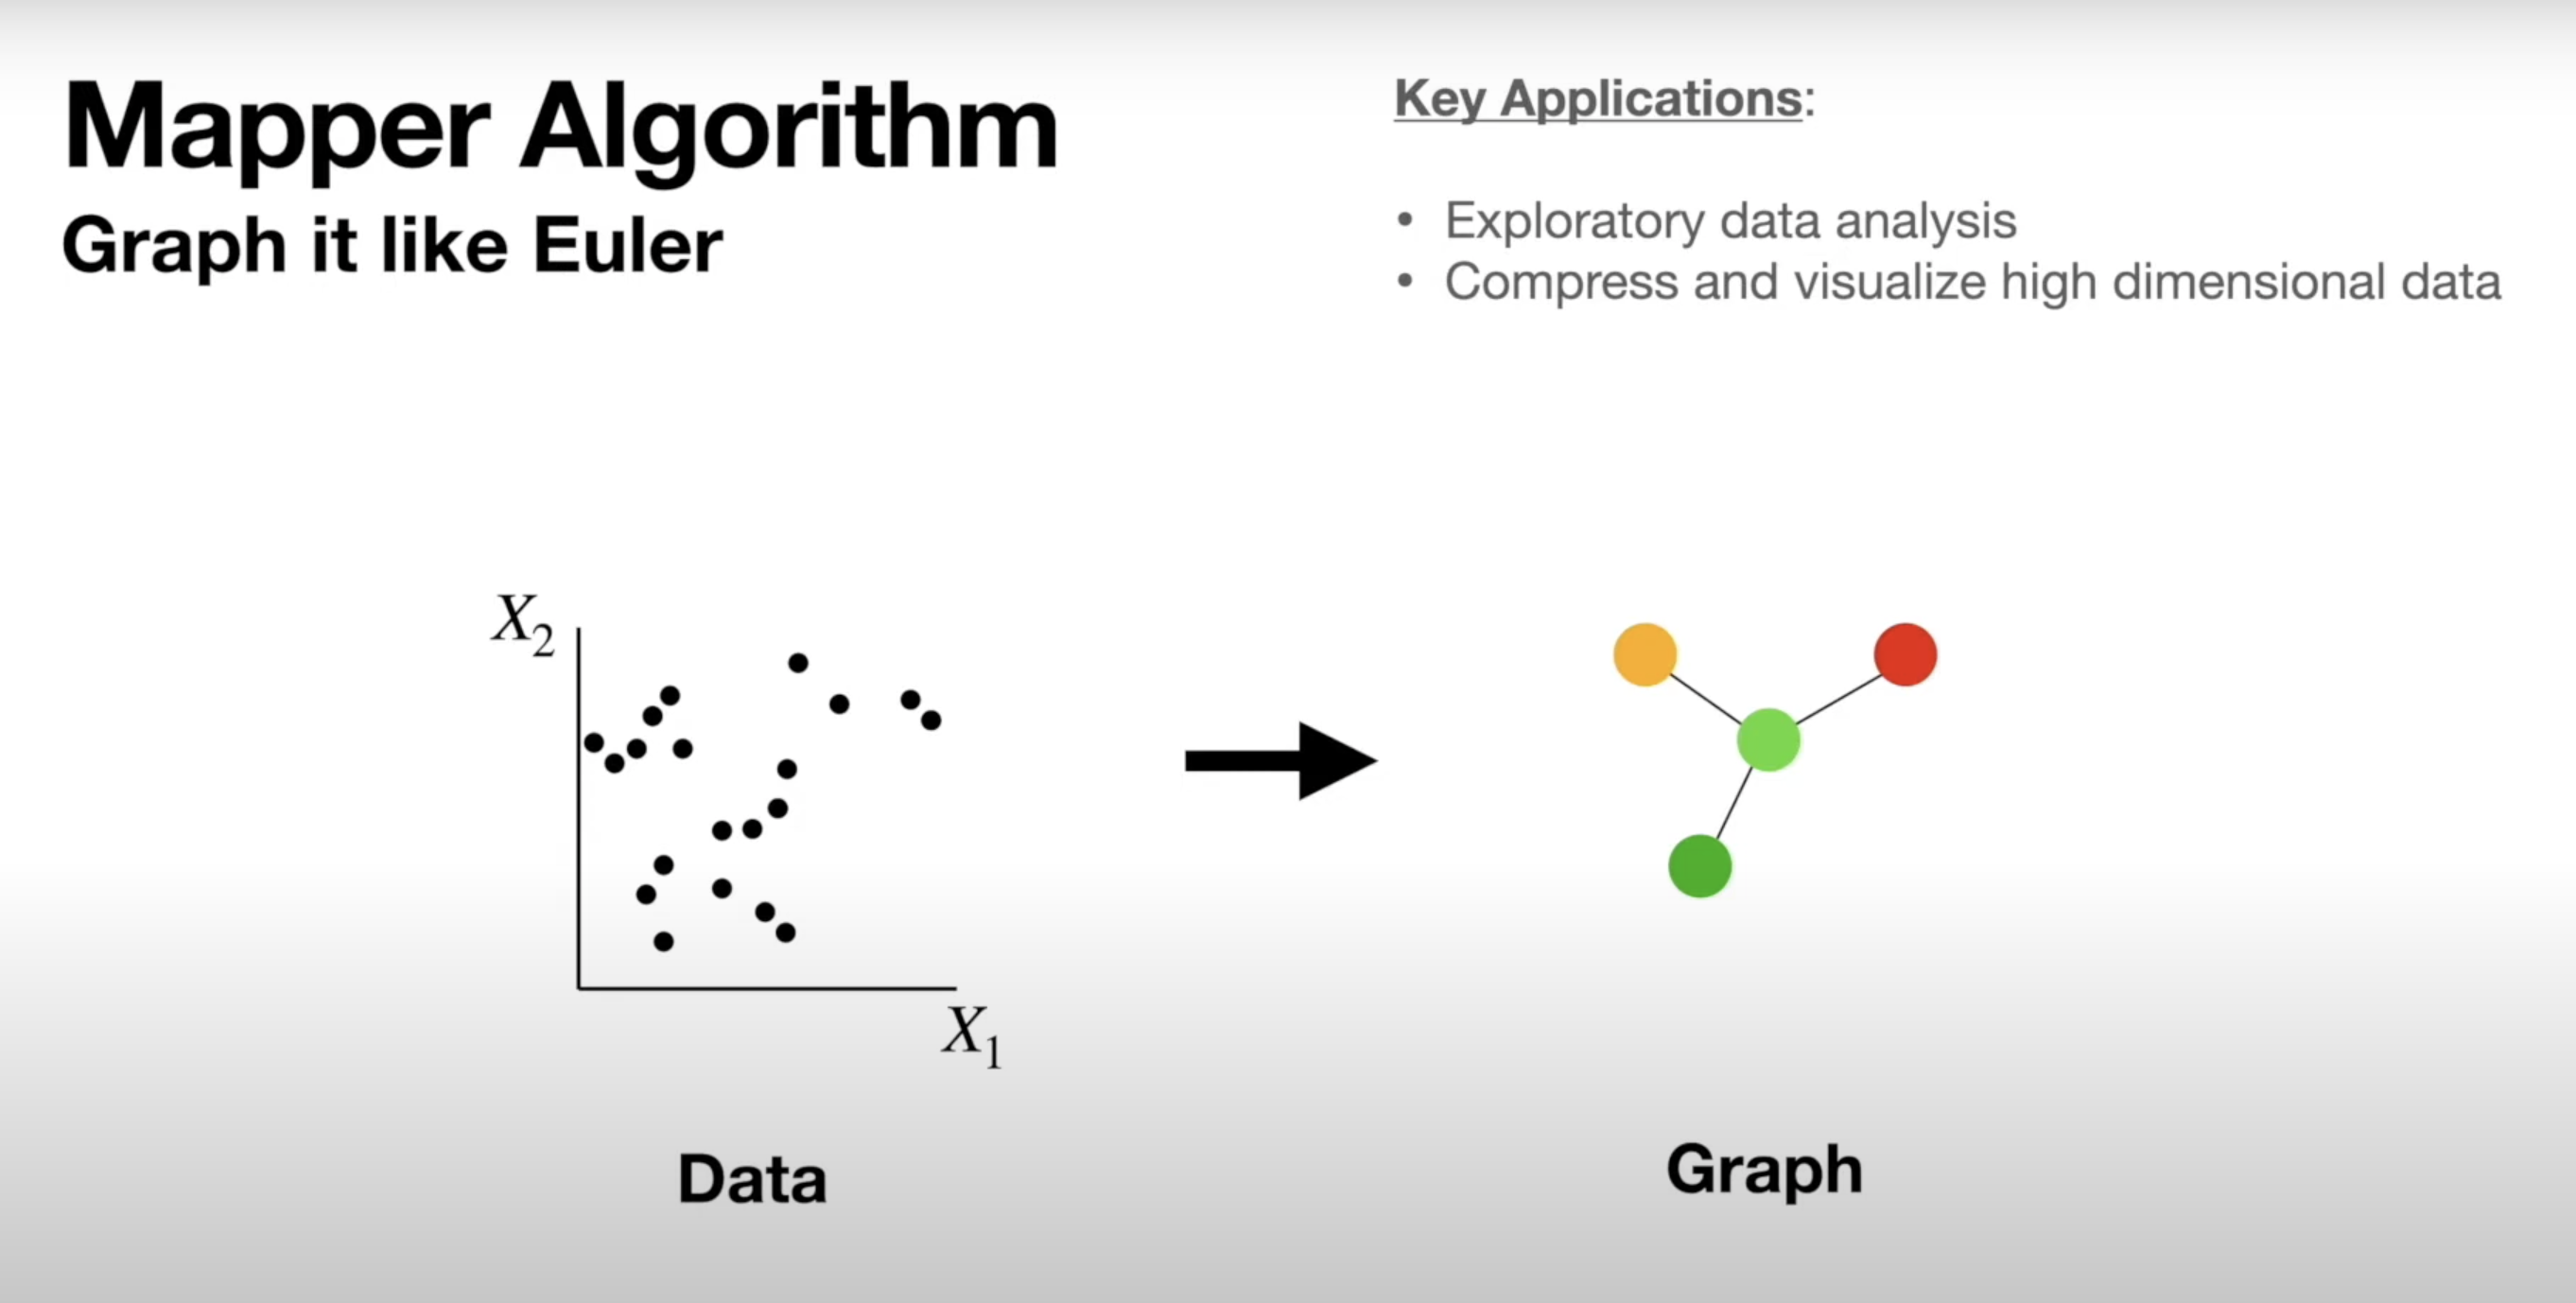
Mapper Algorithm
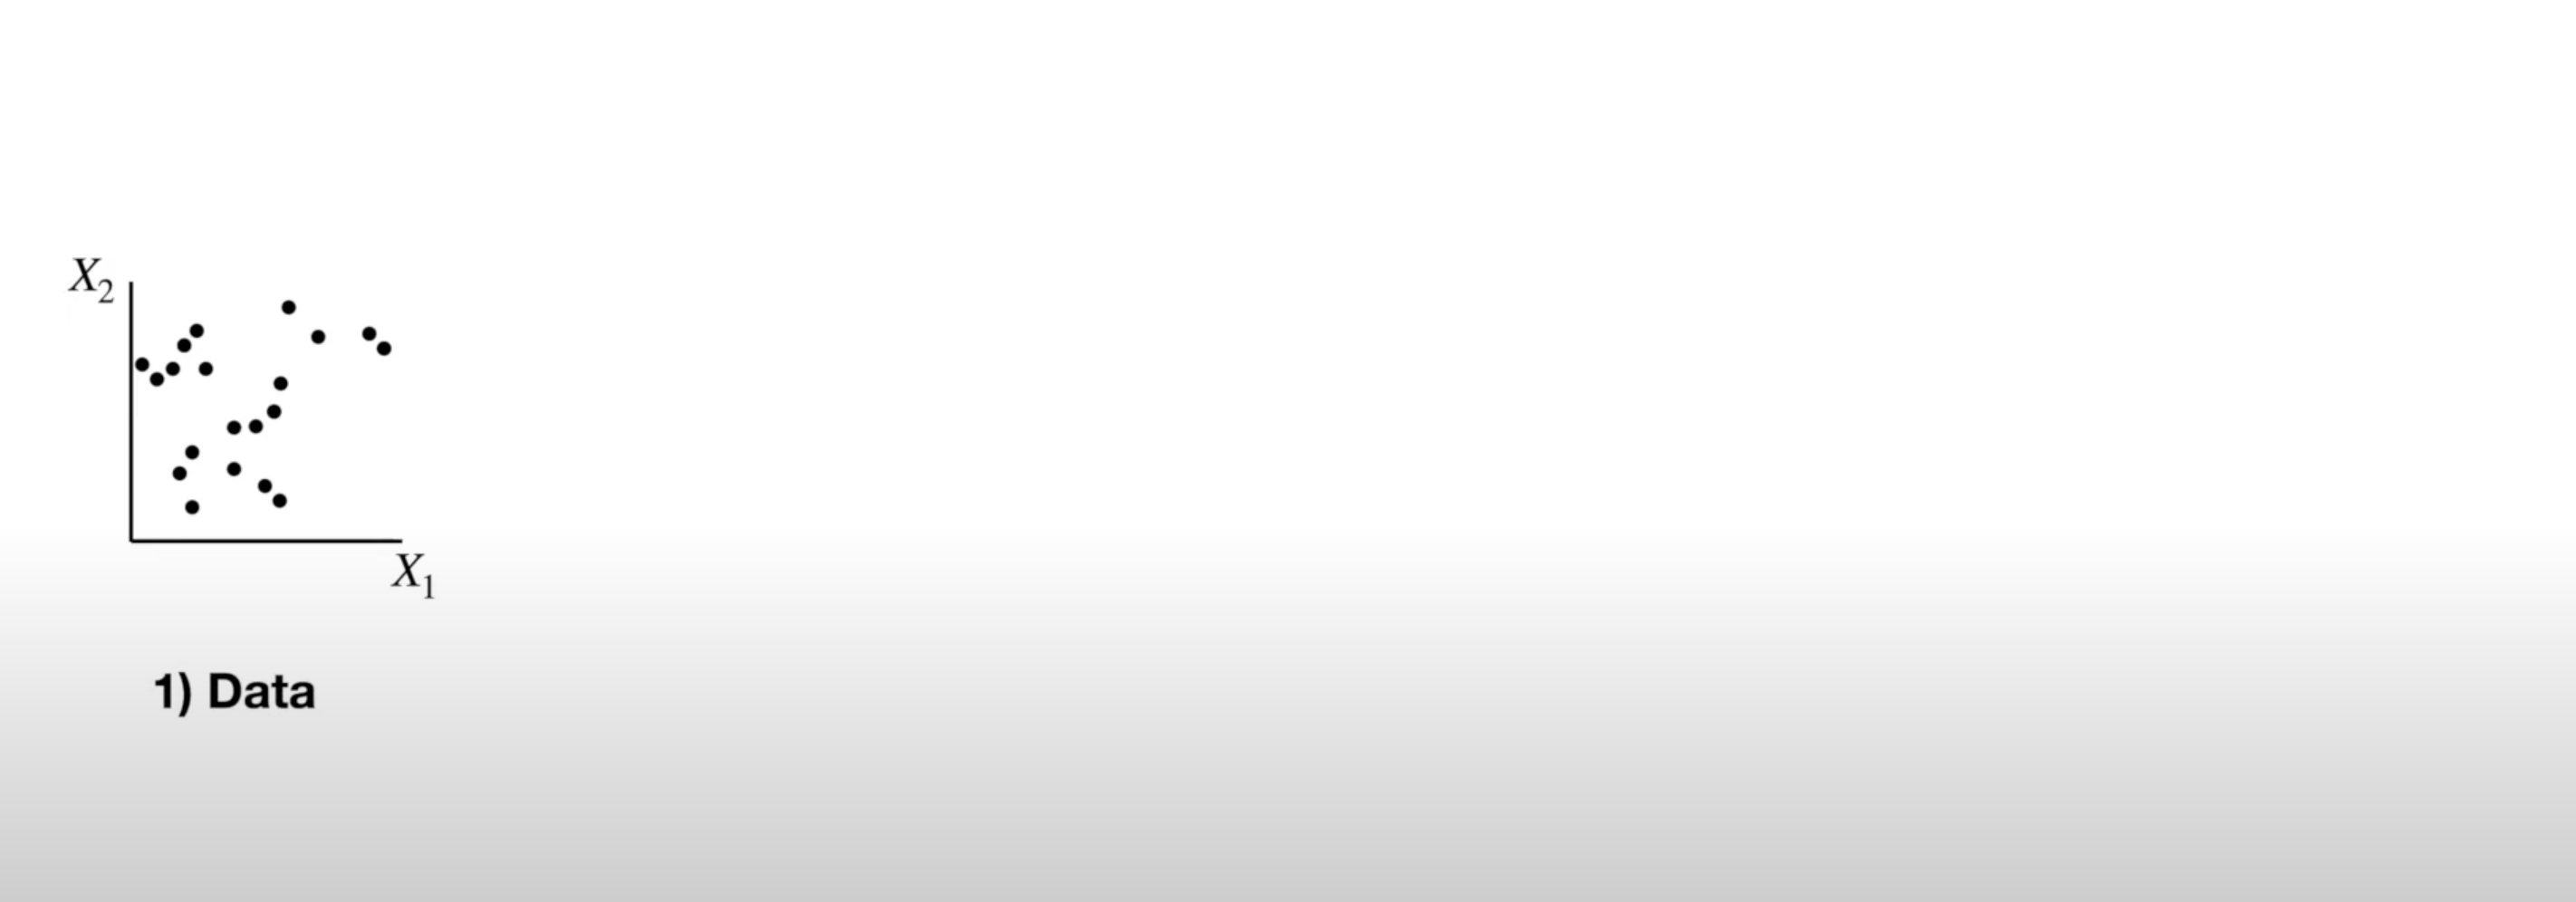
Mapper Algorithm
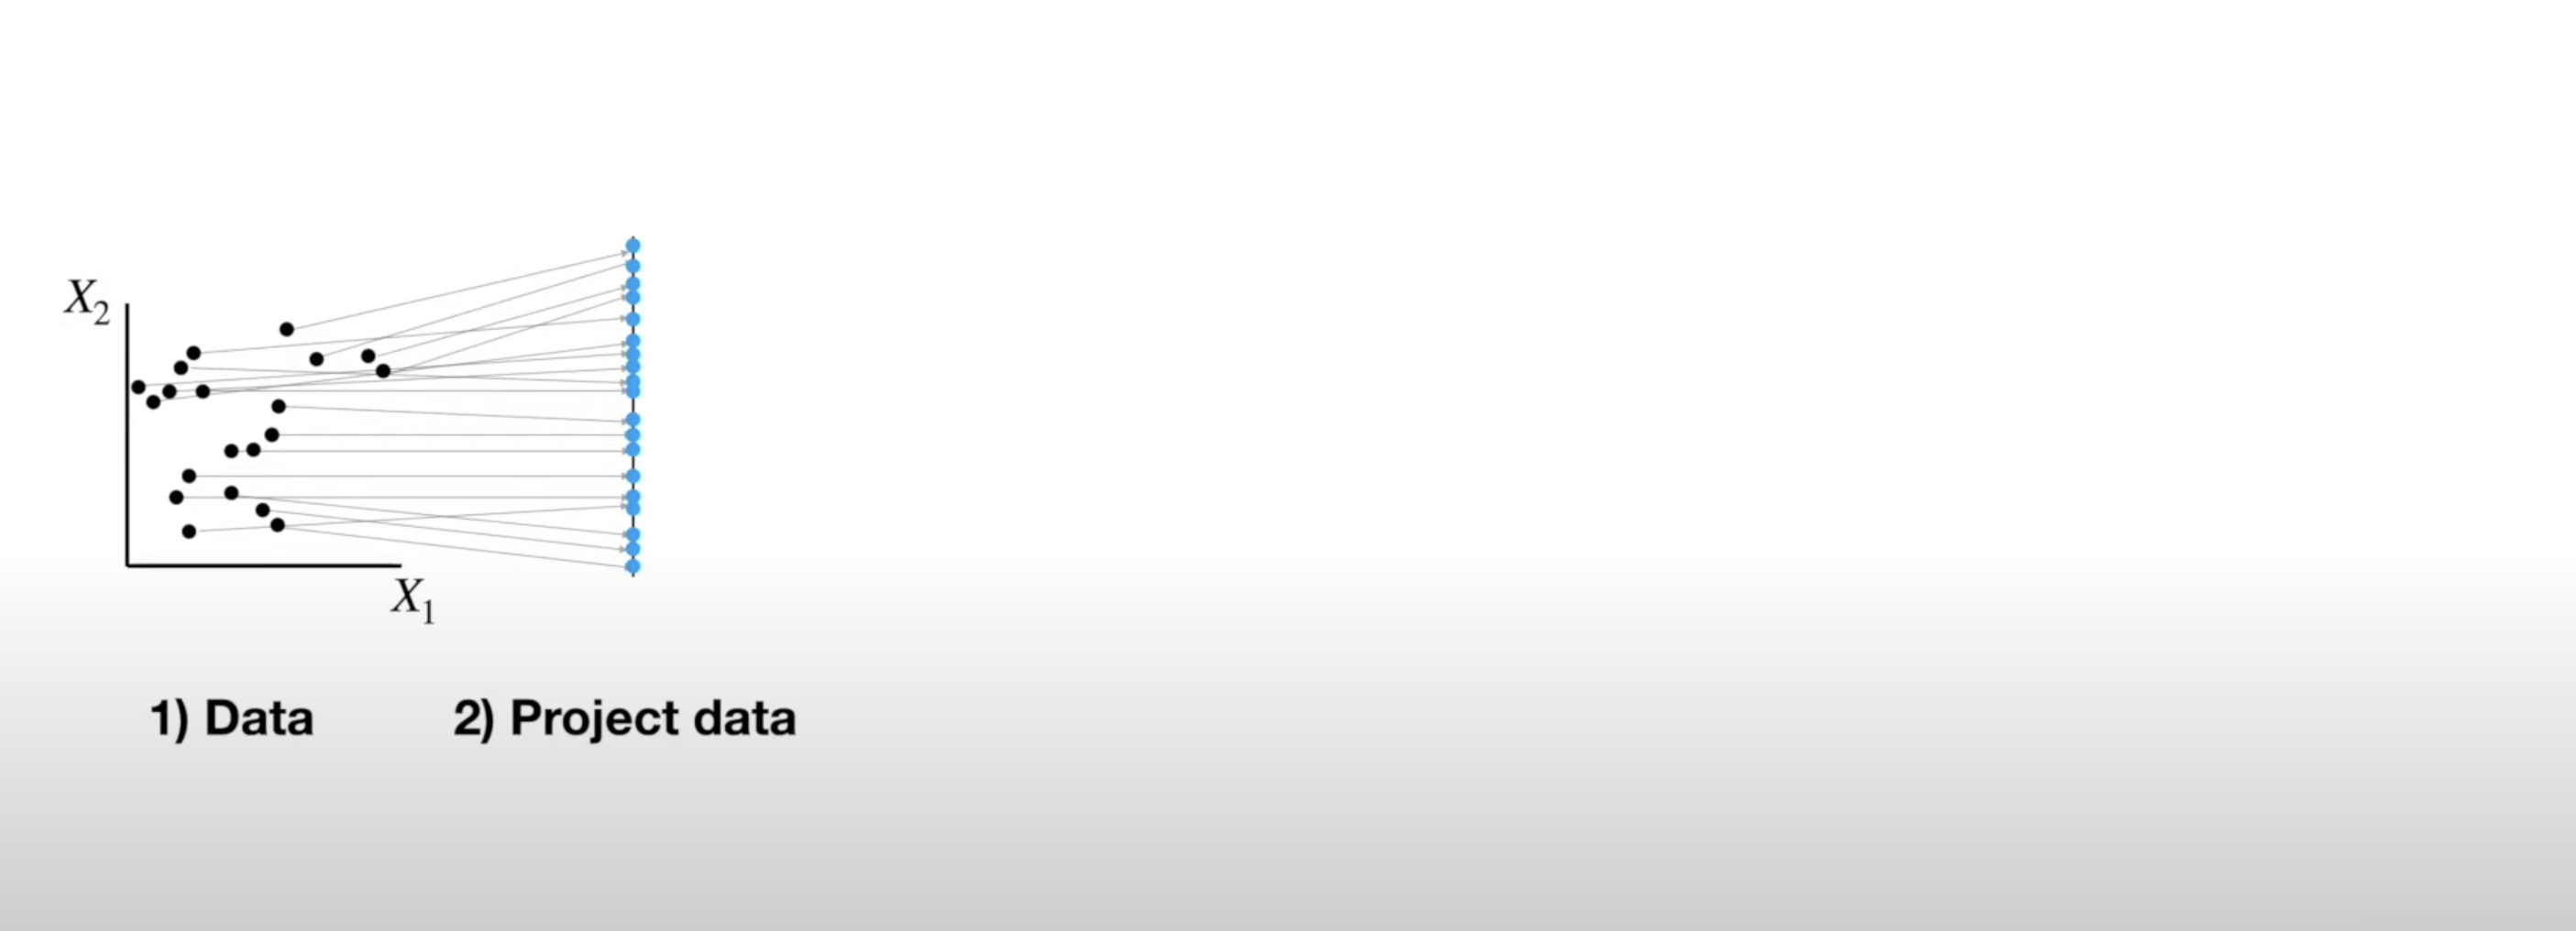
Mapper Algorithm
Mapper Algorithm
Mapper Algorithm
Mapper Algorithm
Persistent Homology
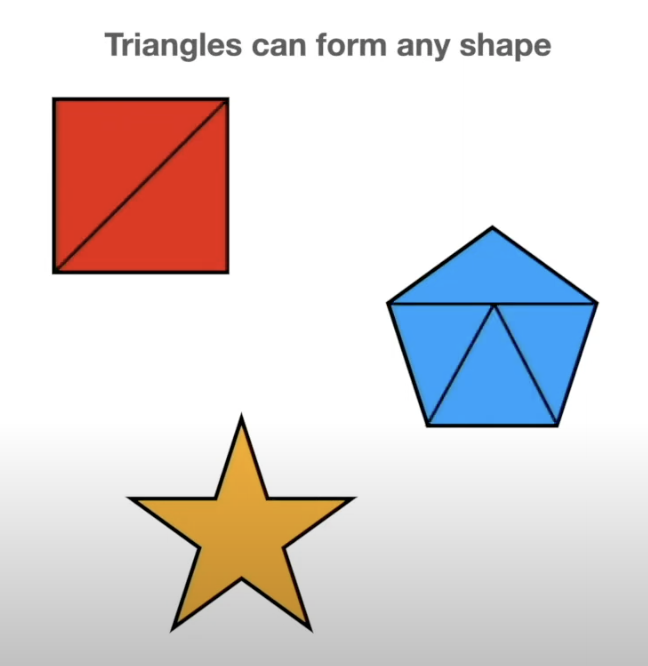
- TDA is about looking at the shape of data
- All polygons can be broken down into the simplest shape - a triangle
- If we want to analyze the shape of our data, we can break it down into triangles - this is the idea behind persistent homology
![]()
Persistent Homology
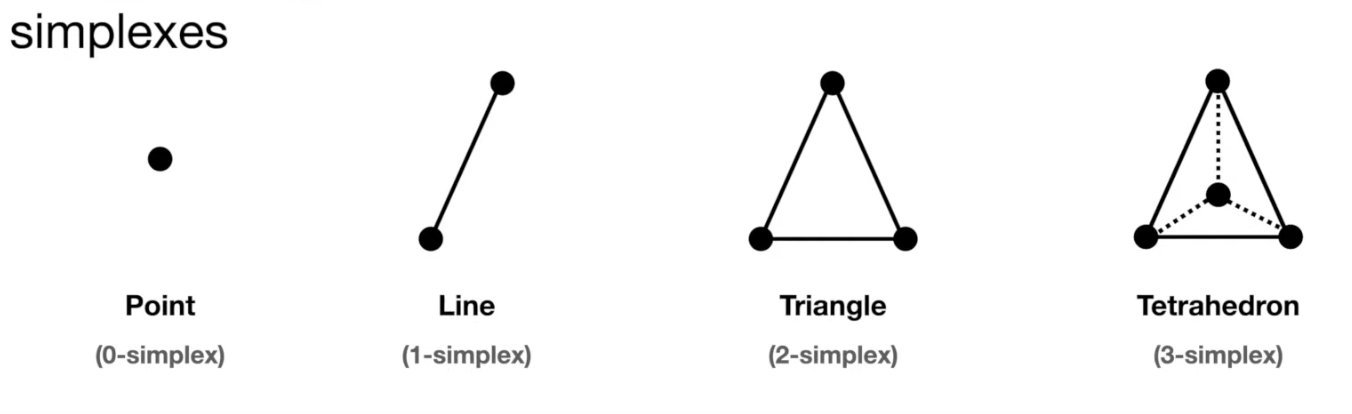
- But most datasets have more than two dimensions, so 2D triangles would not capture them
- Instead we use simplexes - triangles generalized to any number of dimensions
![]()
Persistent Homology
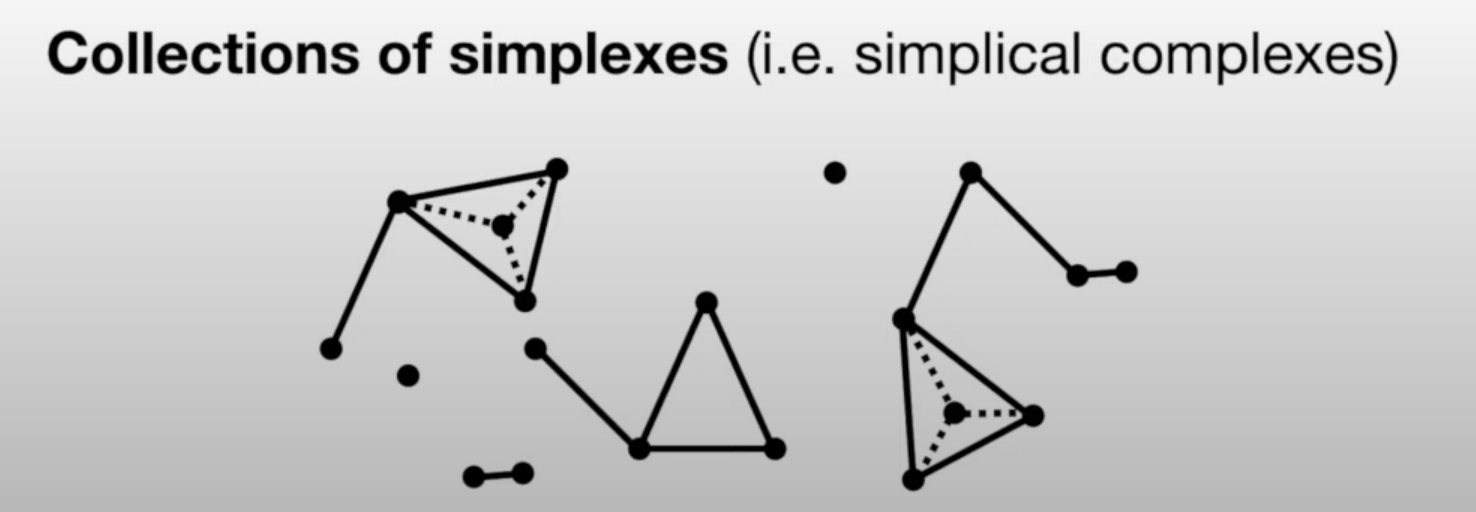
- We can use collections of simplexes (simplicial complexes) to describe our data
![]()
Persistent Homology
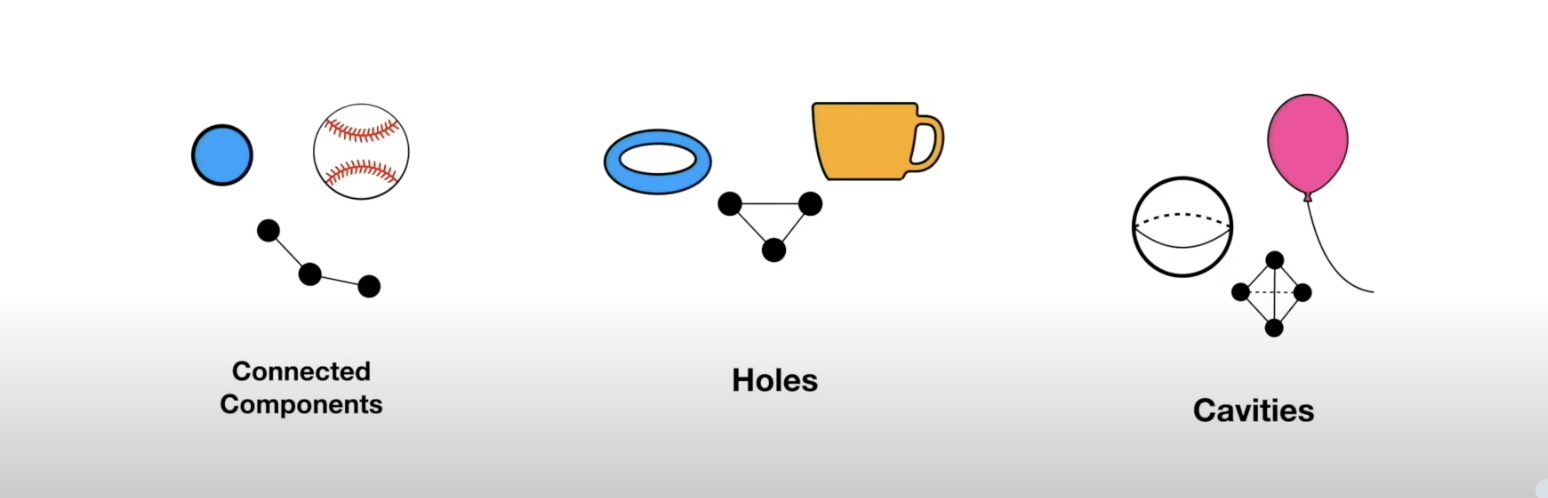
- How do we compare these complex shapes?
- These shapes can be characterized by their holes - we can compare them by counting their holes
![]()

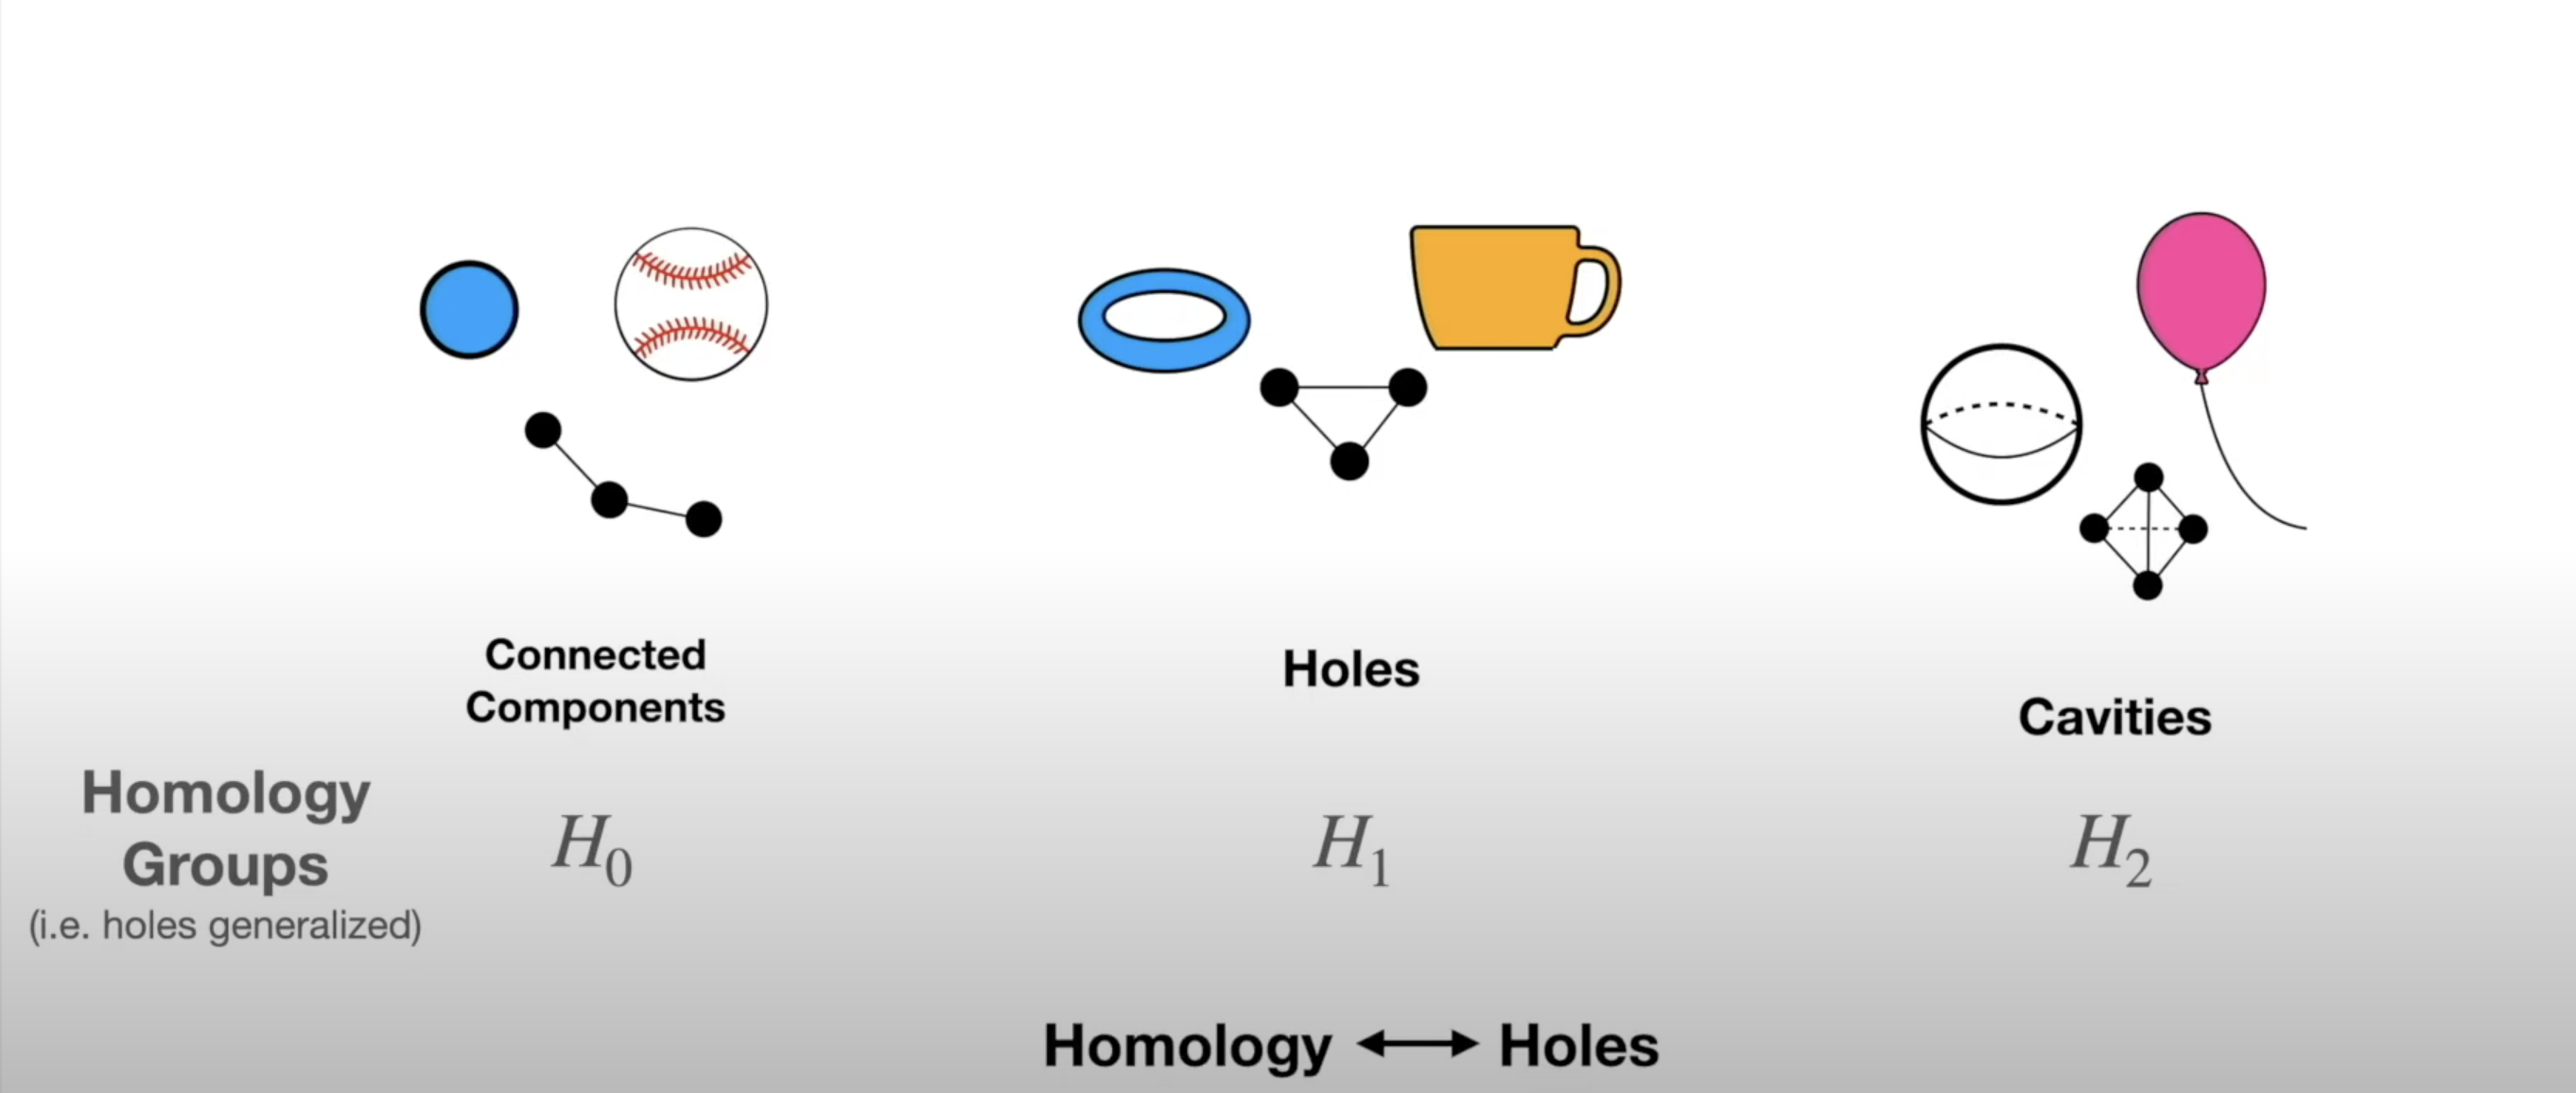
Persistent Homology
- The concept of “hole” can also be generalized to any dimension:
![]()
Persistent Homology
- The concept of “hole” can also be generalized to any dimension (in 1 dimension we count connected components):
![]()
Persistent Homology
- To perform persistent homology, we first draw n-dimensional circles around each point:
![]()
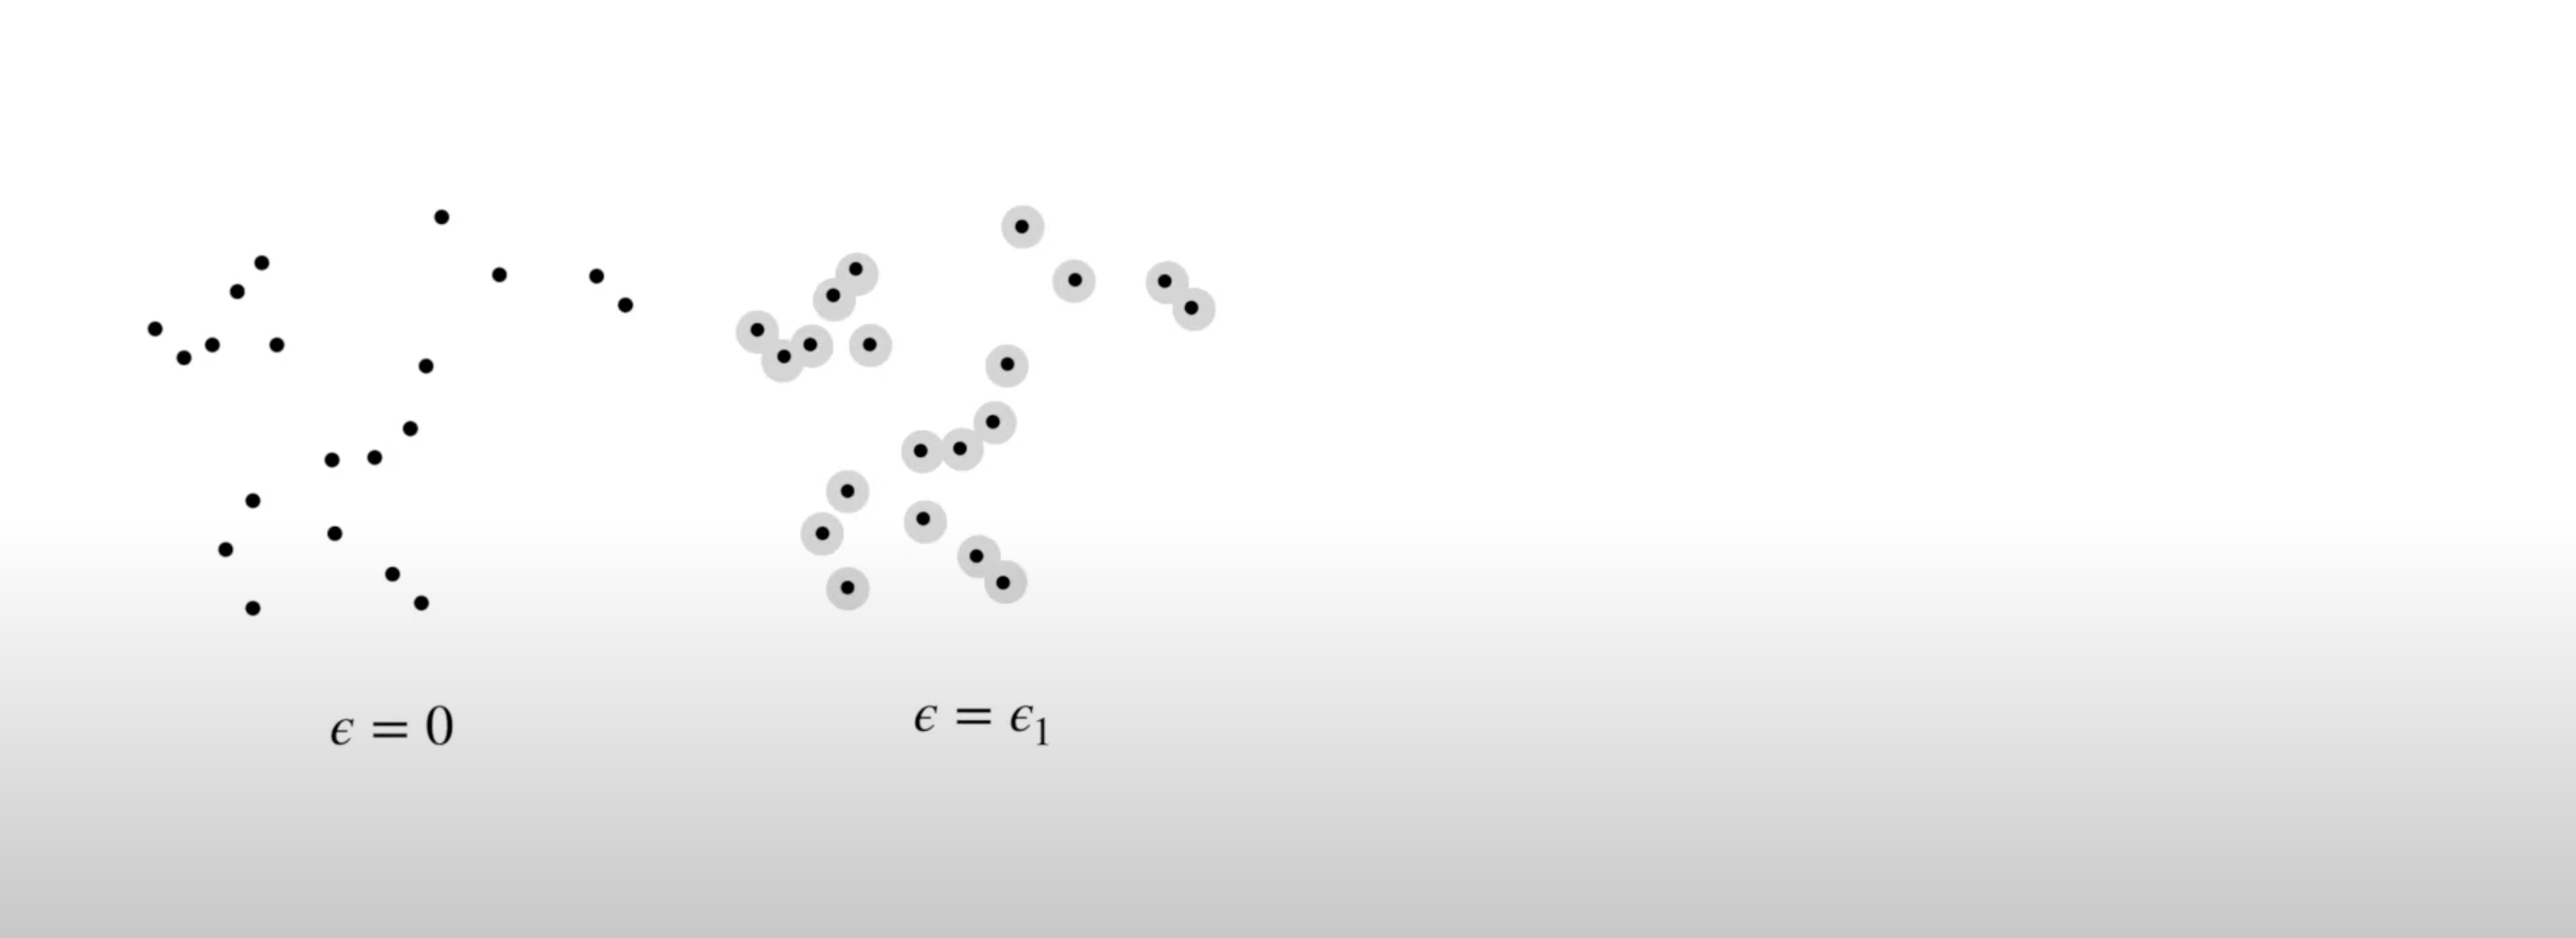
Persistent Homology
- We can then create 1-simplexes by connecting the data points whose circles overlap:
![]()
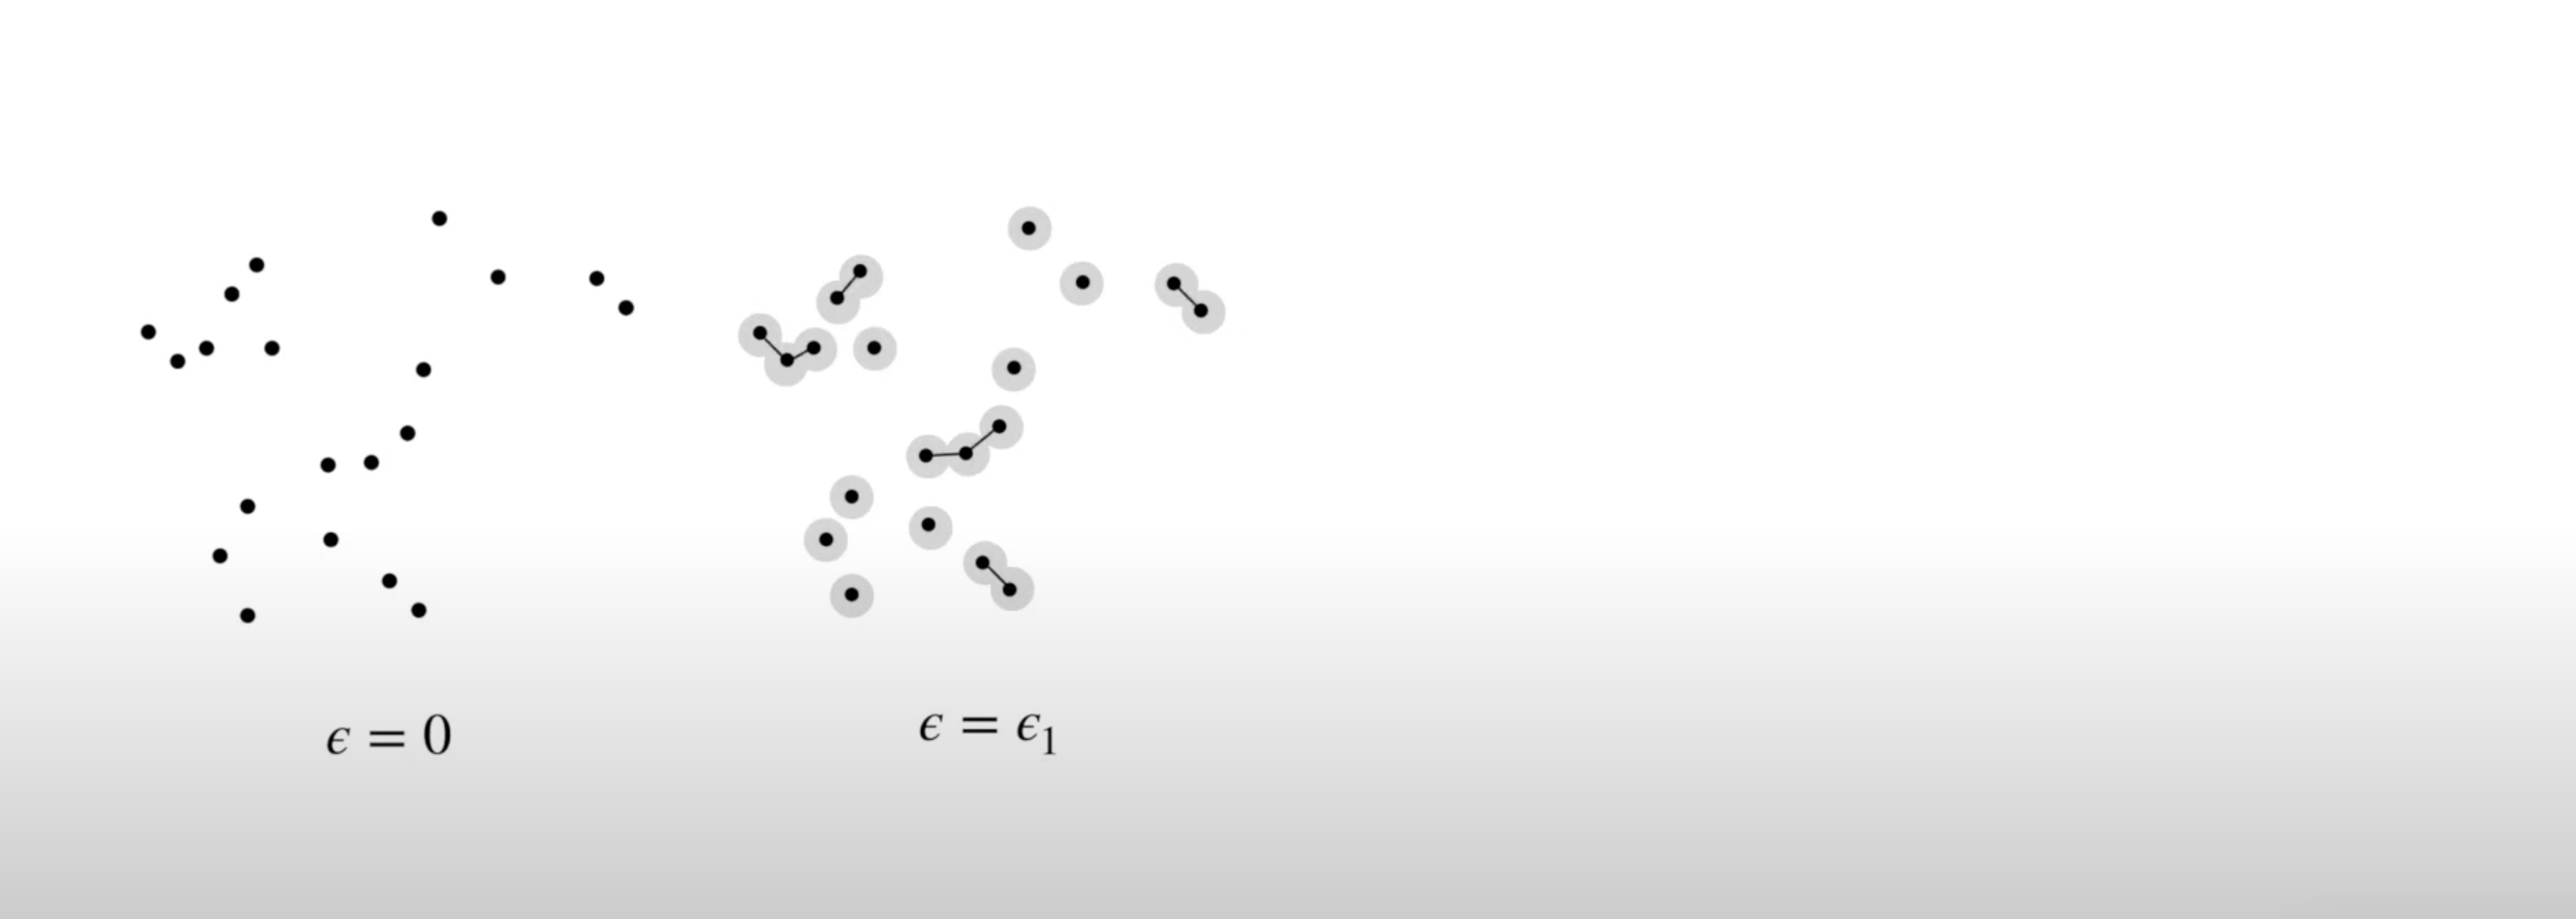
Persistent Homology
- Now we have two shapes: our initial 0-simplex (point cloud) and a shape made of 0- and 1-simplexes
![]()
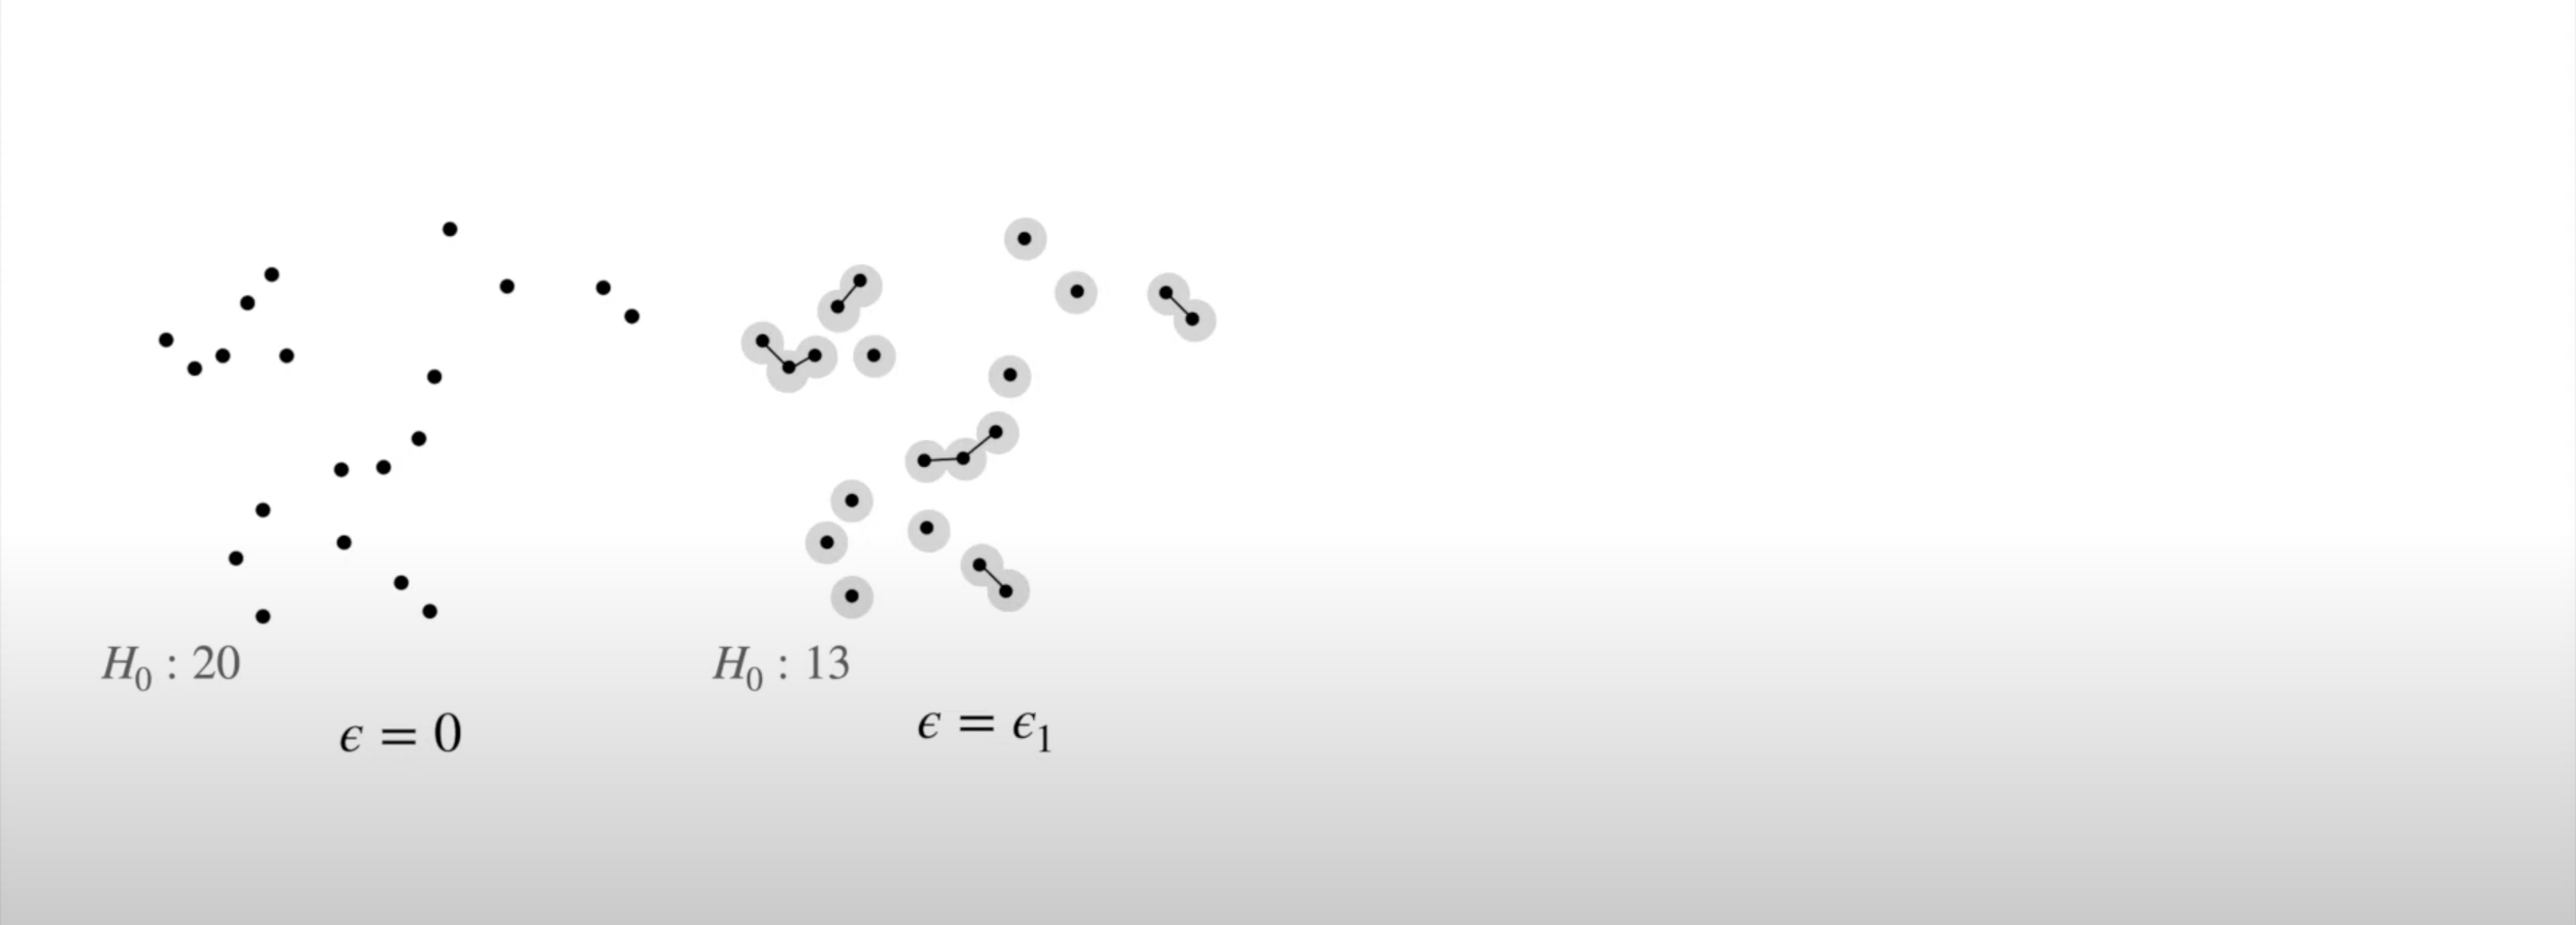
Persistent Homology
- We can compare their homologies by counting the number of connected components:
![]()
Persistent Homology
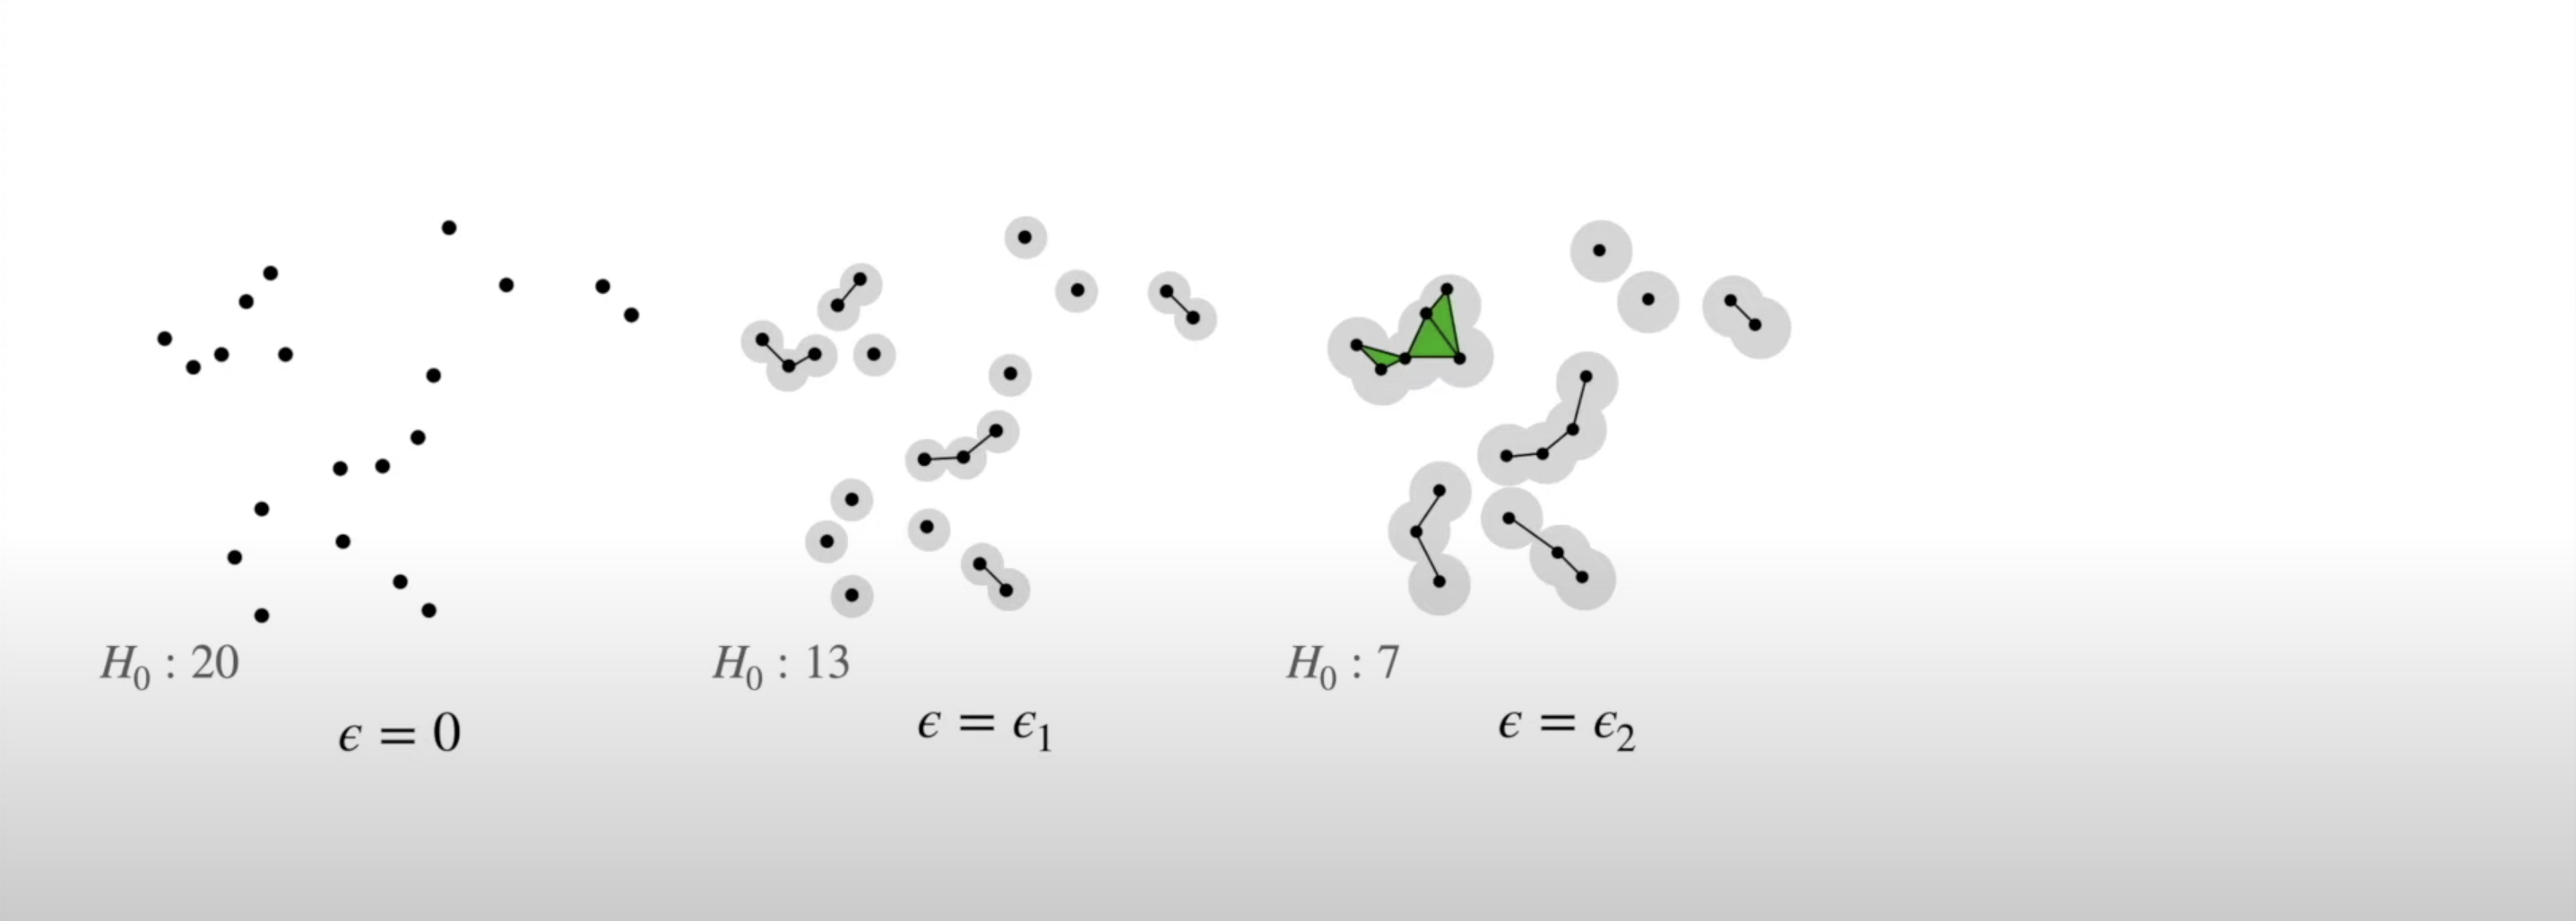
- We repeat this step, increasing the radius of the circles
- We see 2-simplexes start to appear and the number of connected components decreases:
![]()
Persistent Homology
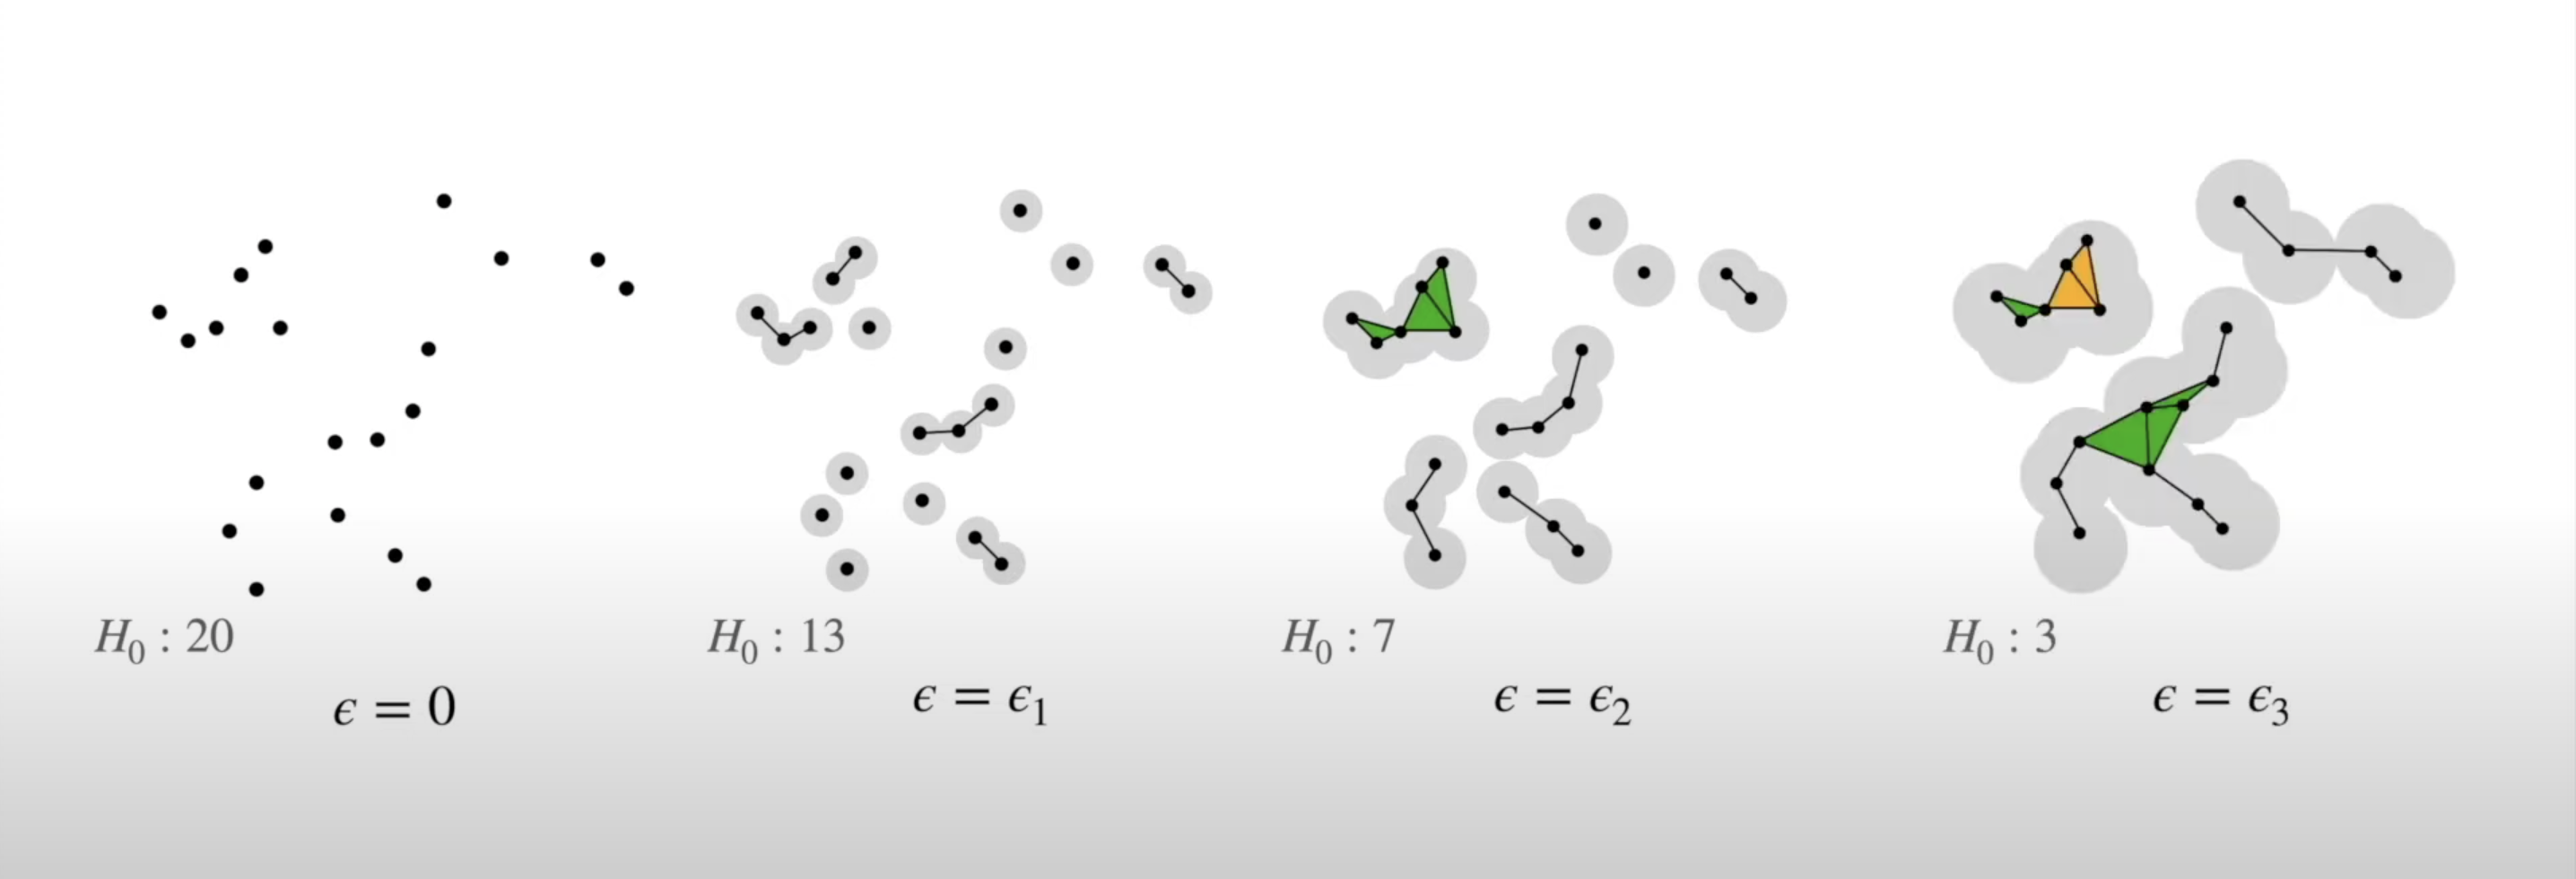
- We can do this for every choice of radius between 0 and the radius which yields only one connected component:
![]()
Persistent Homology
- This allows us to analyze which topological features of our data are significant based on how long they “persist” during the circle-growing process (longer persistence = more significant)
![]()
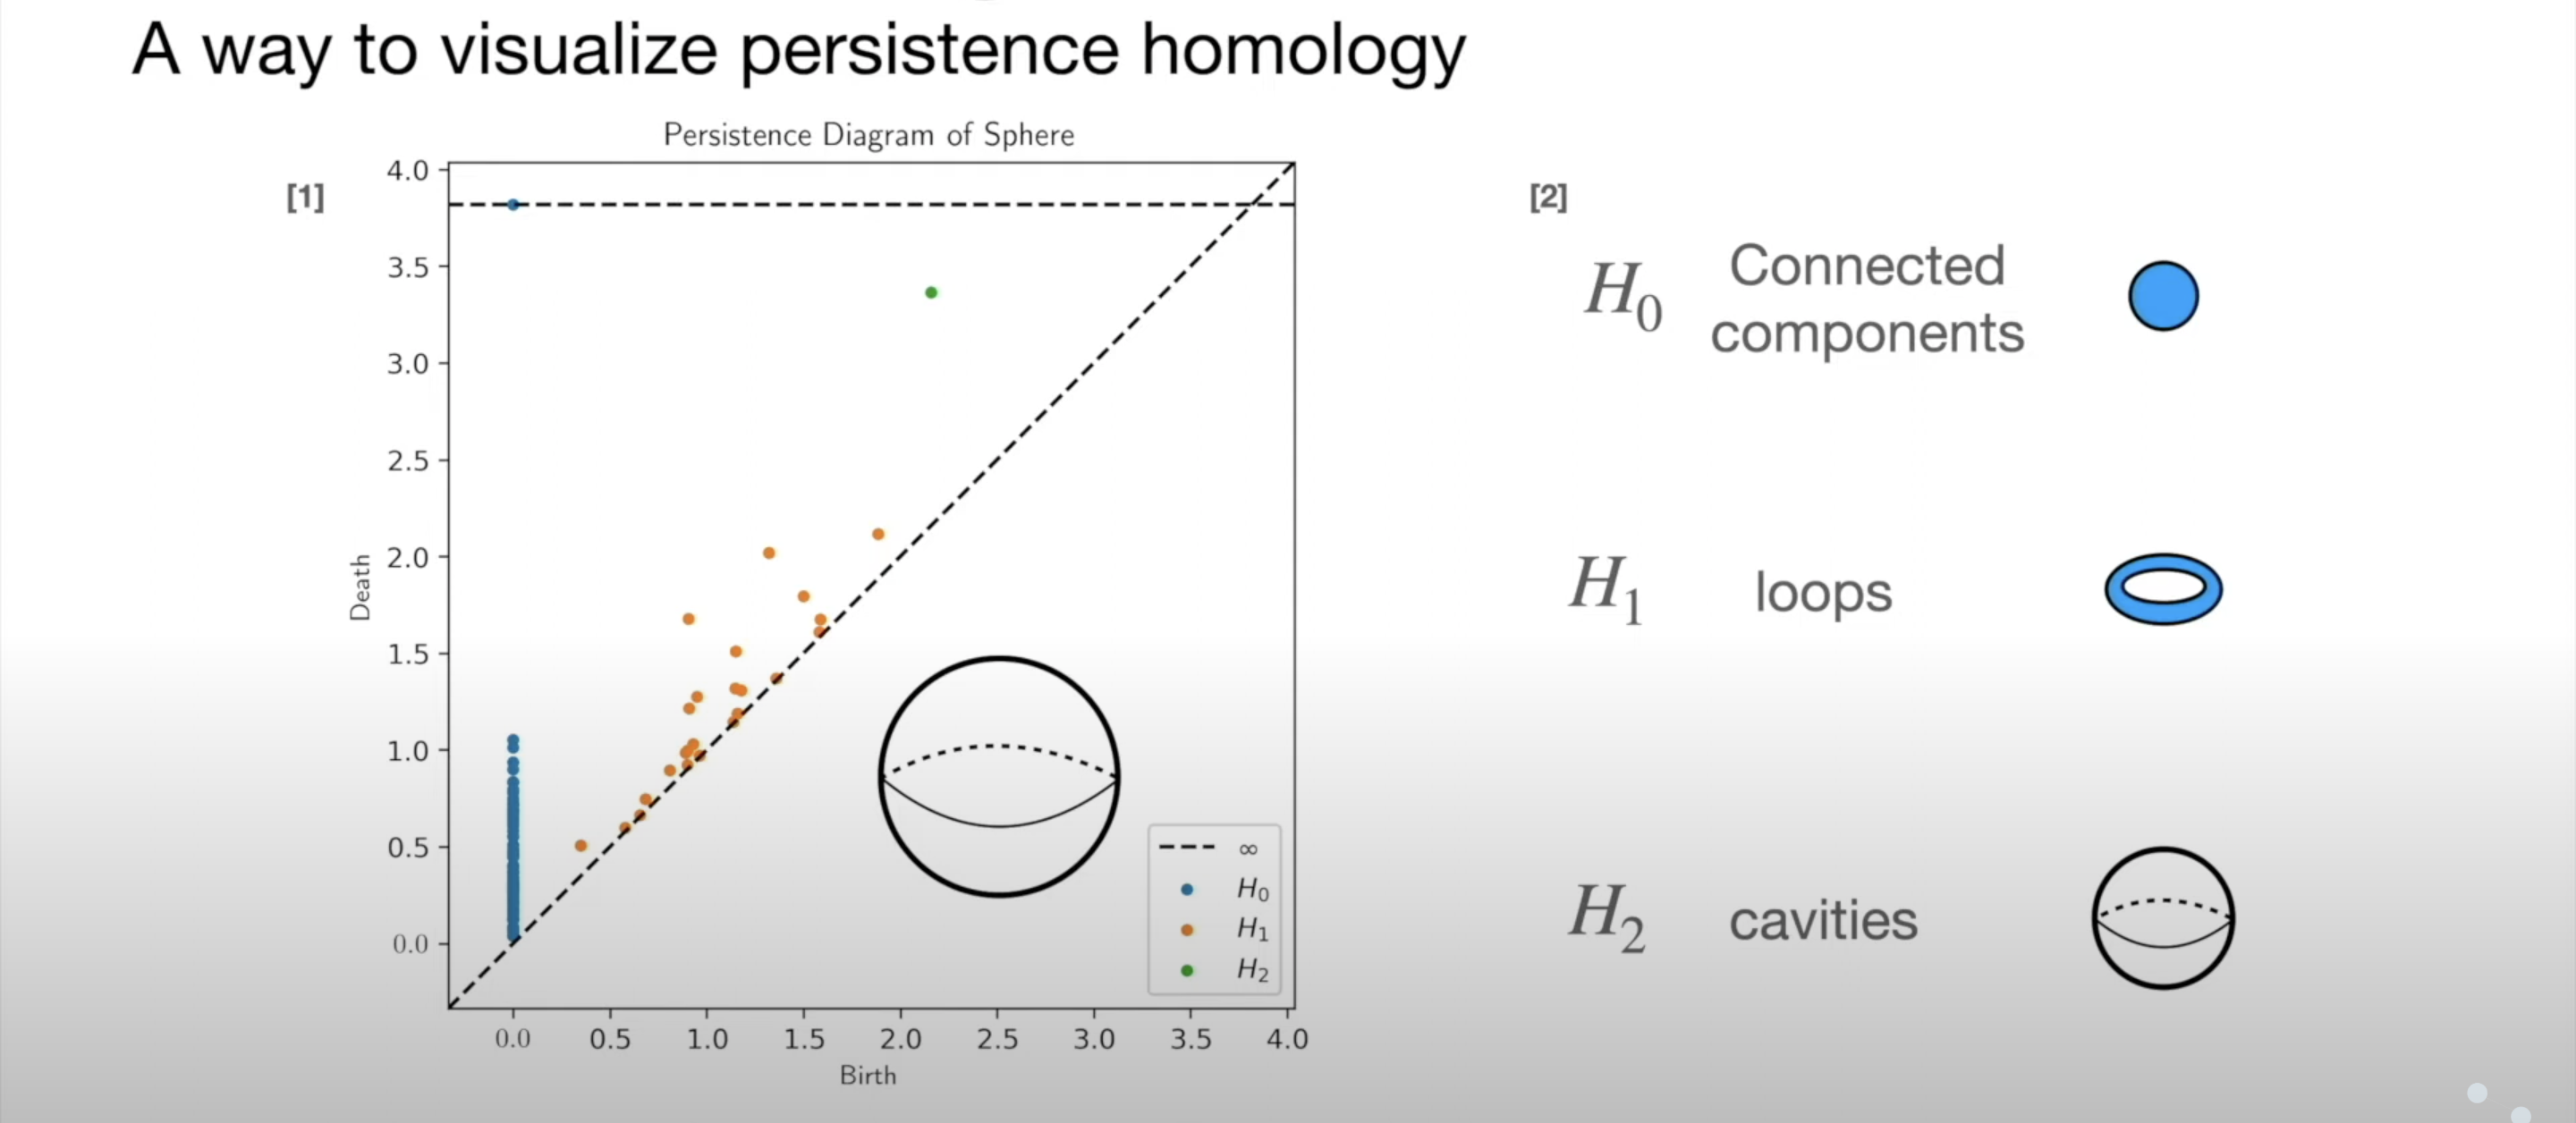
Persistence Diagram
- Points close to y=x are noise, points far from y=x are significant
![]()