Welcome back to the Visualization for Machine Learning Lab!
## Miscellaneous * Homework 4 (on dimensionality reduction) will be released next week. It will NOT be mandatory - complete it by April 19th for extra credit * Homework 3 is being graded * **Project proposal due 4/4** - please submit the names of your project team [here](https://forms.gle/WvUgBjRpNUDGkNdQA) by the end of today! Only one person from each team needs to complete the form. * I will be holding **office hours at 2pm Tuesday and Thursday** next week - reach out if you want to discuss your proposal and neither time works for you ## Topological Data Analysis (TDA) - Data has shape, and that shape matters when we analyze it - A way of extracting meaning from high dimensional data - Slides adapted from Shaw Talebi's [TDA video trilogy](https://www.youtube.com/watch?v=fpL5fMmJHqk&list=PLzERW_Obpmv_UW7RgbZW4Ebhw87BcoXc7&ab_channel=ShawTalebi). ## The Seven Bridges of Königsberg 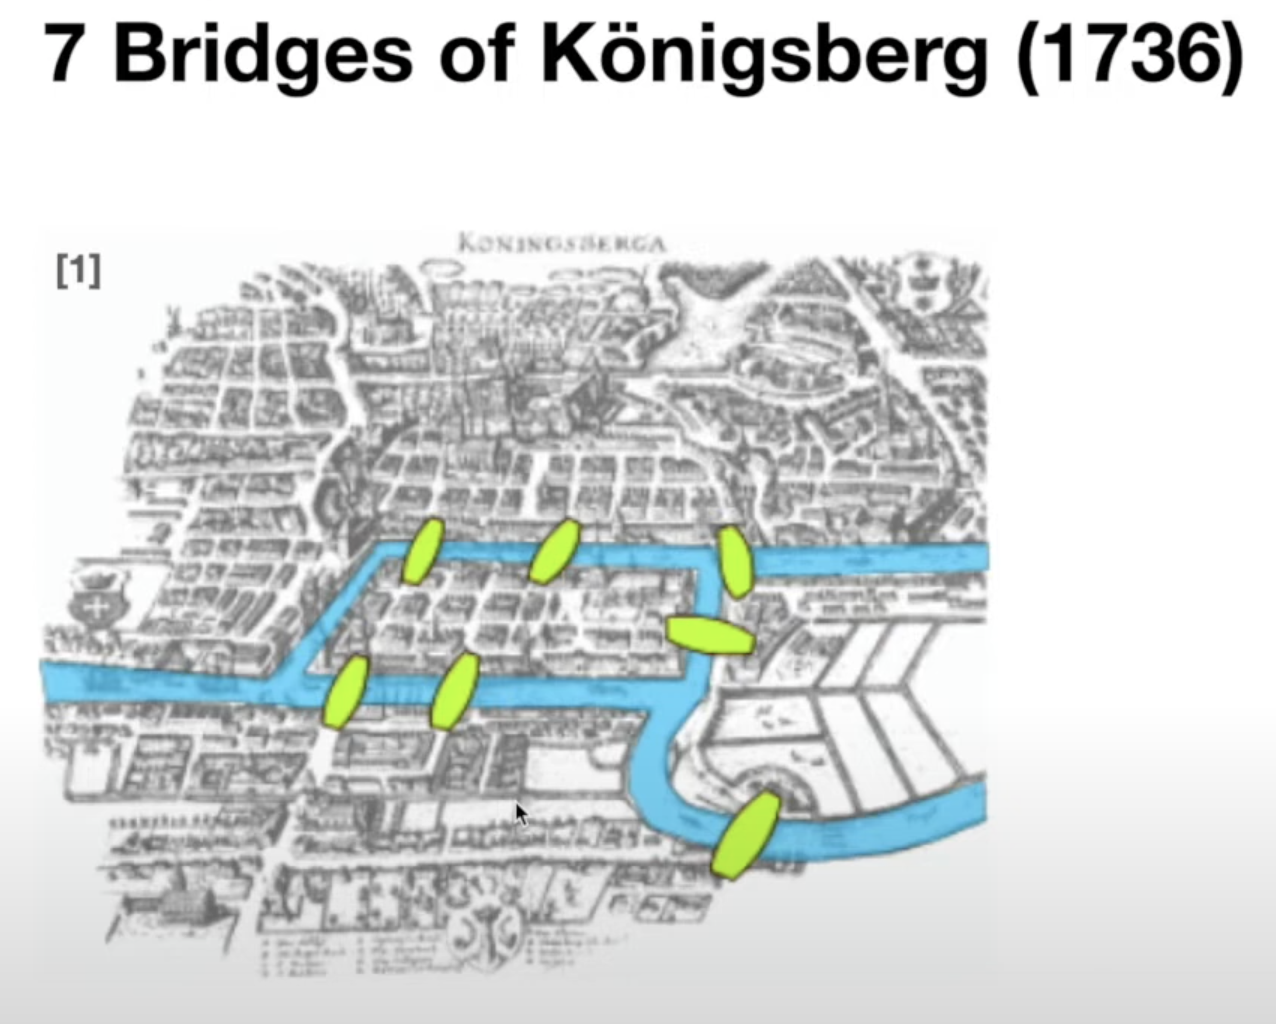 ## The Seven Bridges of Königsberg 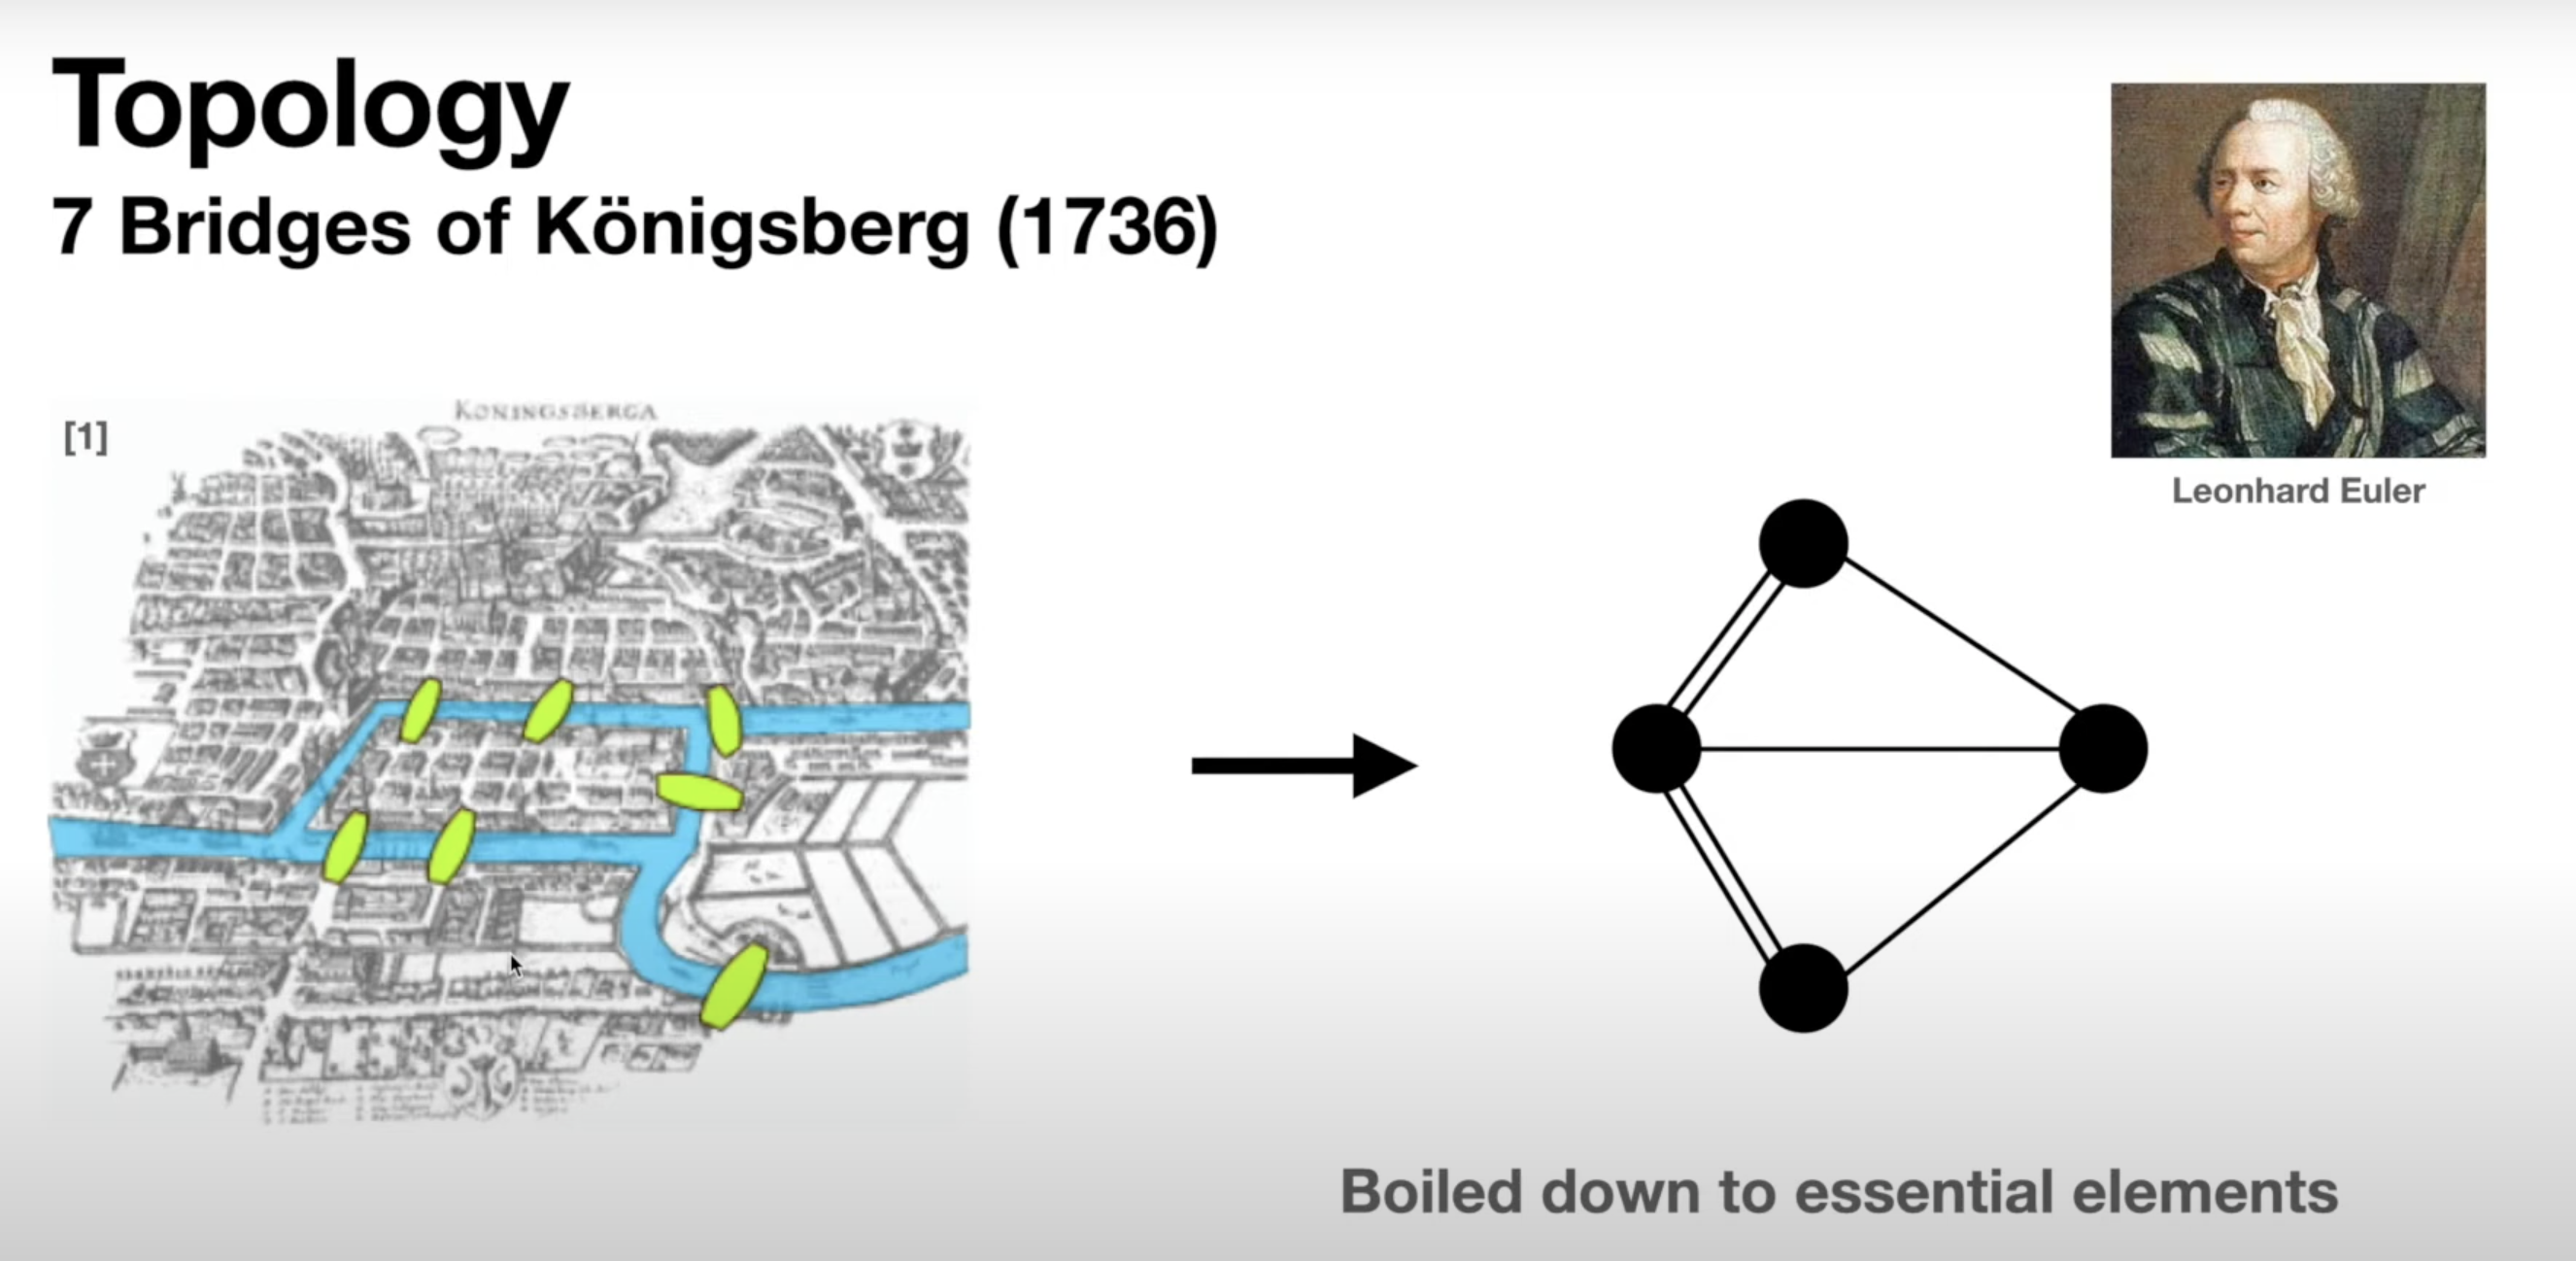 ## General TDA Pipeline 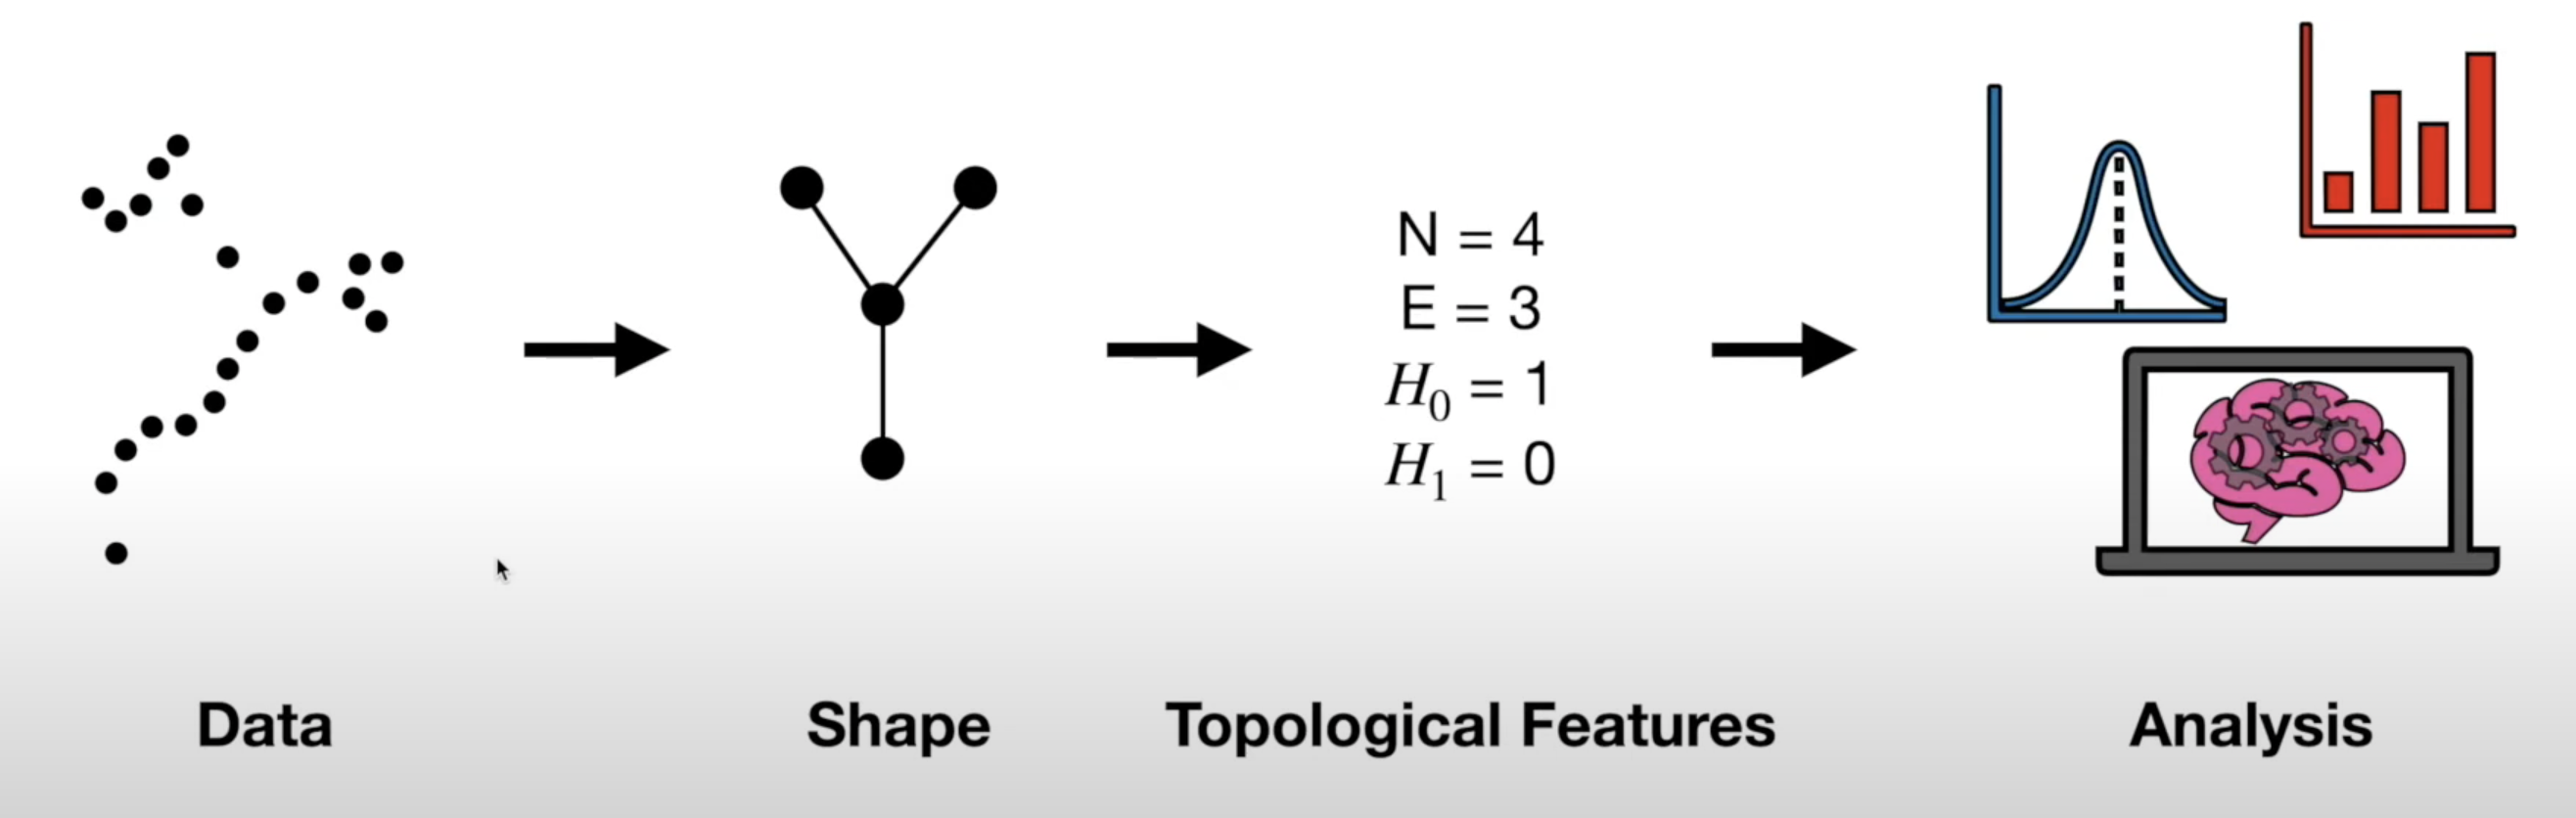 ## Real World Applications of TDA 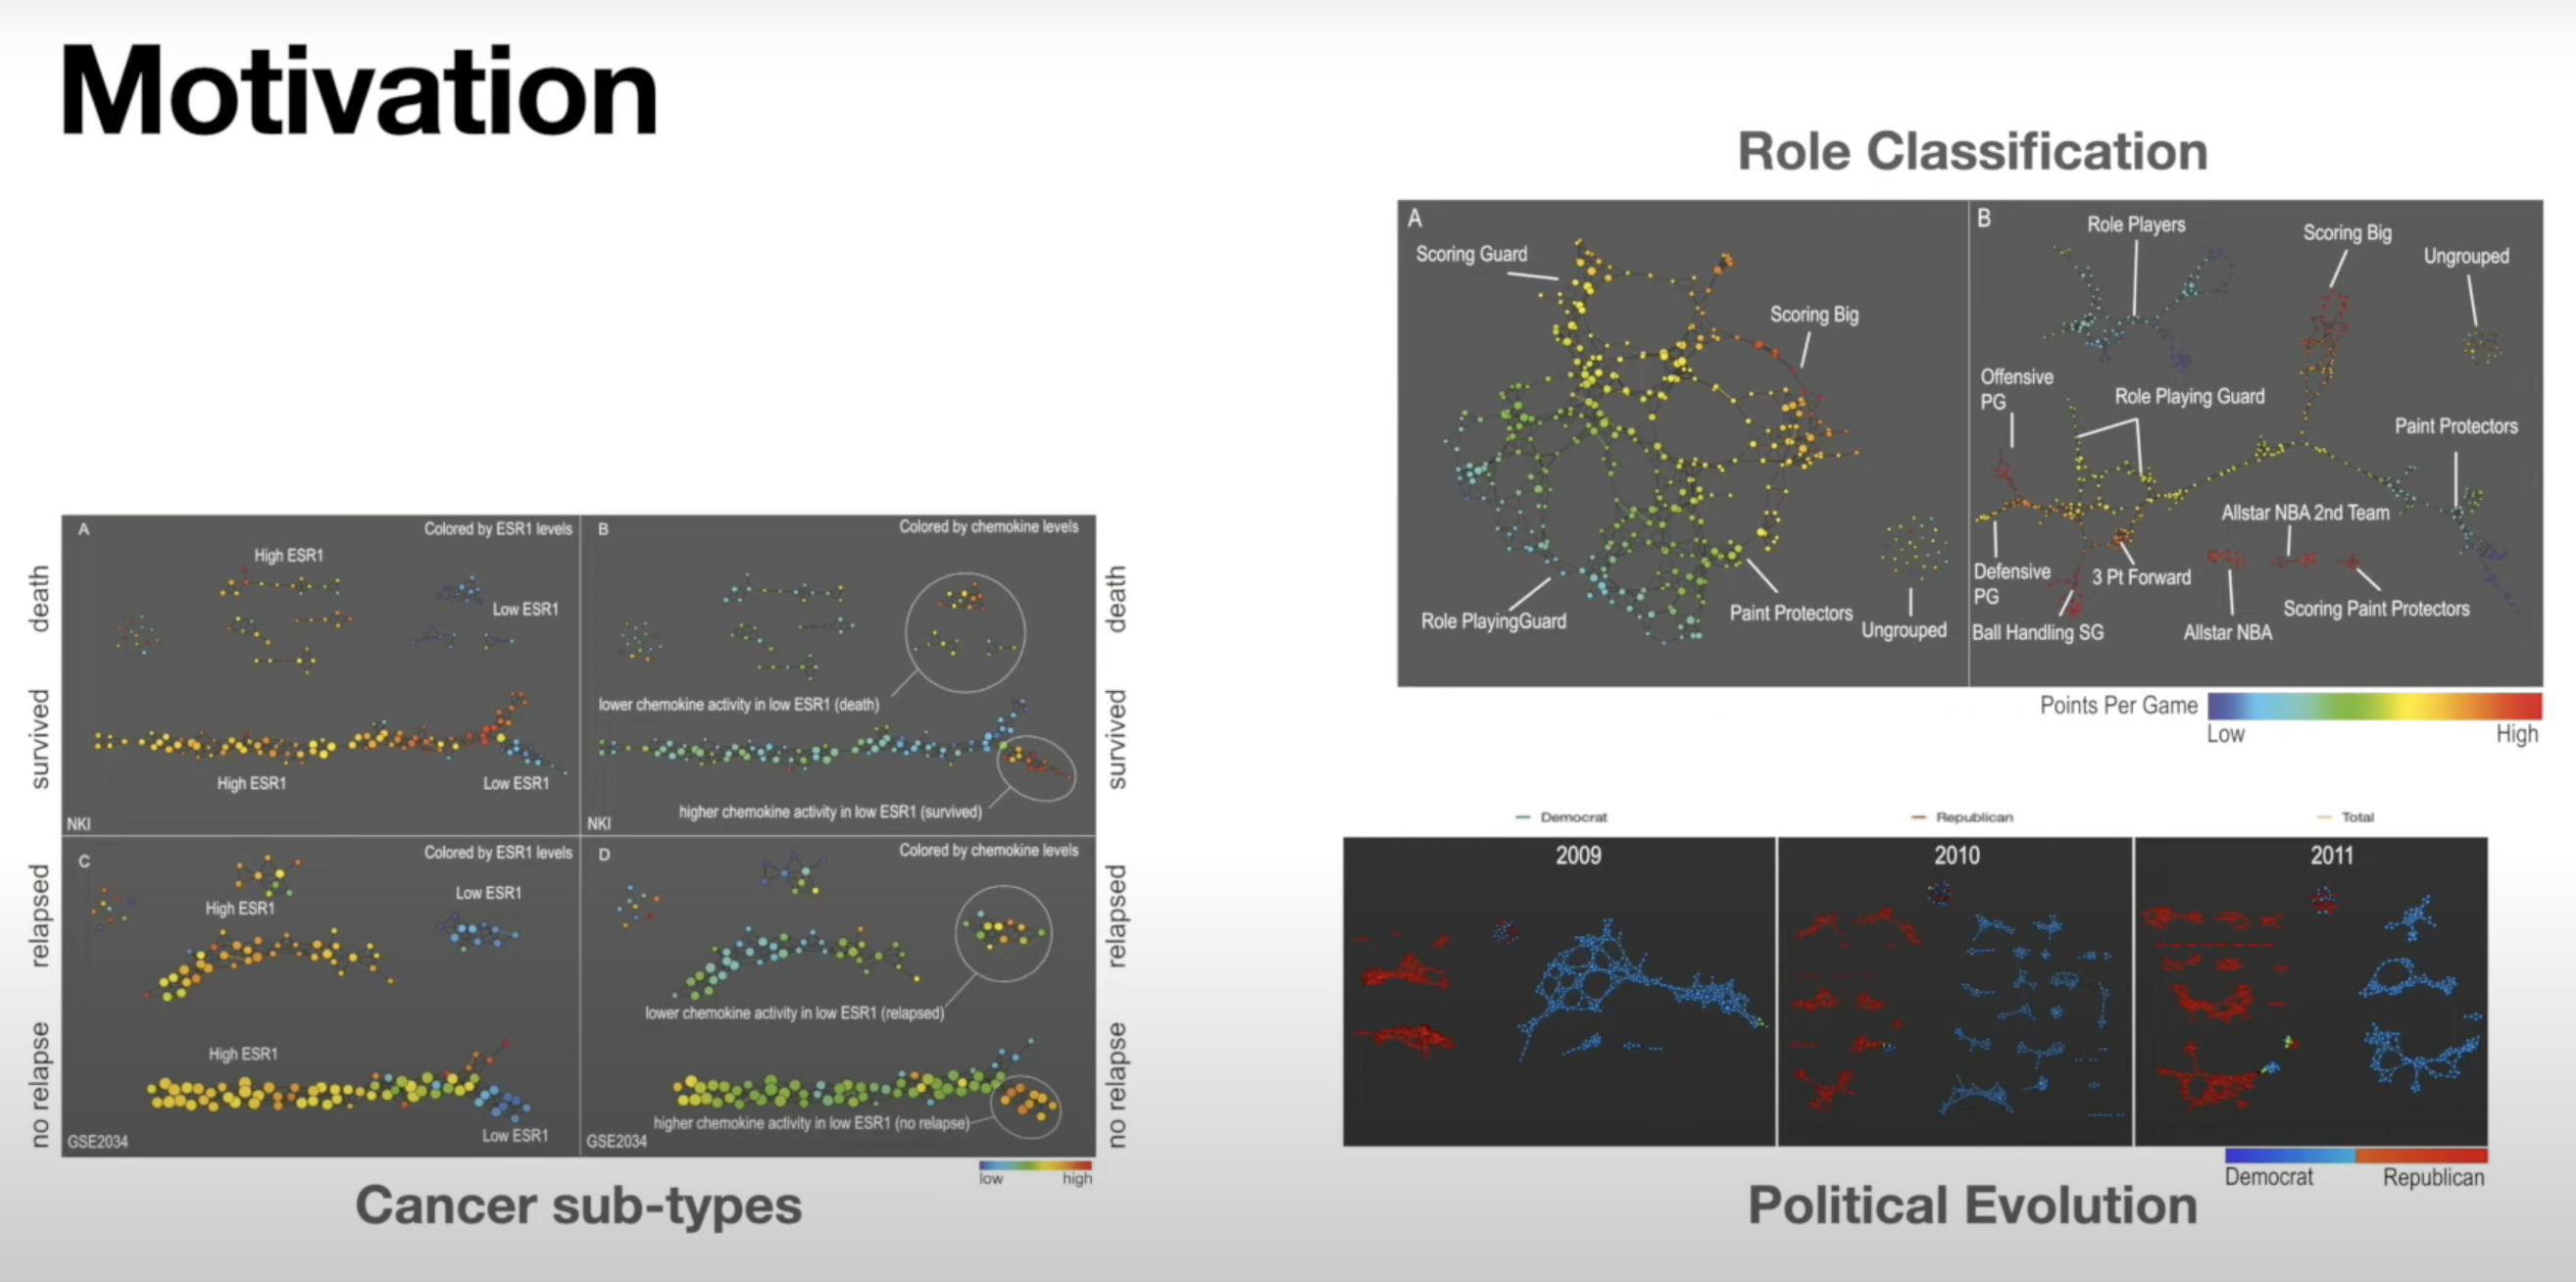 ## Mapper Algorithm 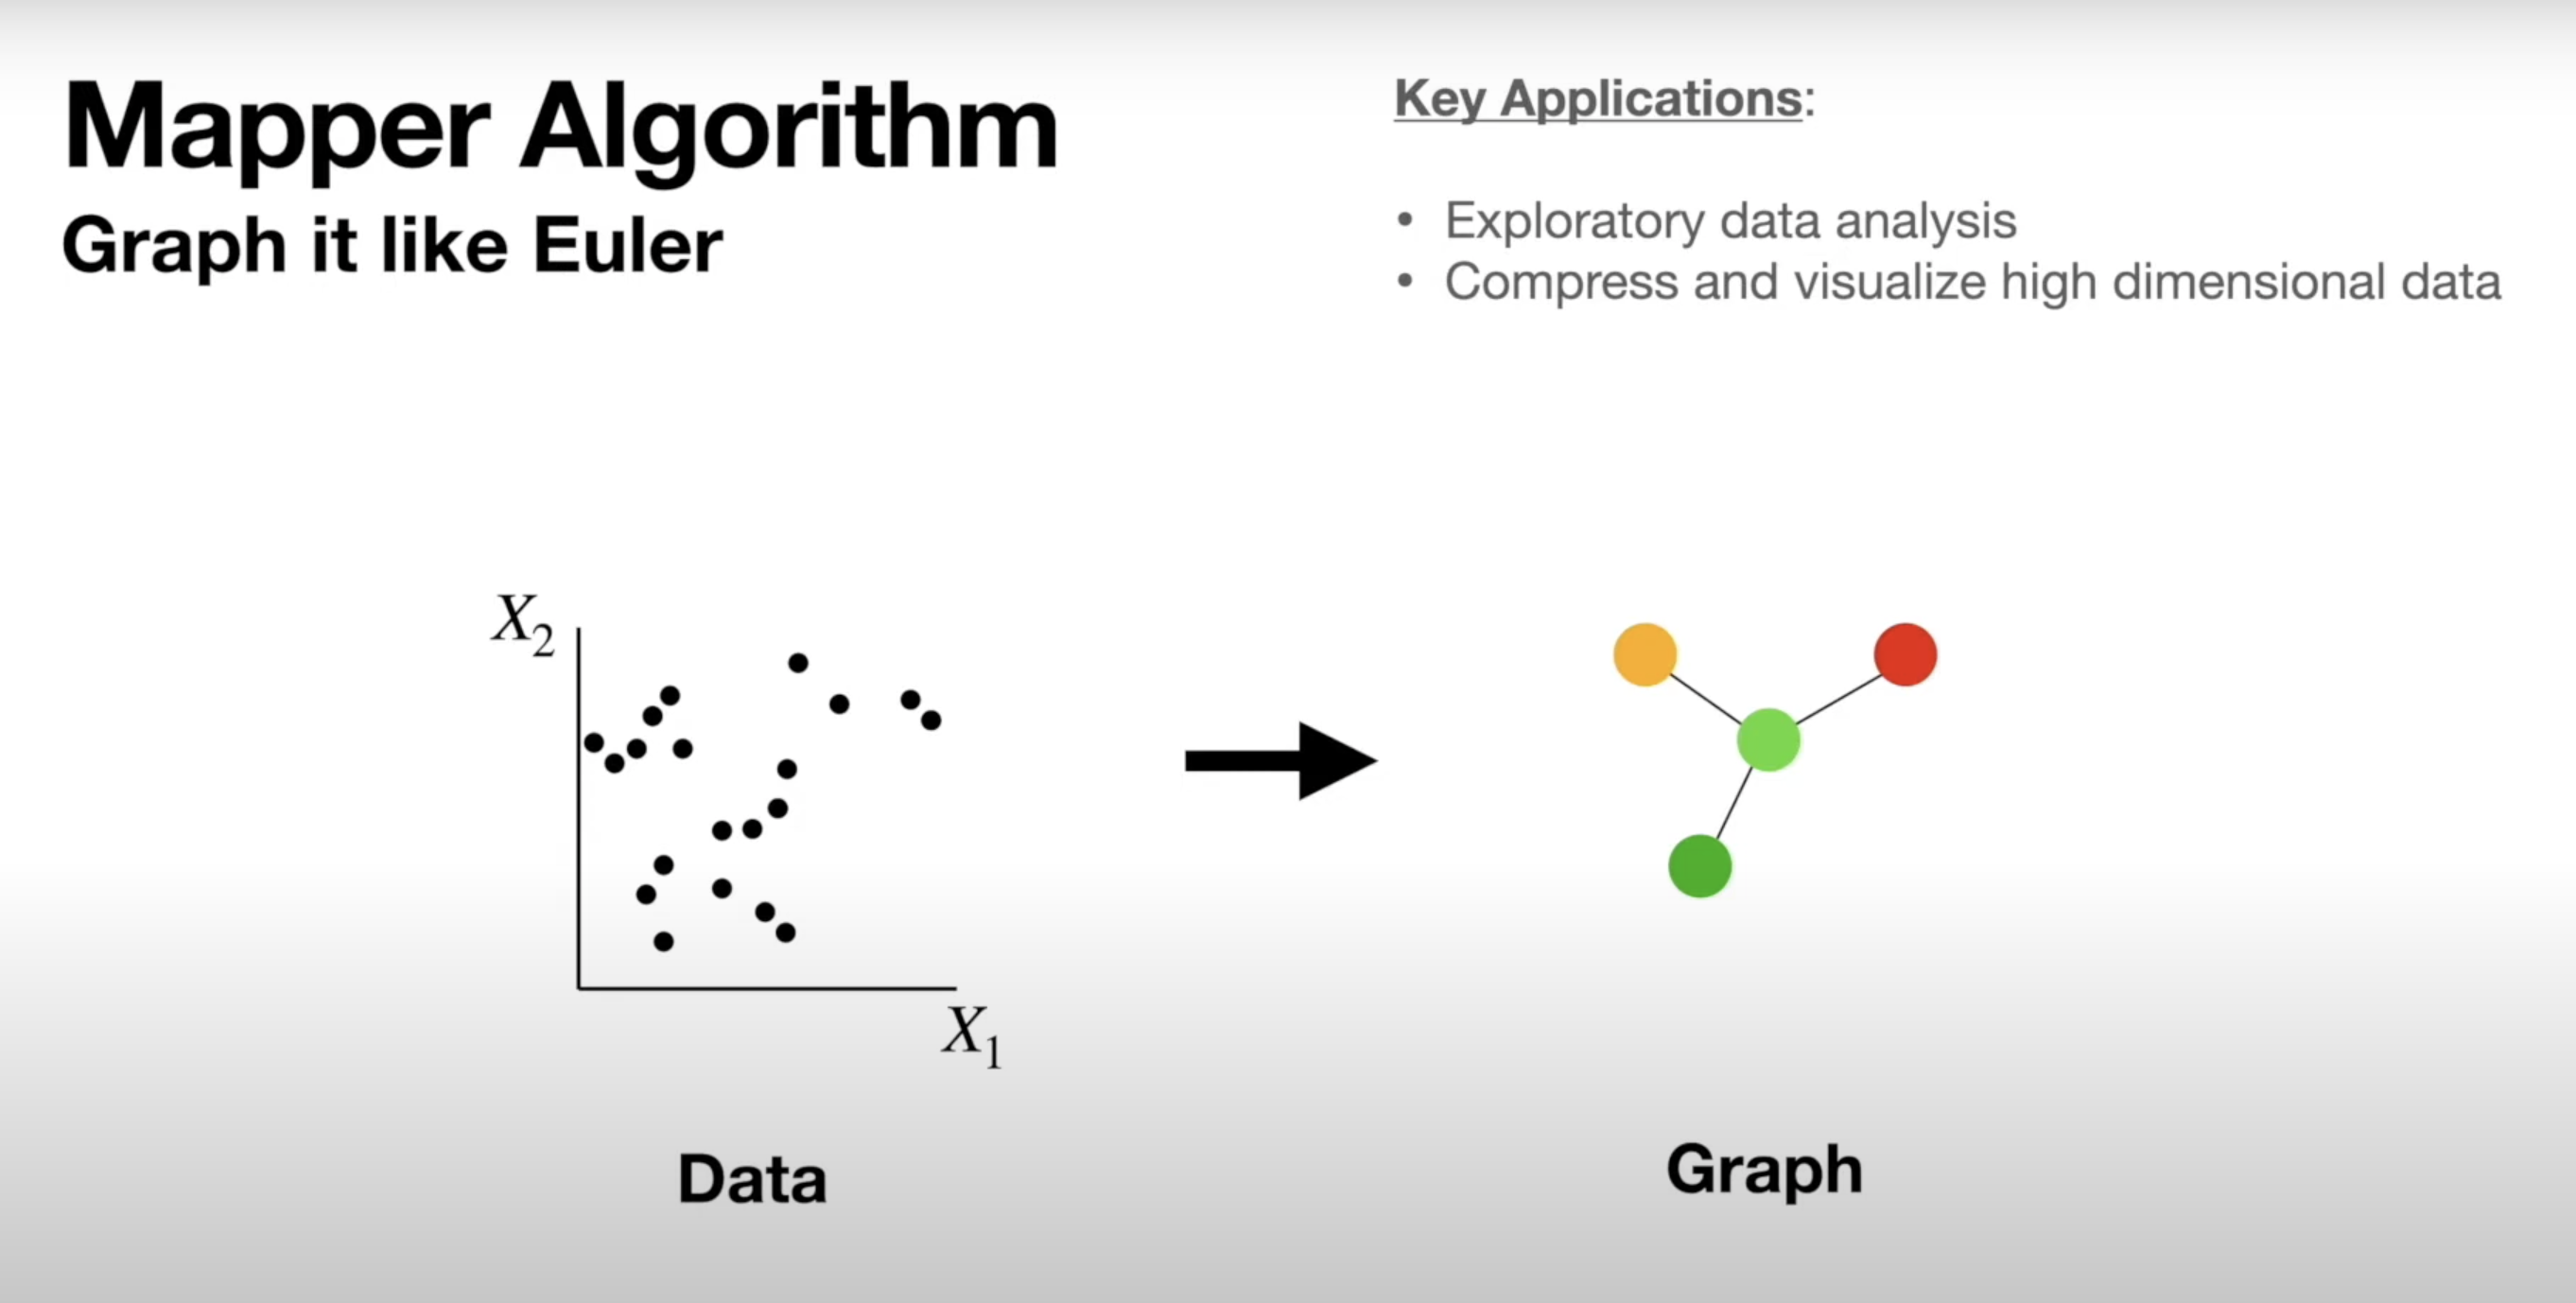 ## Mapper Algorithm 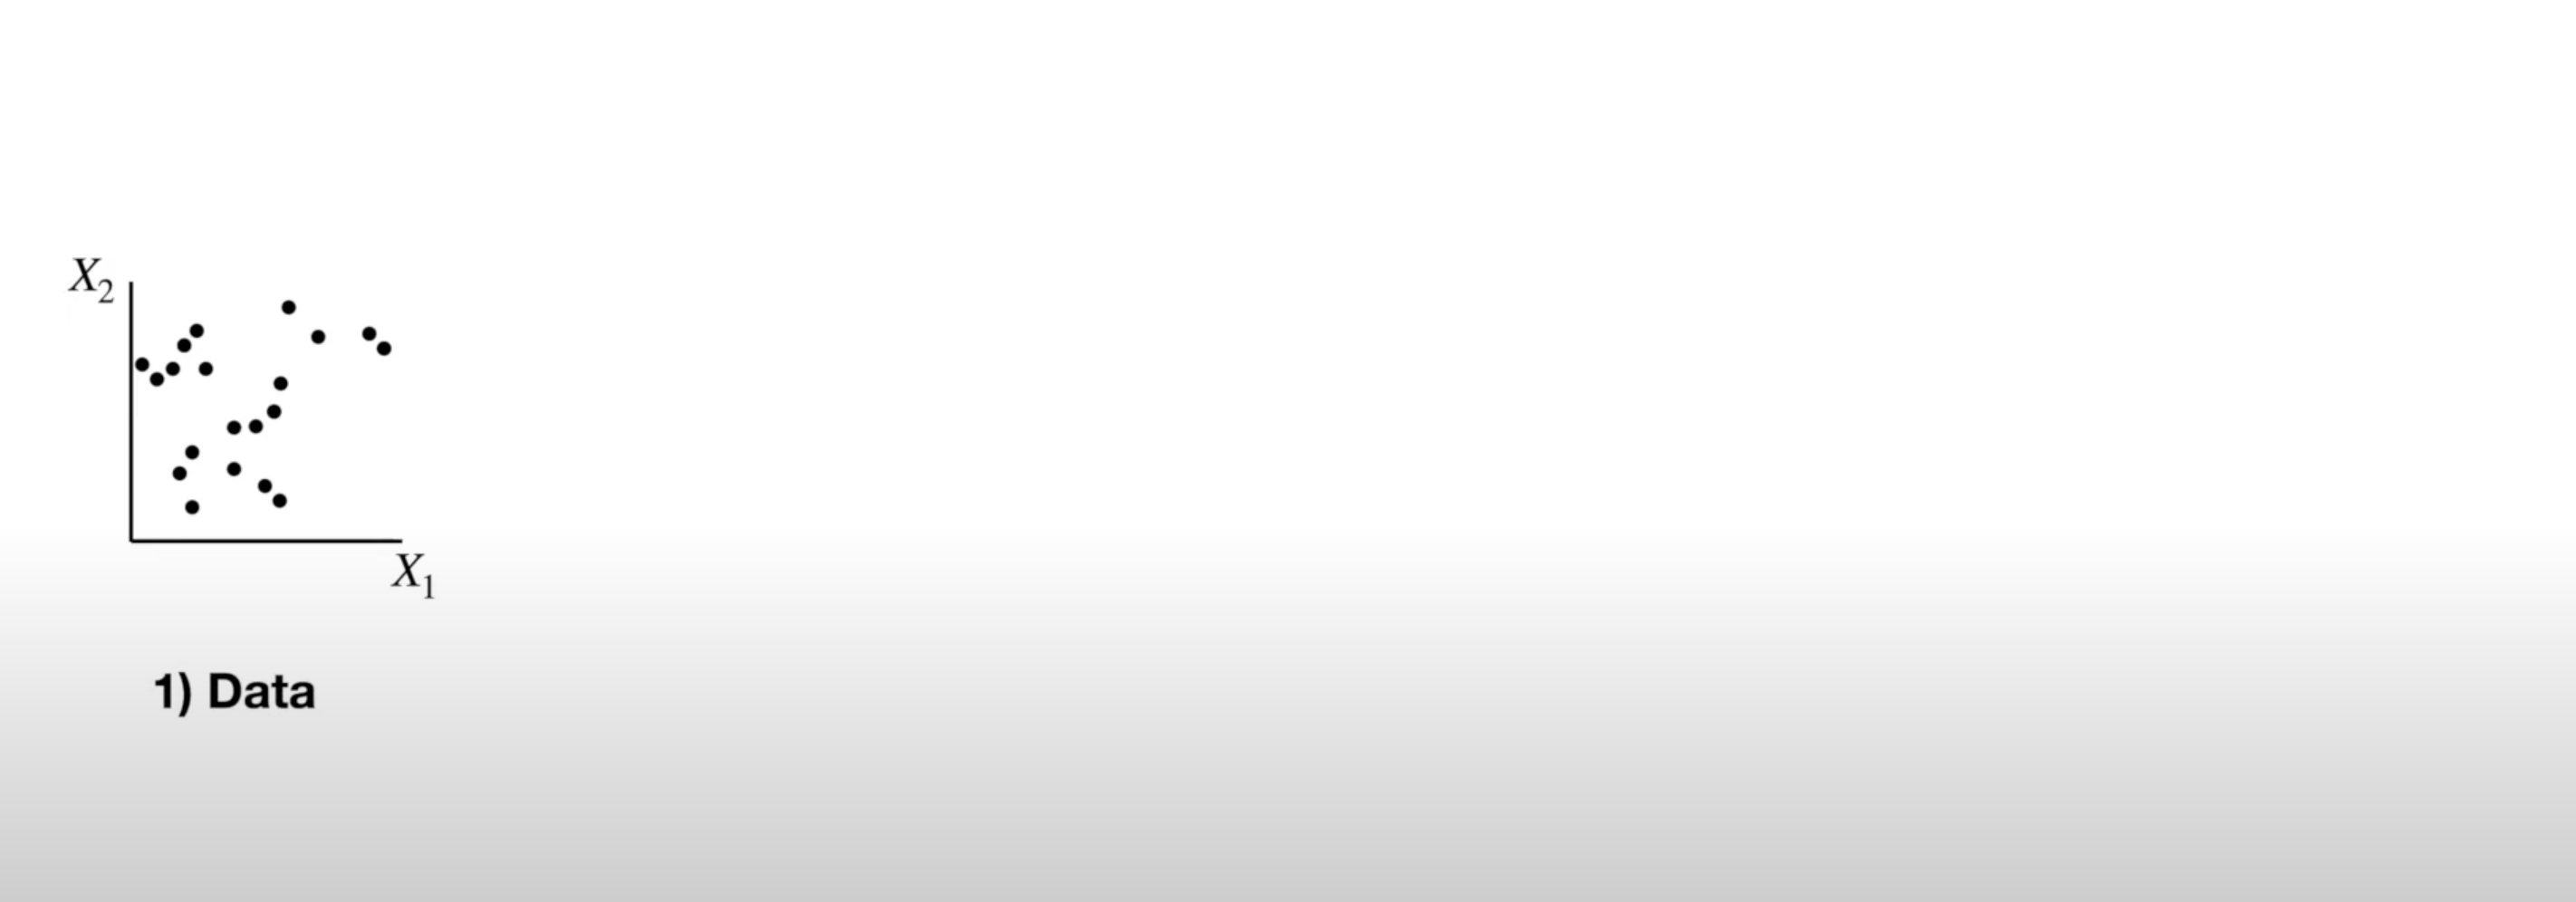 ## Mapper Algorithm 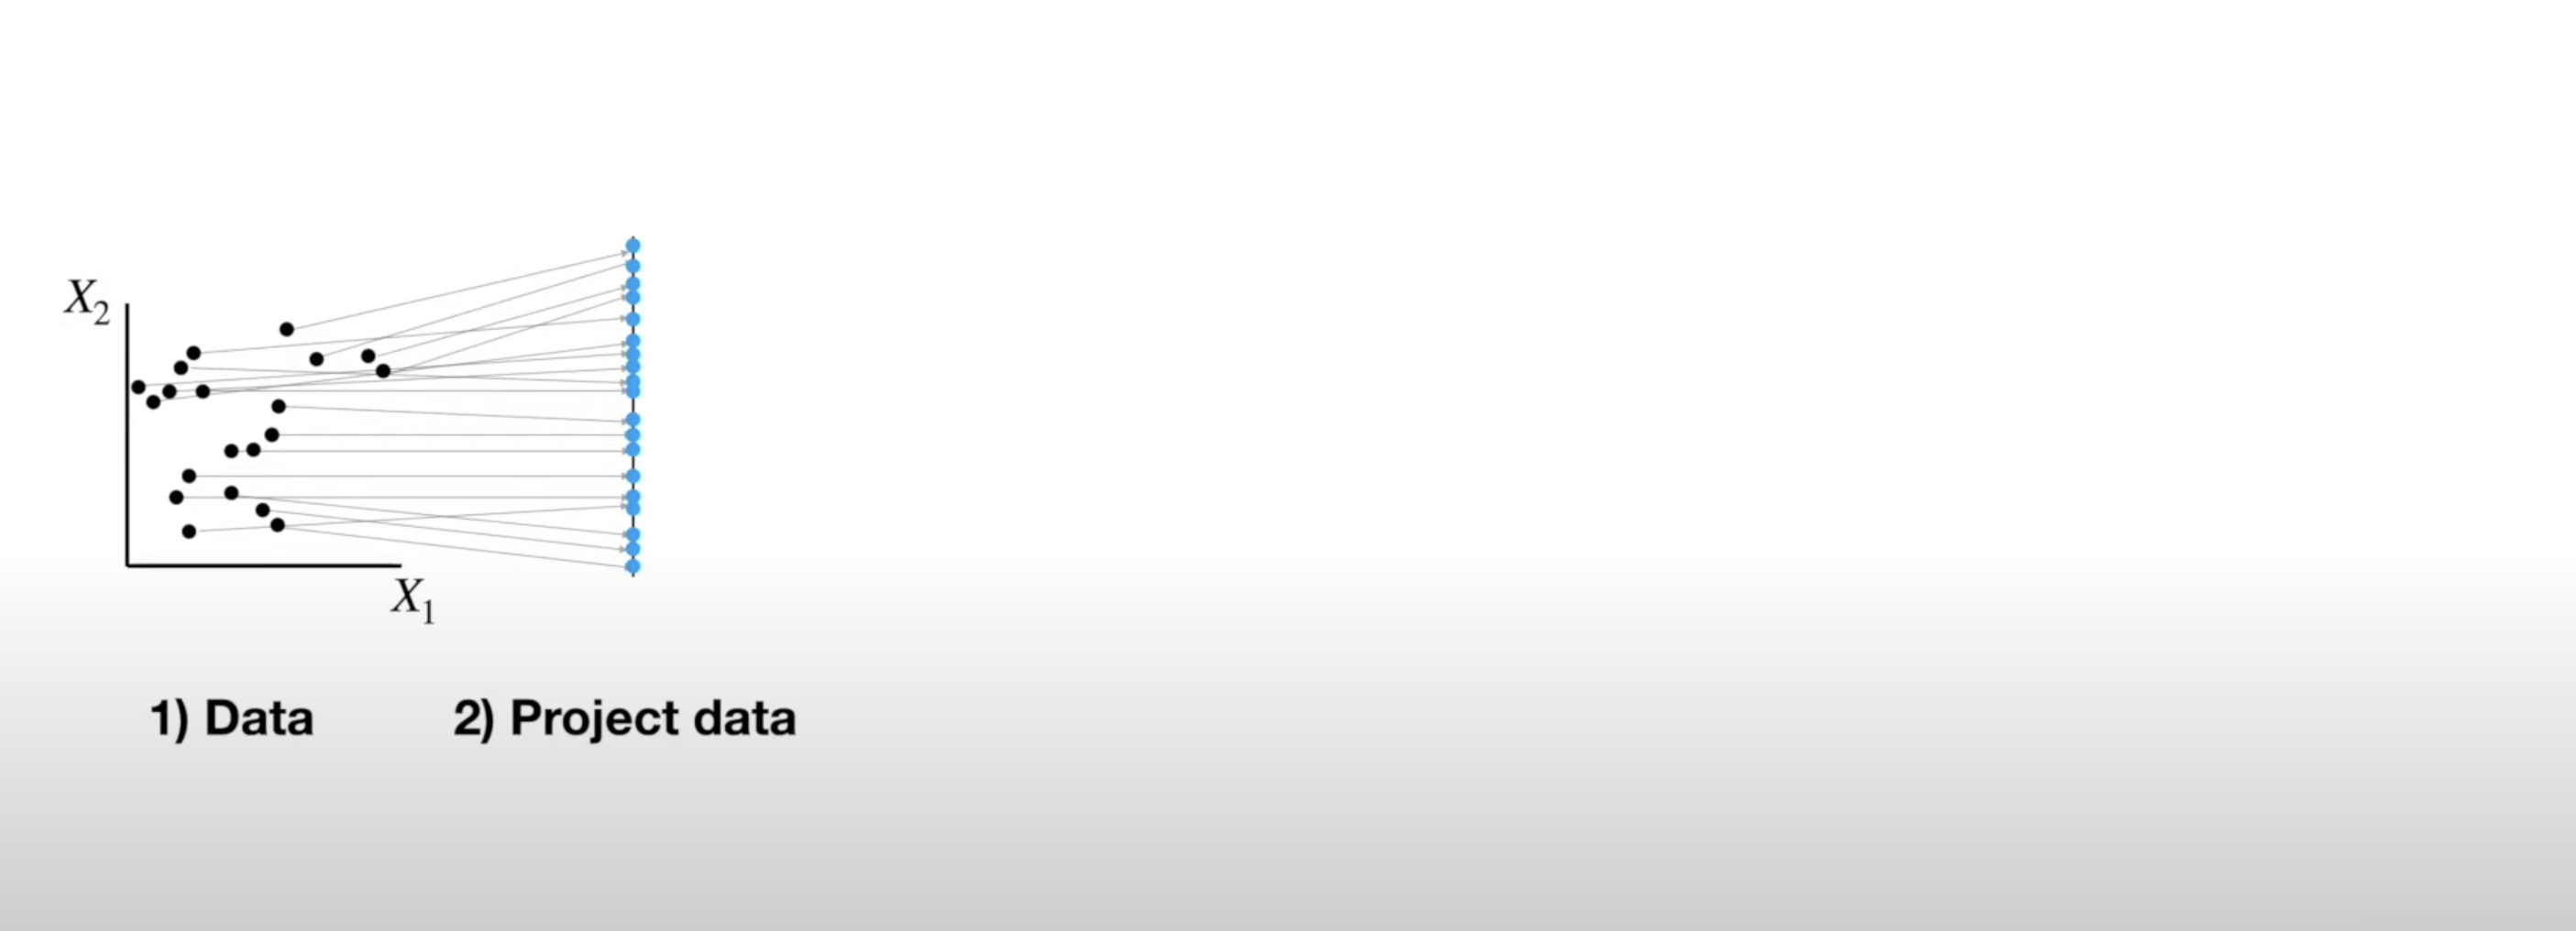 ## Mapper Algorithm 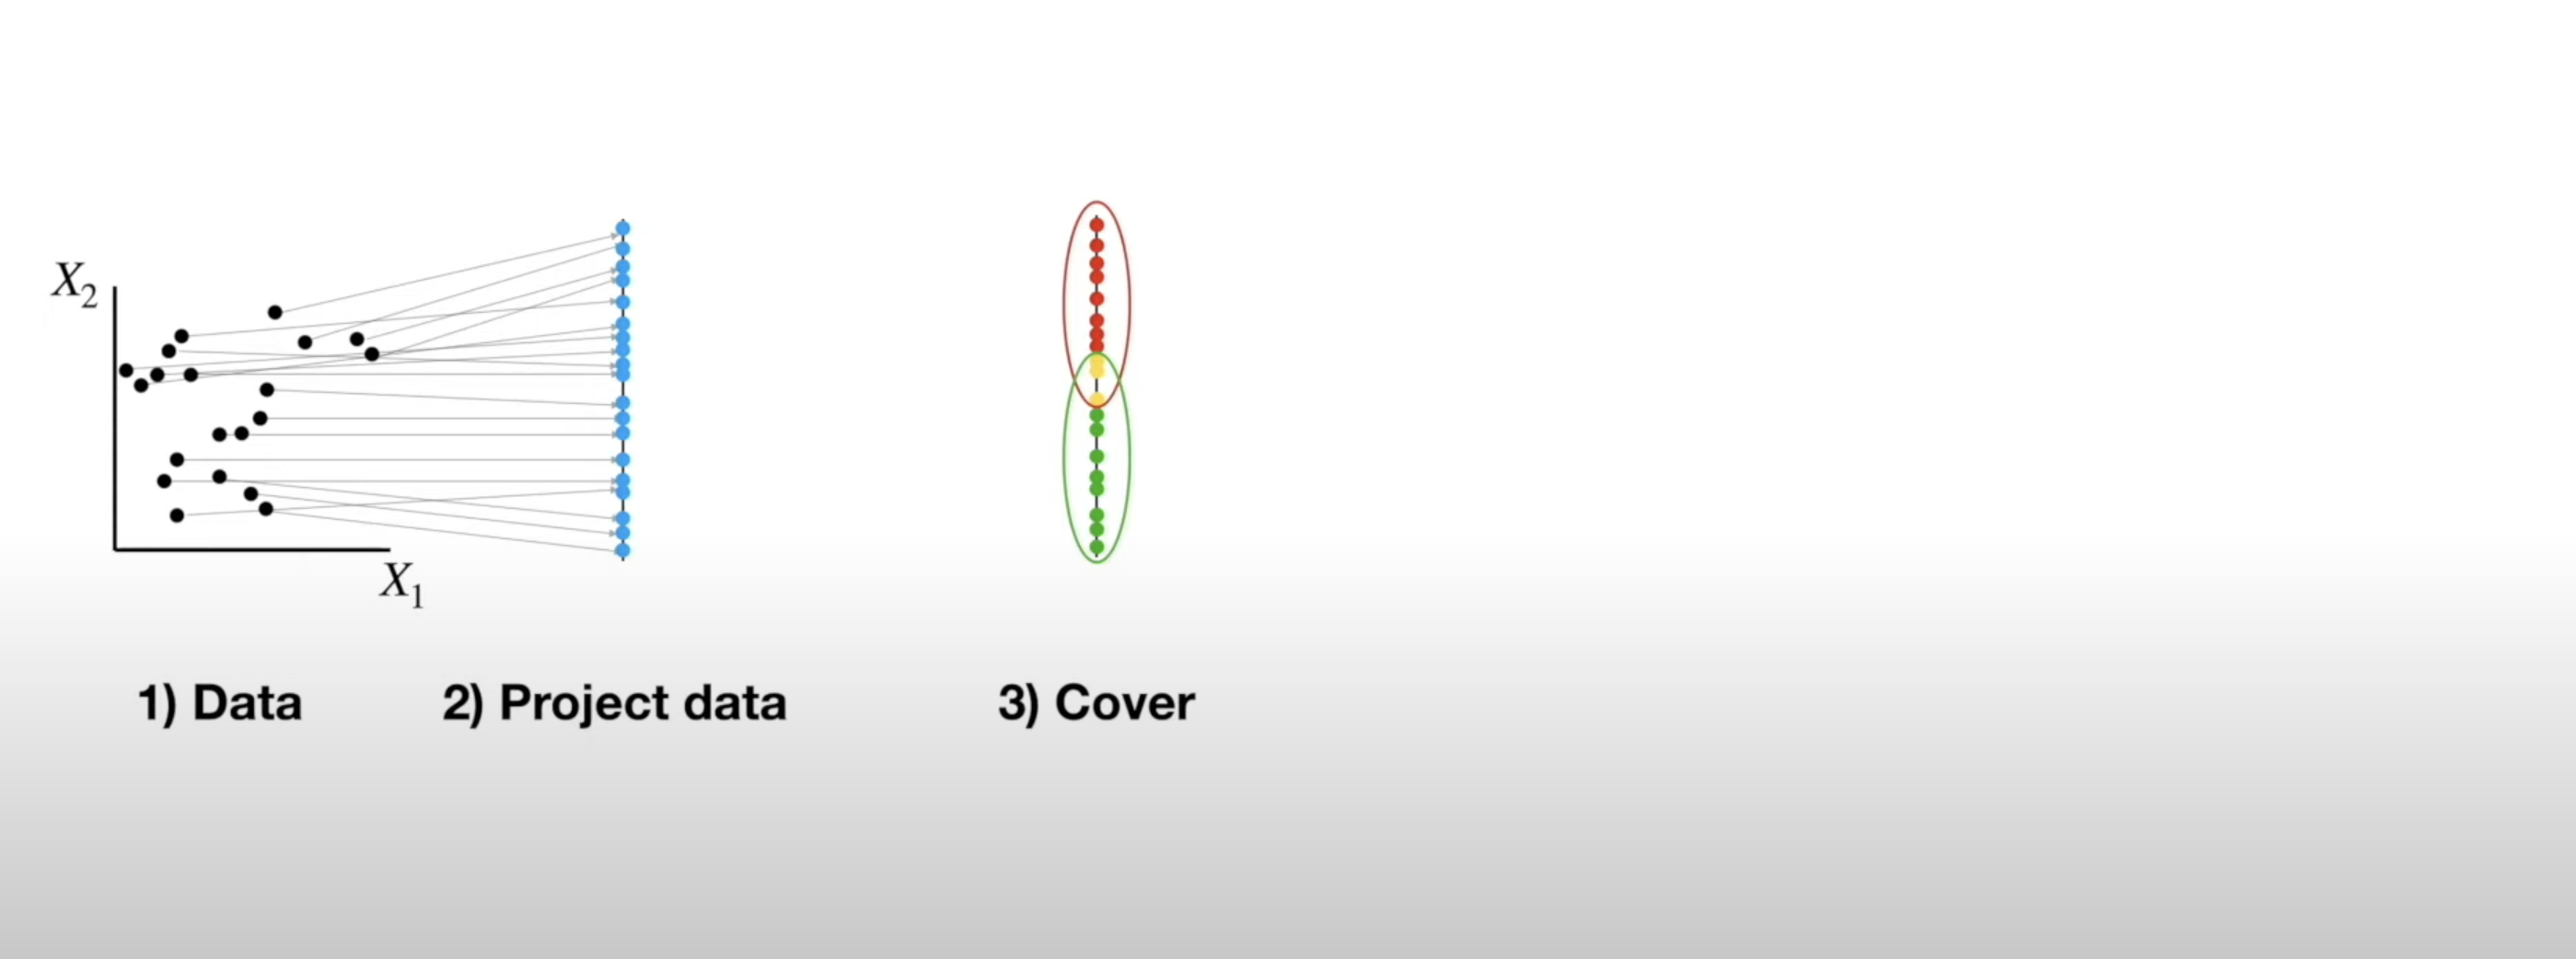 ## Mapper Algorithm 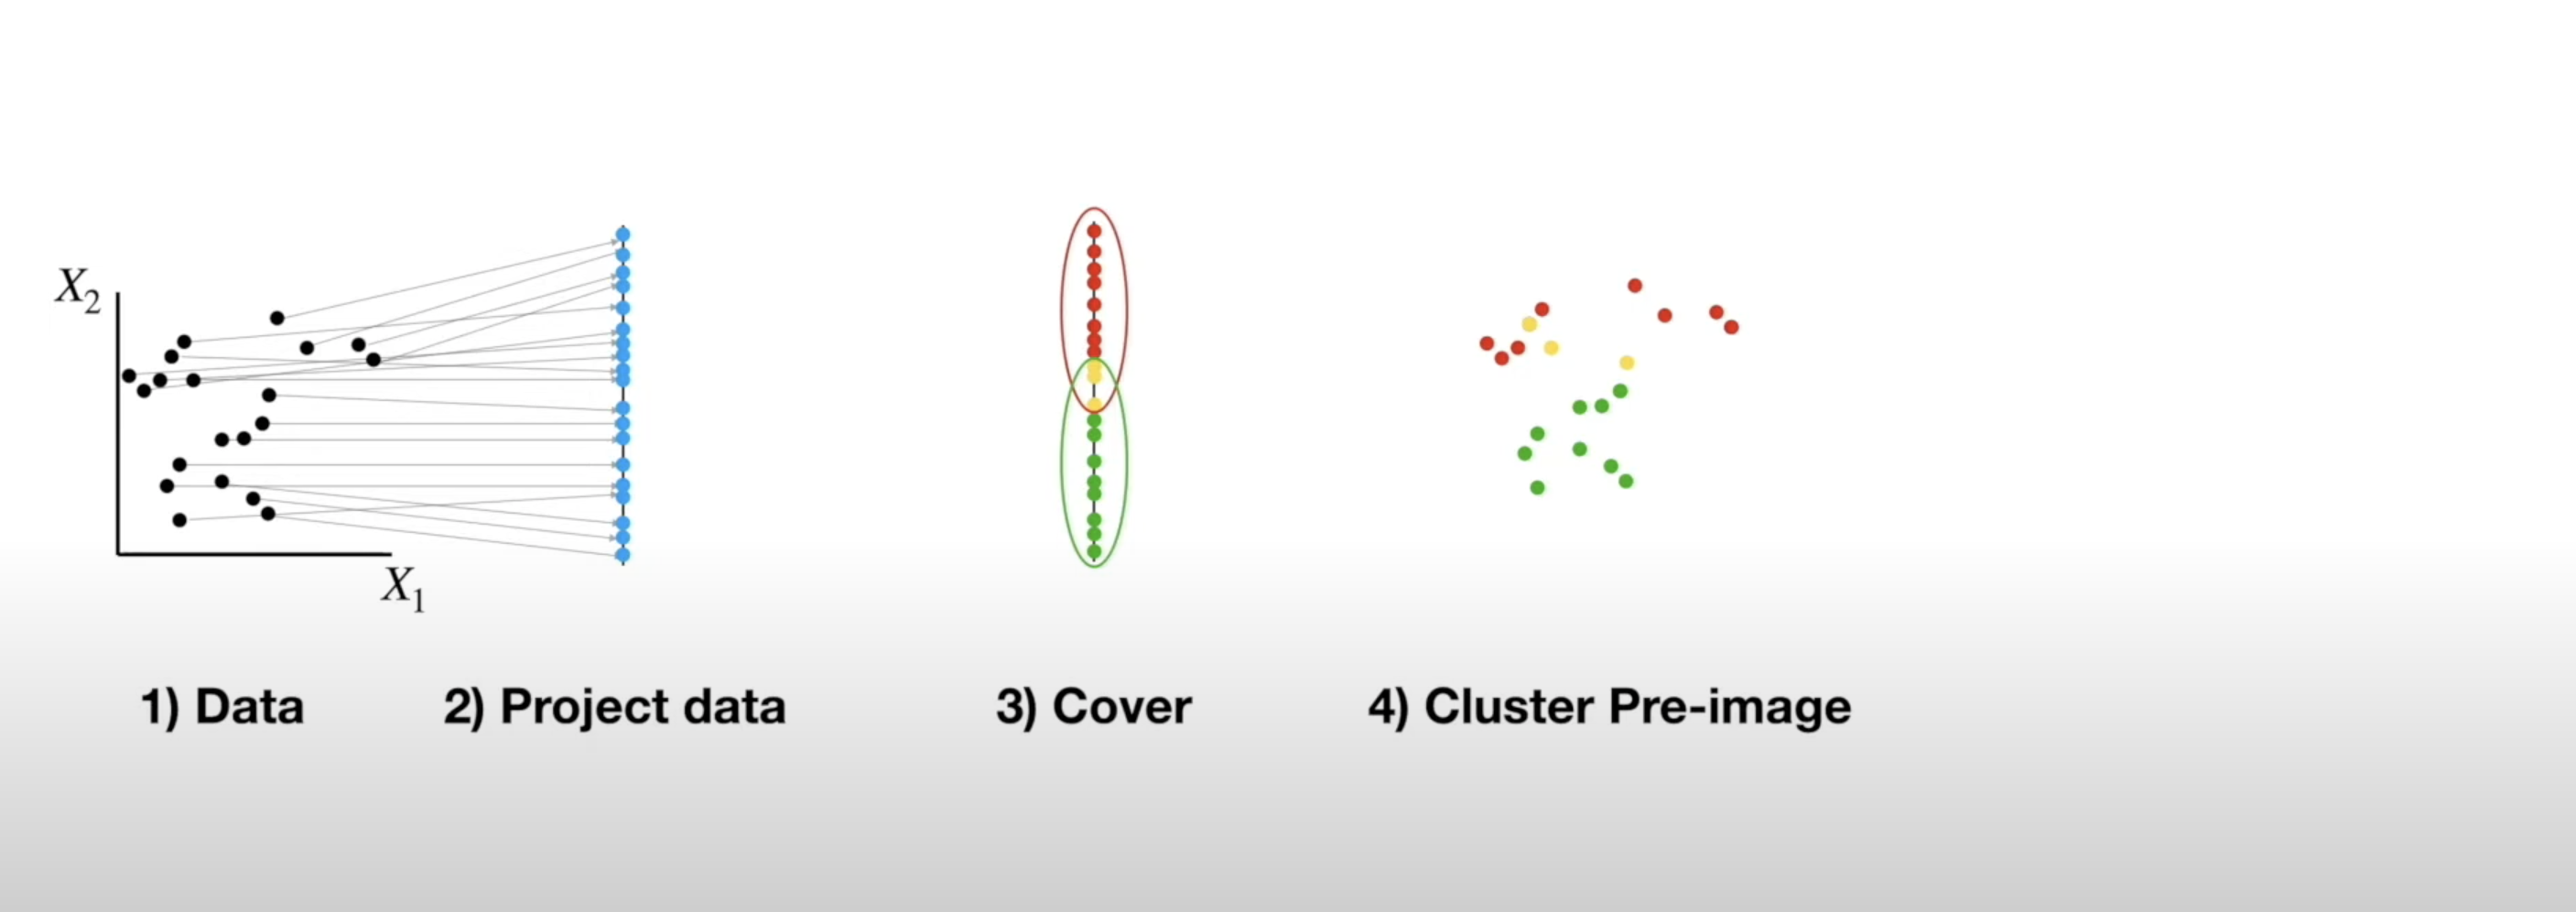 ## Mapper Algorithm 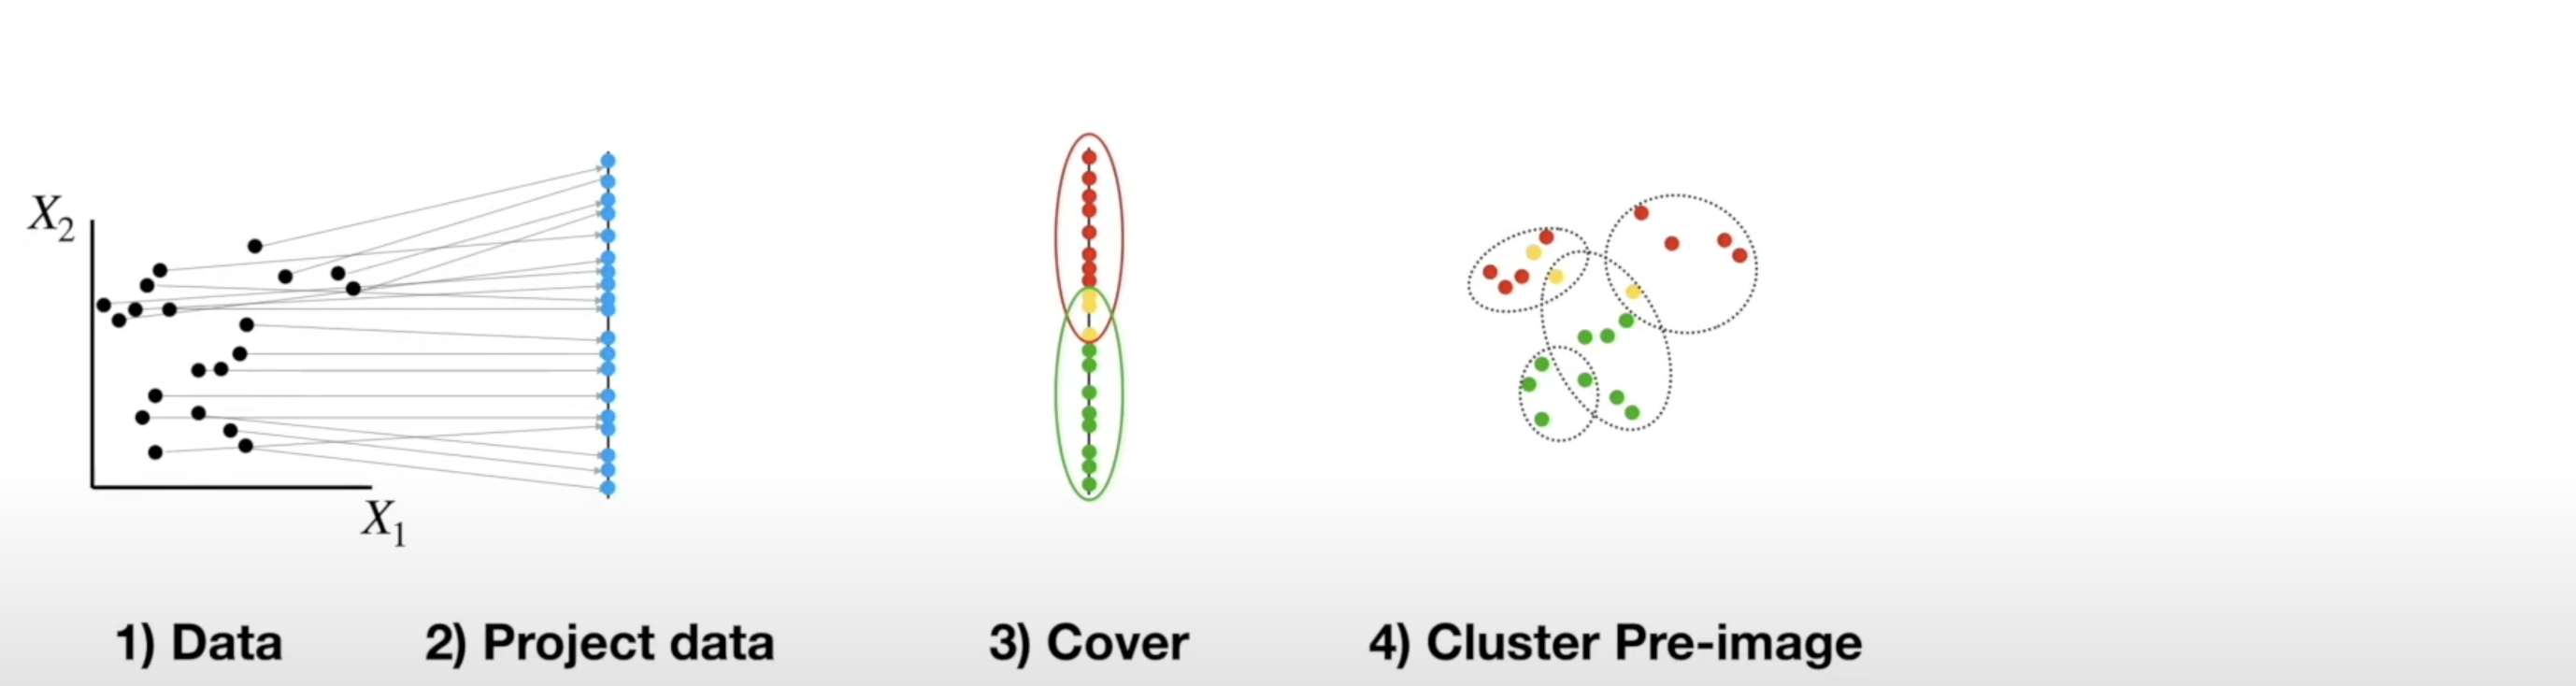 ## Mapper Algorithm 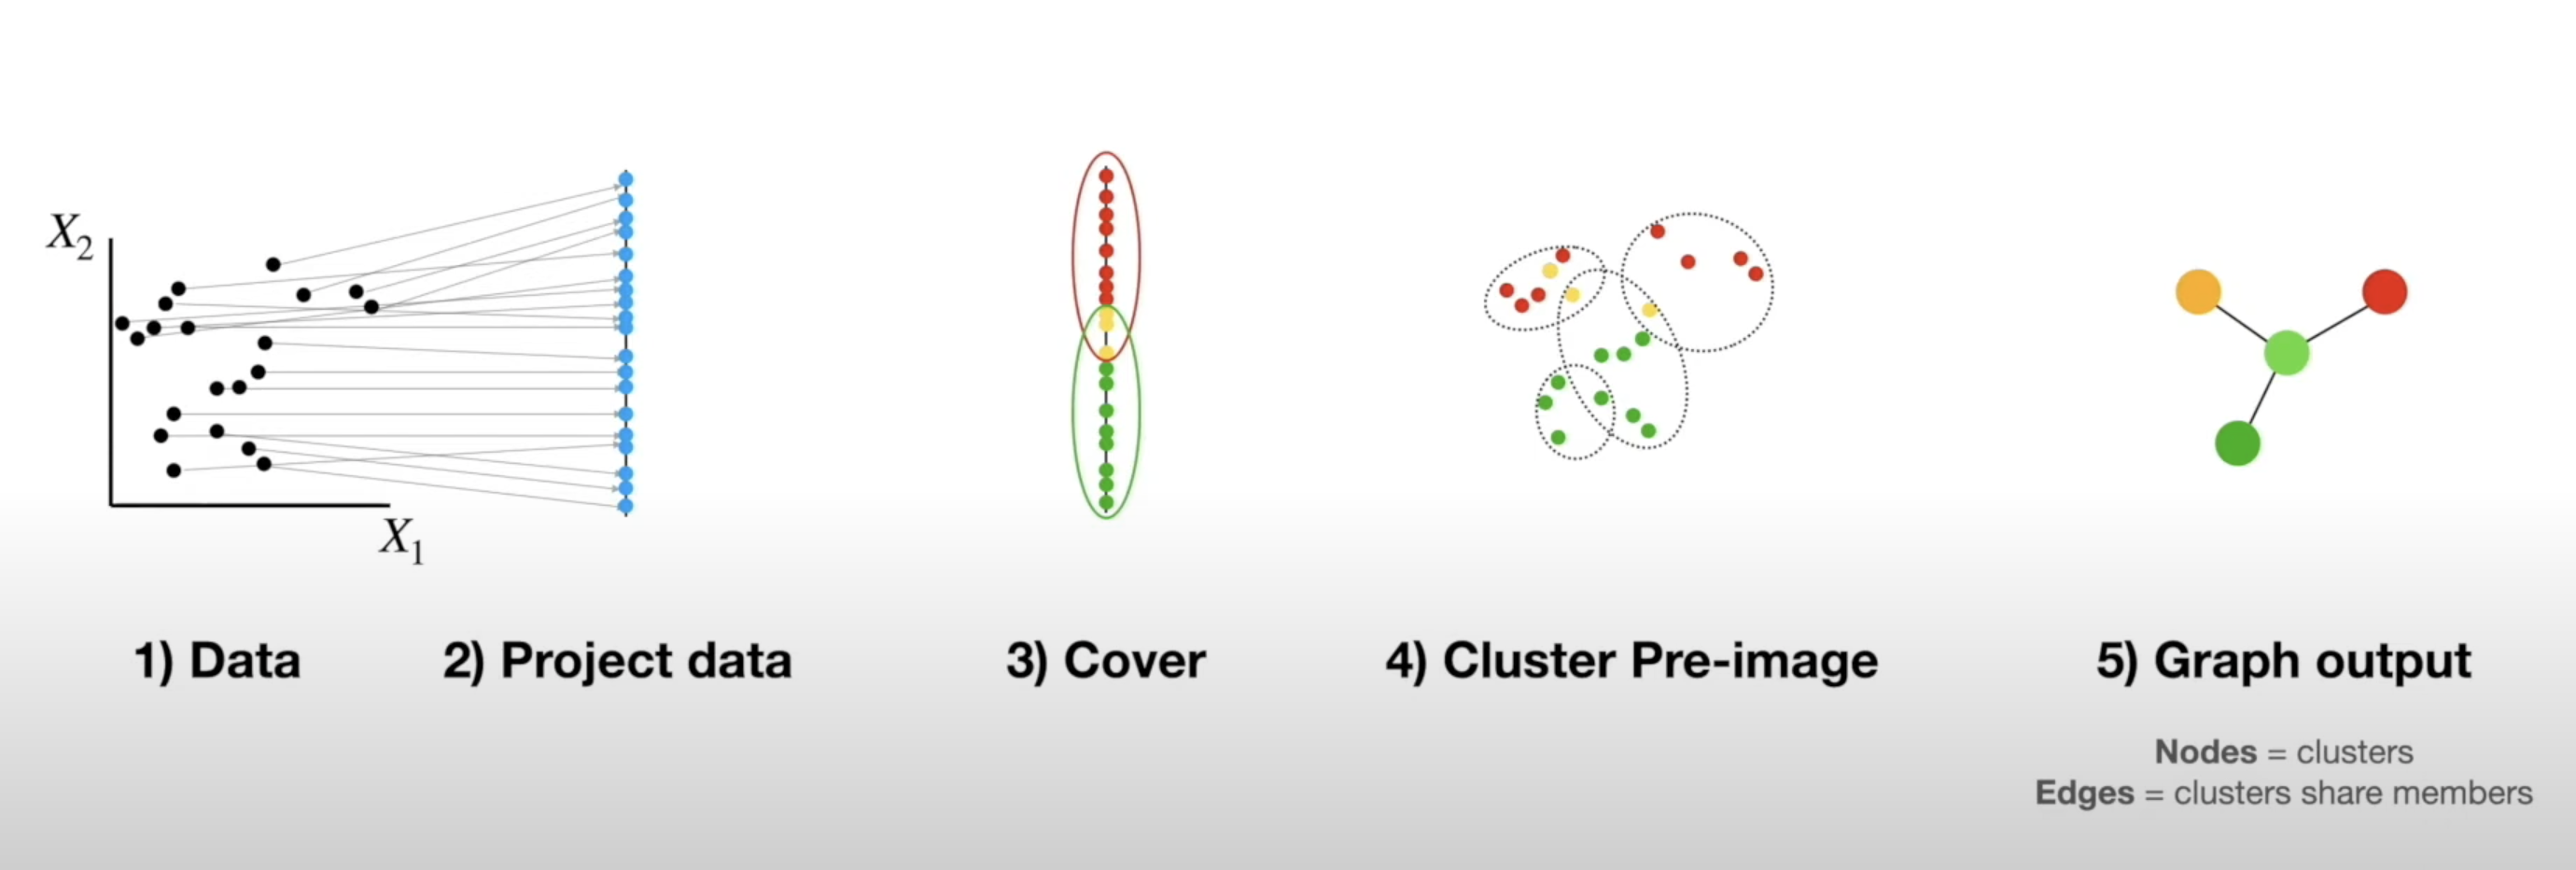 ## Example on Real Data in Python ## Persistent Homology - TDA is about looking at the shape of data - All polygons can be broken down into the simplest shape - a triangle - If we want to analyze the shape of our data, we can break it down into triangles - this is the idea behind persistent homology 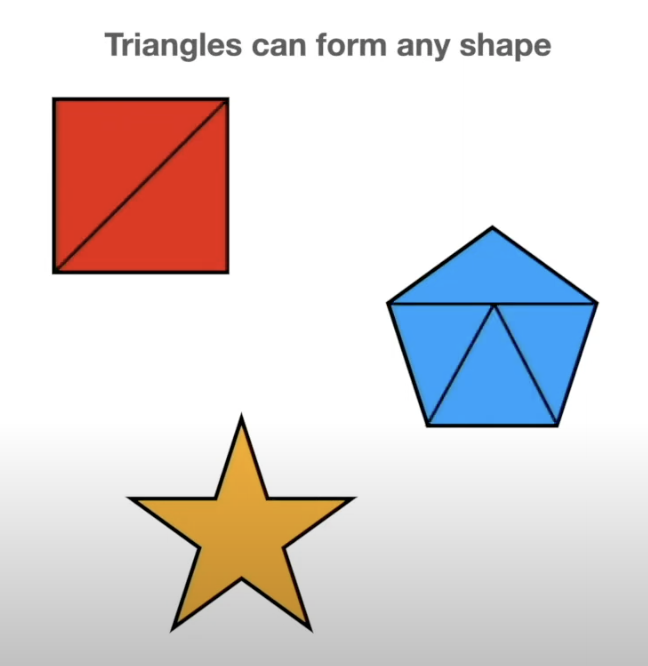 ## Persistent Homology - But most datasets have more than two dimensions, so 2D triangles would not capture them - Instead we use simplexes - triangles generalized to any number of dimensions 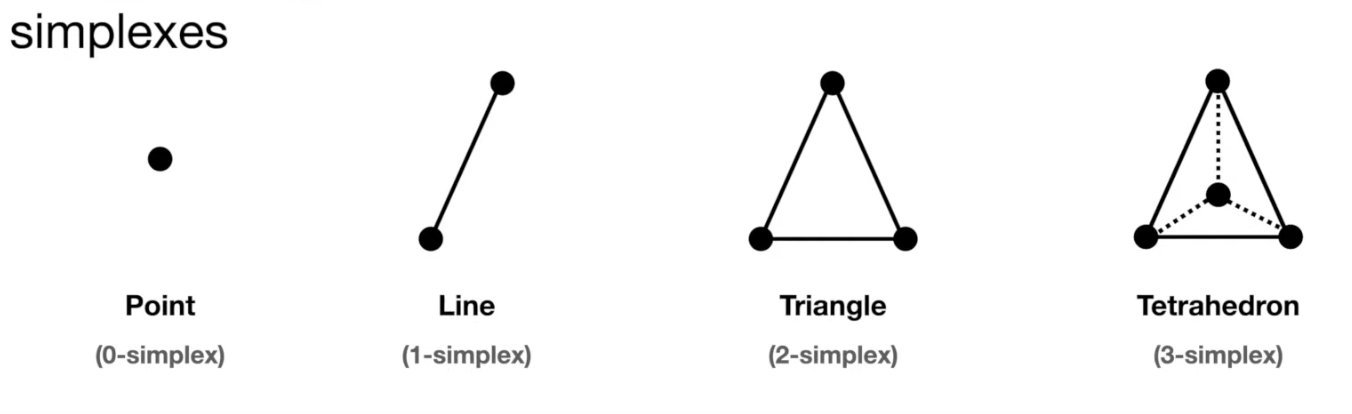 ## Persistent Homology - We can use collections of simplexes (simplicial complexes) to describe our data 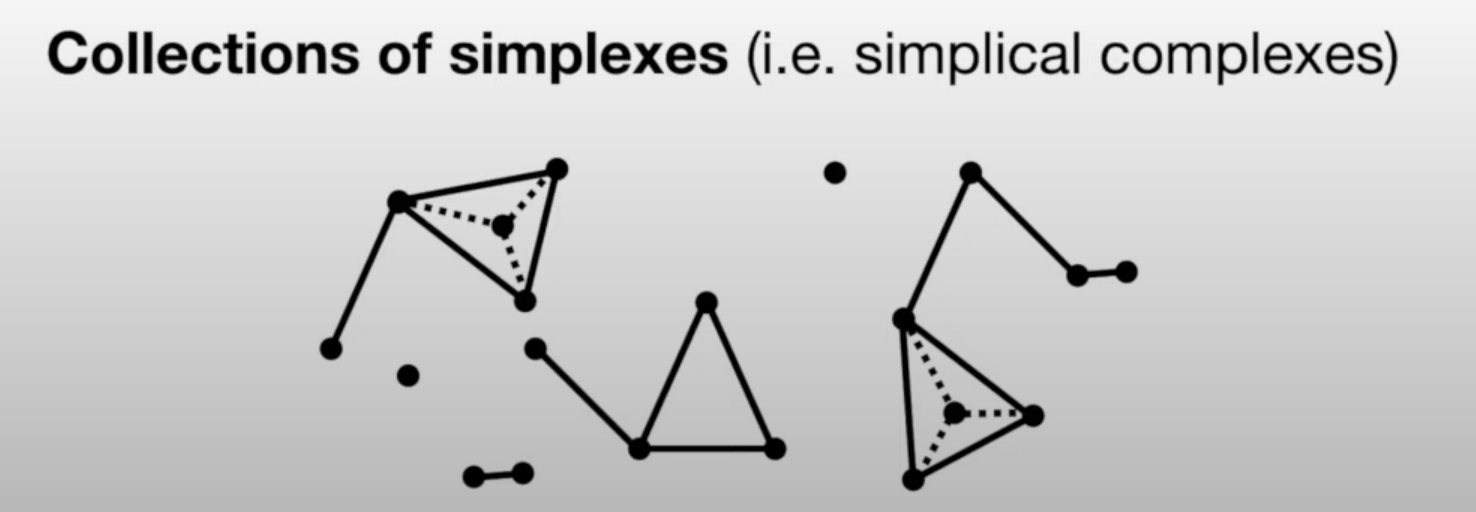 ## Persistent Homology - How do we compare these complex shapes? ## Persistent Homology - How do we compare these complex shapes? - These shapes can be characterized by their holes - we can compare them by counting their holes  ## Persistent Homology - The concept of "hole" can also be generalized to any dimension: 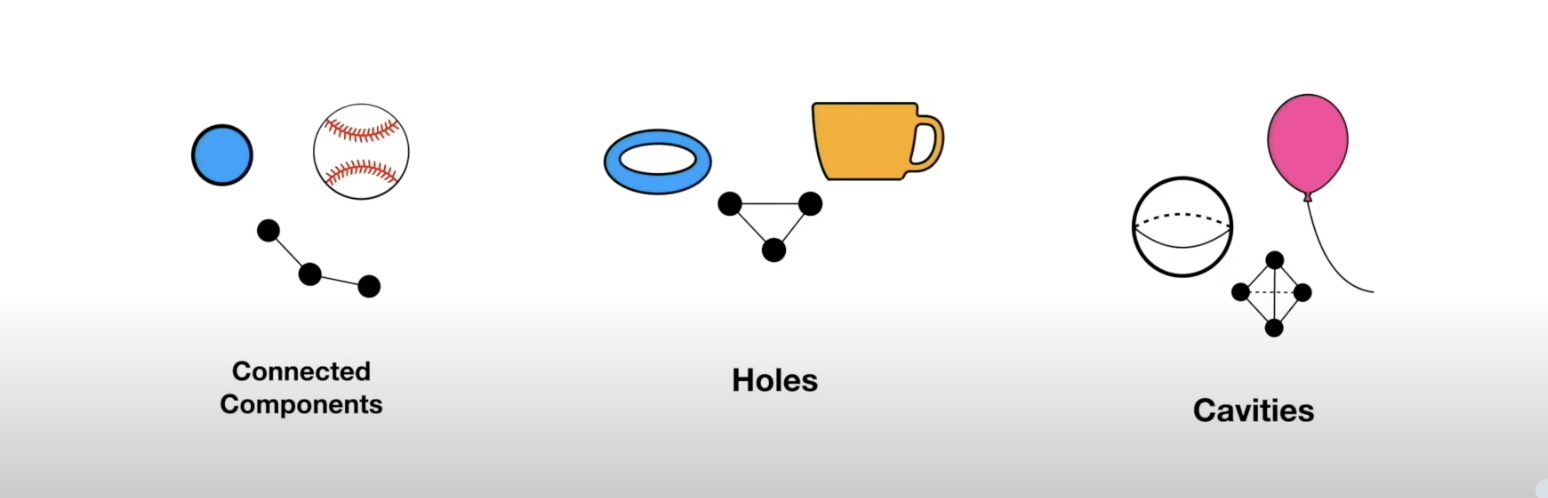 ## Persistent Homology - The concept of "hole" can also be generalized to any dimension (in 1 dimension we count connected components): 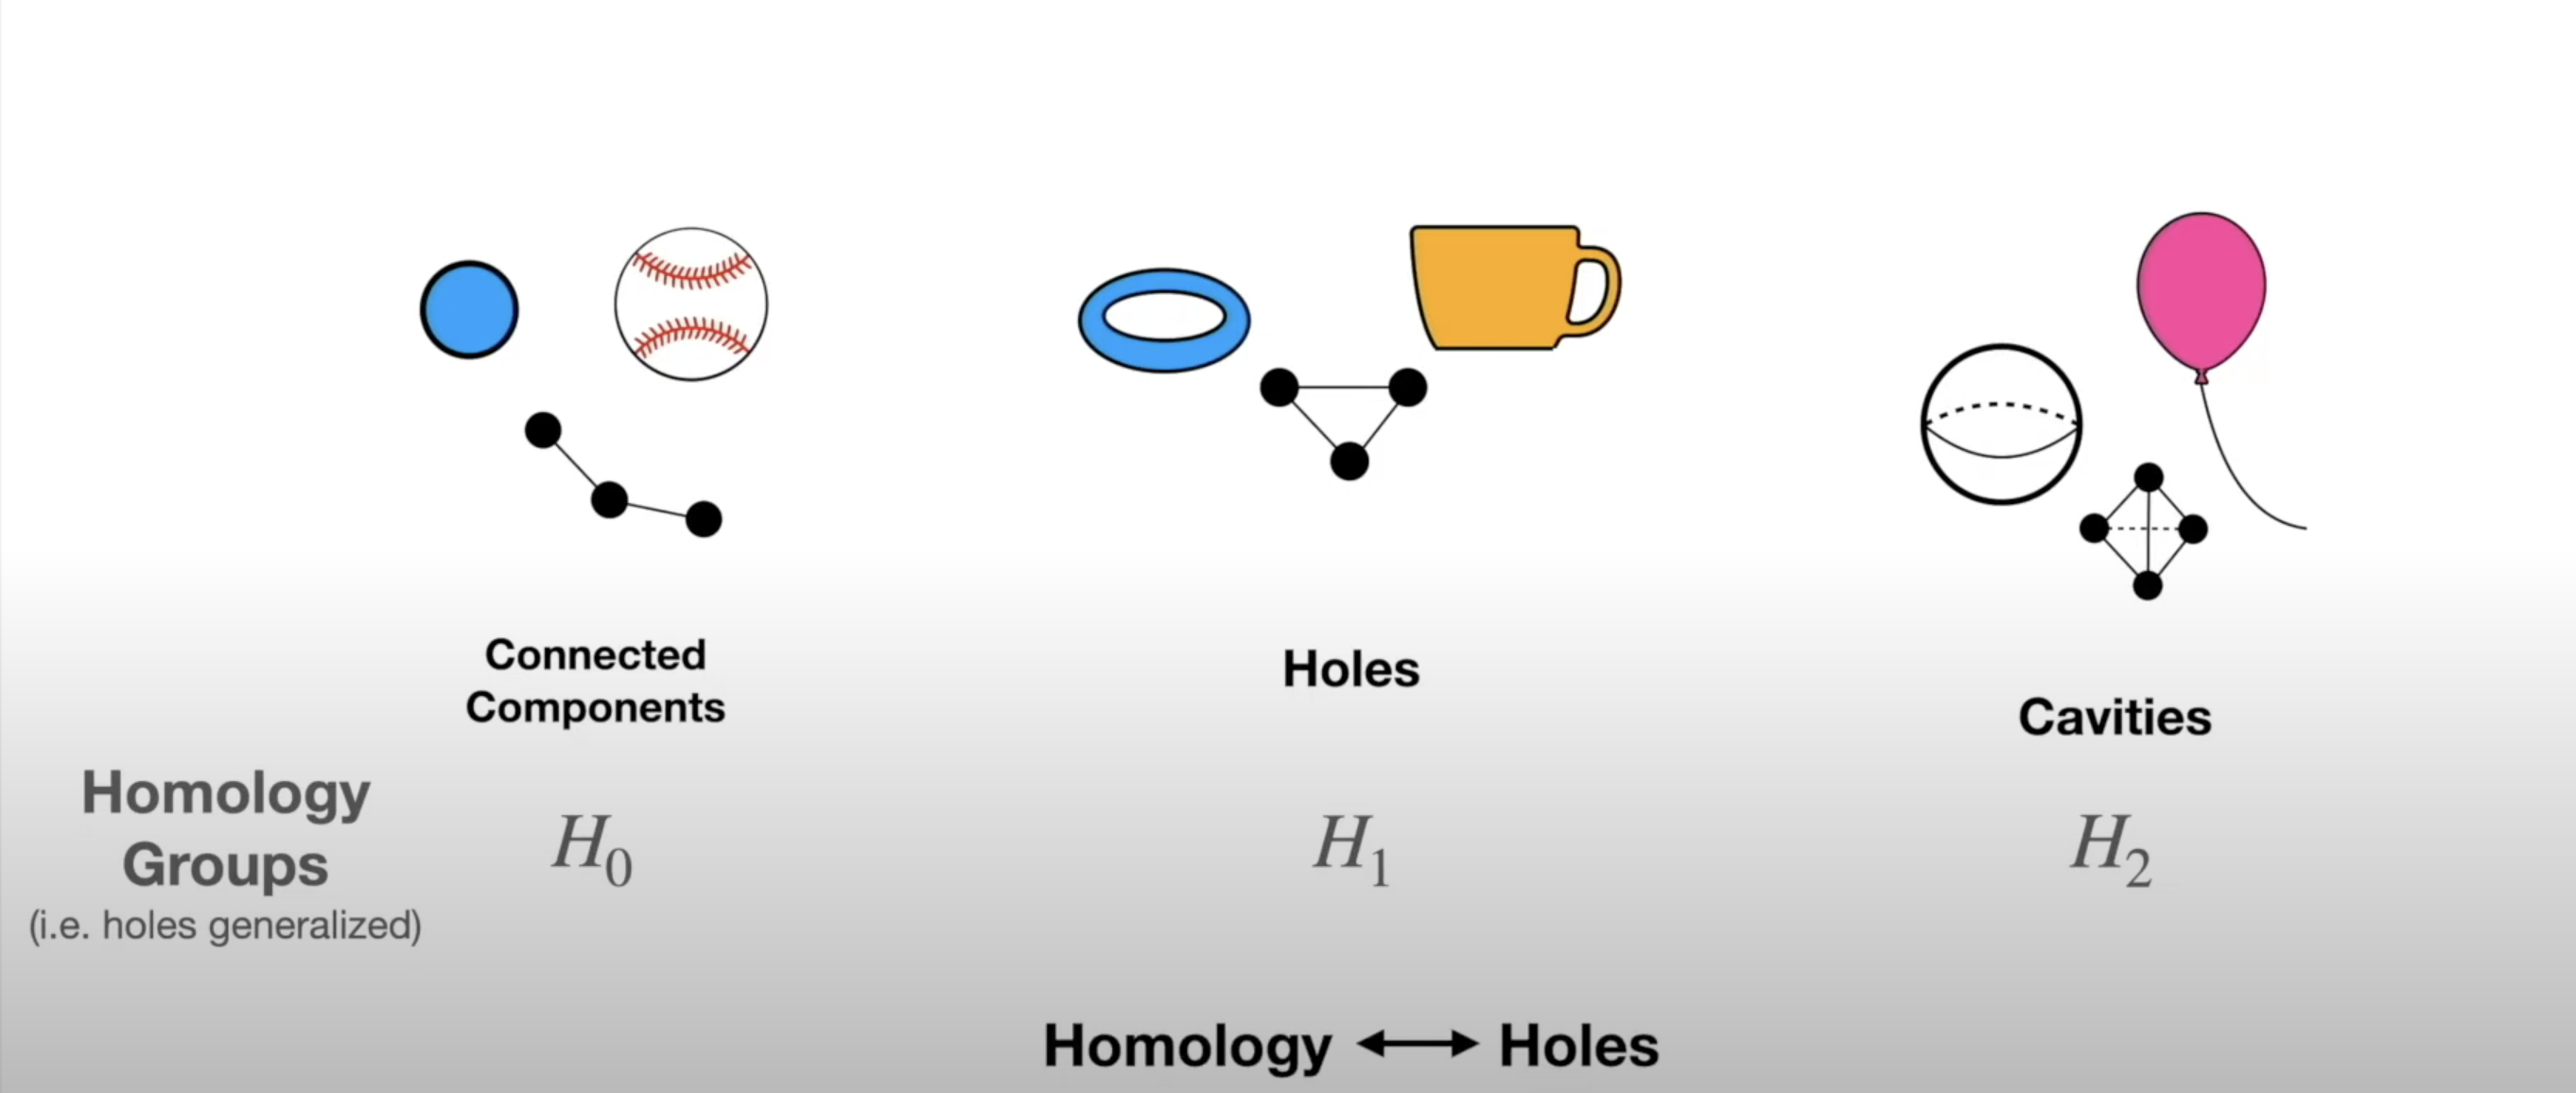 ## Persistent Homology - To perform persistent homology, we first draw n-dimensional circles around each point:  ## Persistent Homology - We can then create 1-simplexes by connecting the data points whose circles overlap:  ## Persistent Homology - Now we have two shapes: our initial 0-simplex (point cloud) and a shape made of 0- and 1-simplexes  ## Persistent Homology - We can compare their homologies by counting the number of connected components:  ## Persistent Homology - We repeat this step, increasing the radius of the circles - We see 2-simplexes start to appear and the number of connected components decreases:  ## Persistent Homology - We can do this for every choice of radius between 0 and the radius which yields only one connected component: 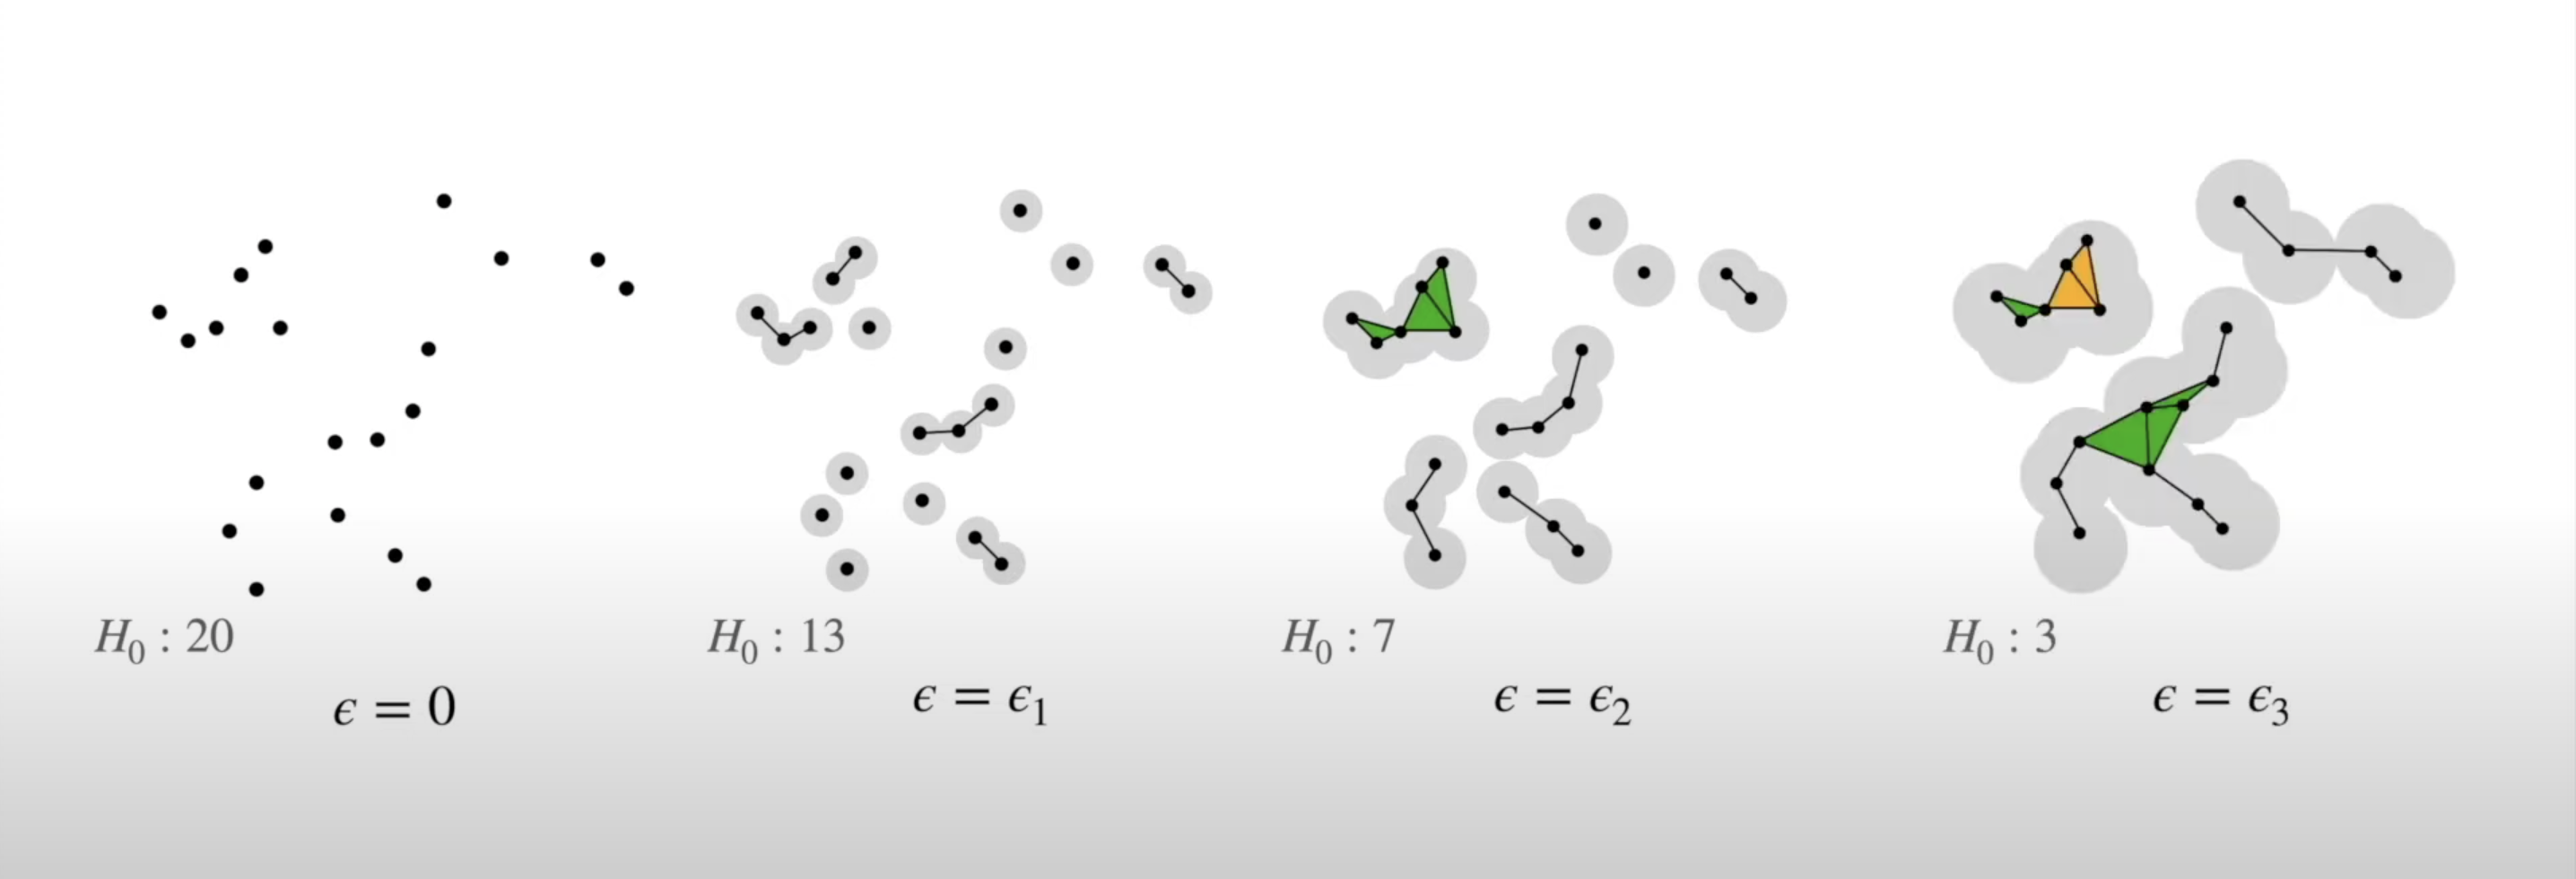 ## Persistent Homology - This allows us to analyze which topological features of our data are significant based on how long they "persist" during the circle-growing process (longer persistence = more significant)  ## Persistence Diagram - Points close to y=x are noise, points far from y=x are significant 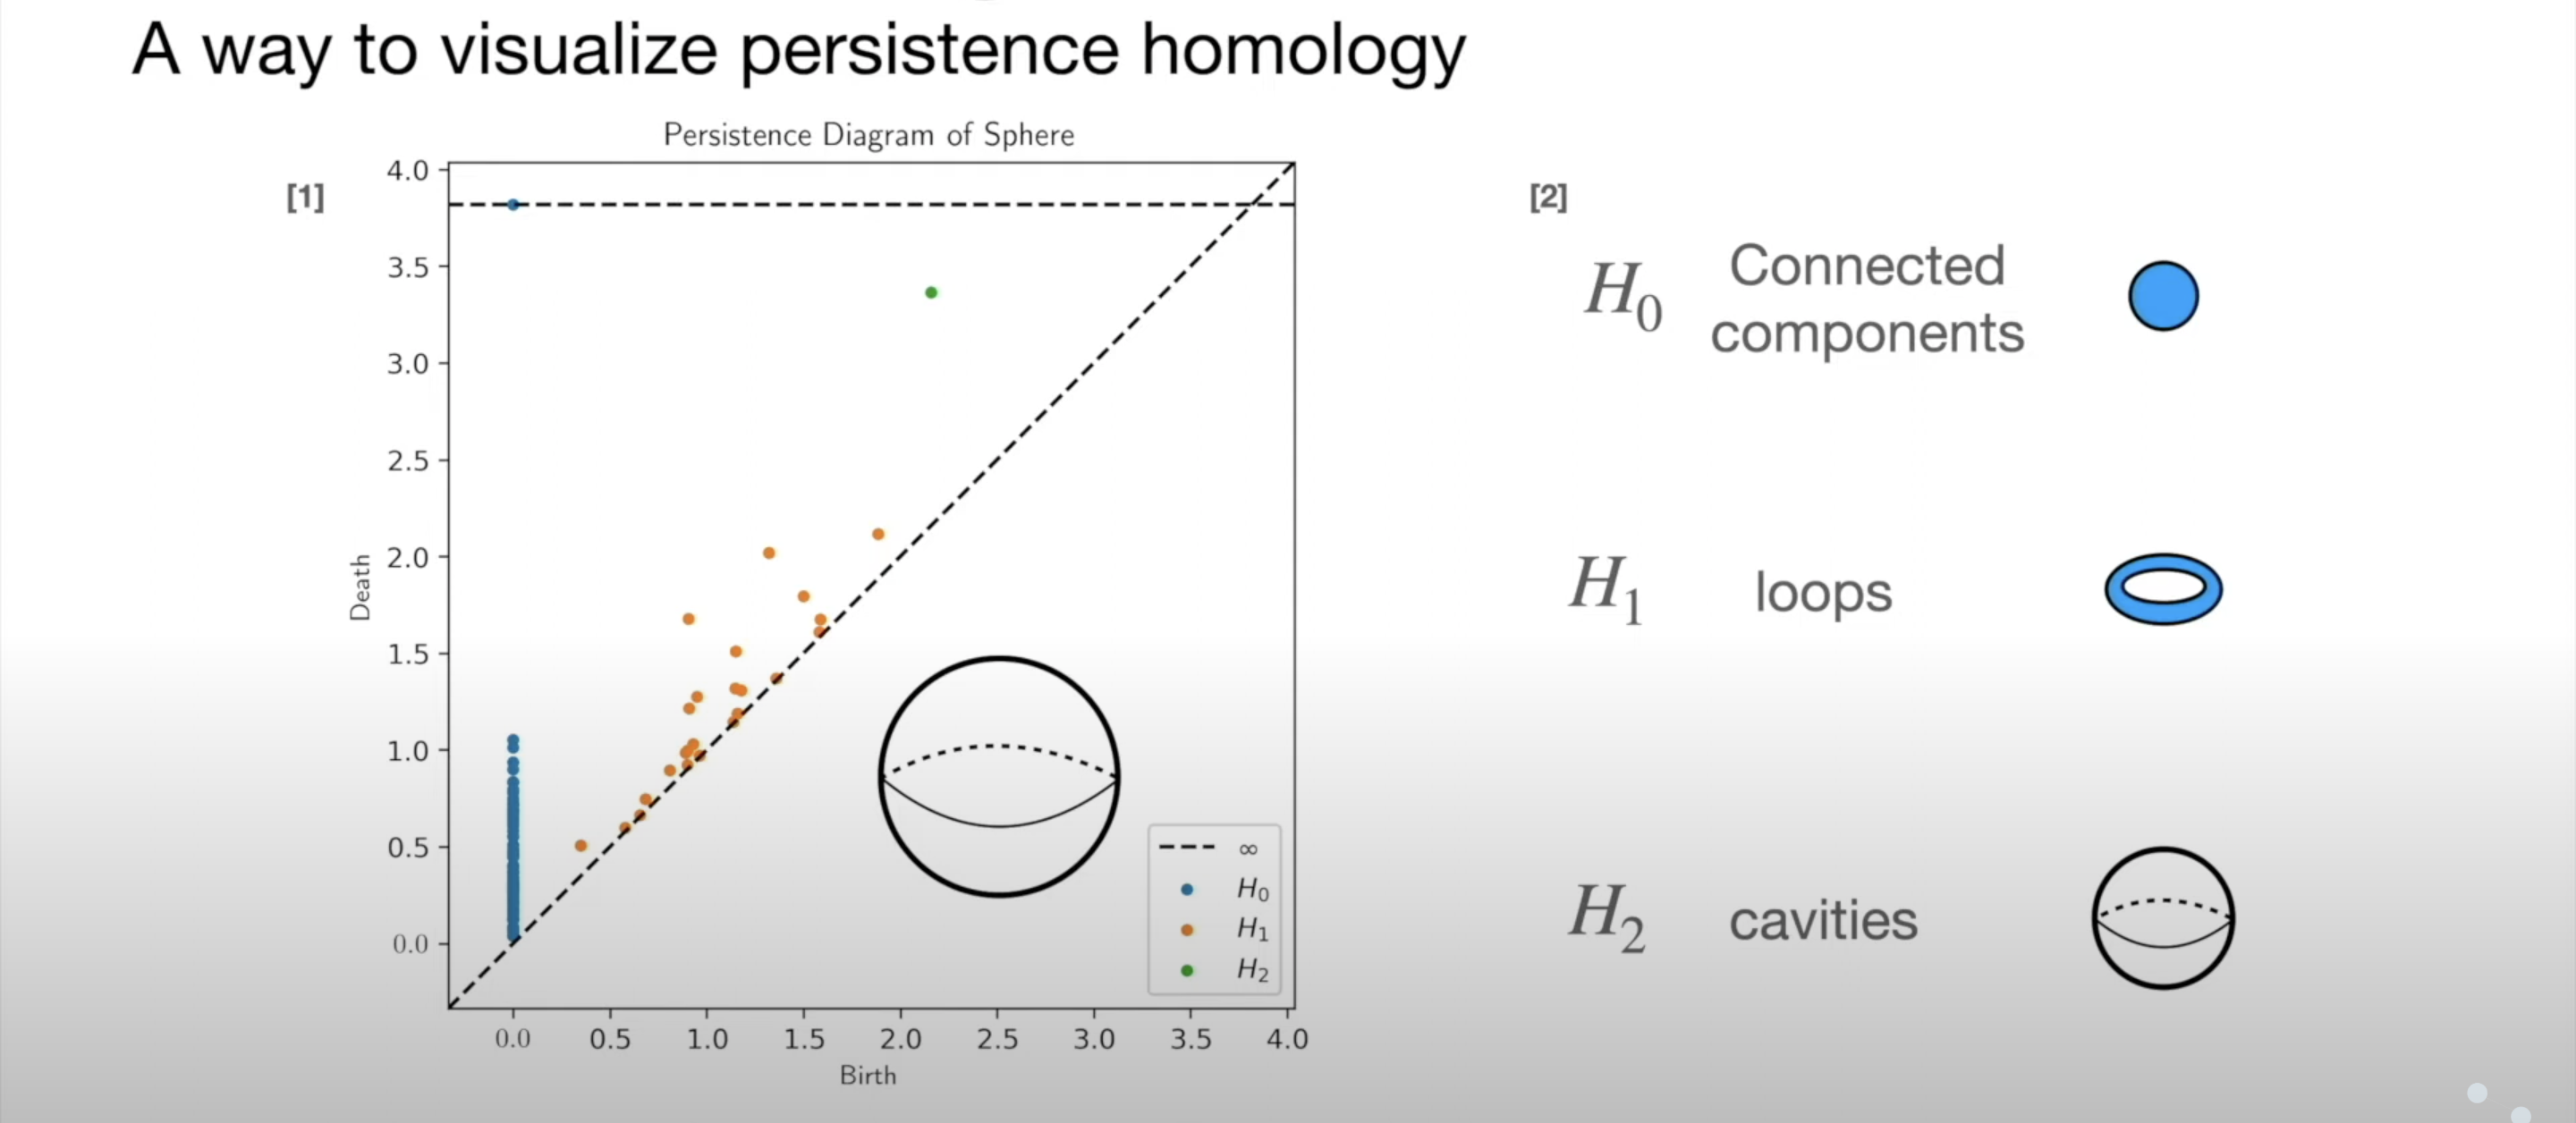 ## Example on Real Data in Python ## Further Reading - The original [Mapper paper](https://research.math.osu.edu/tgda/mapperPBG.pdf) - [Course notes](https://raphaeltinarrage.github.io/files/EMAp/SummerCourseTDA.pdf) for the 2021 EMAp summer course Topological Data Analysis with Persistent Homology - Rami Kraft's [Illustrations of Data Analysis Using the Mapper Algorithm and Persistent Homology](https://www.diva-portal.org/smash/get/diva2:900997/FULLTEXT01.pdf) - Shaw Talebi's [TDA video trilogy](https://www.youtube.com/watch?v=fpL5fMmJHqk&list=PLzERW_Obpmv_UW7RgbZW4Ebhw87BcoXc7&ab_channel=ShawTalebi) (this is a good starting point if you're confused about anything)
