Visualization for Machine Learning
Spring 2024
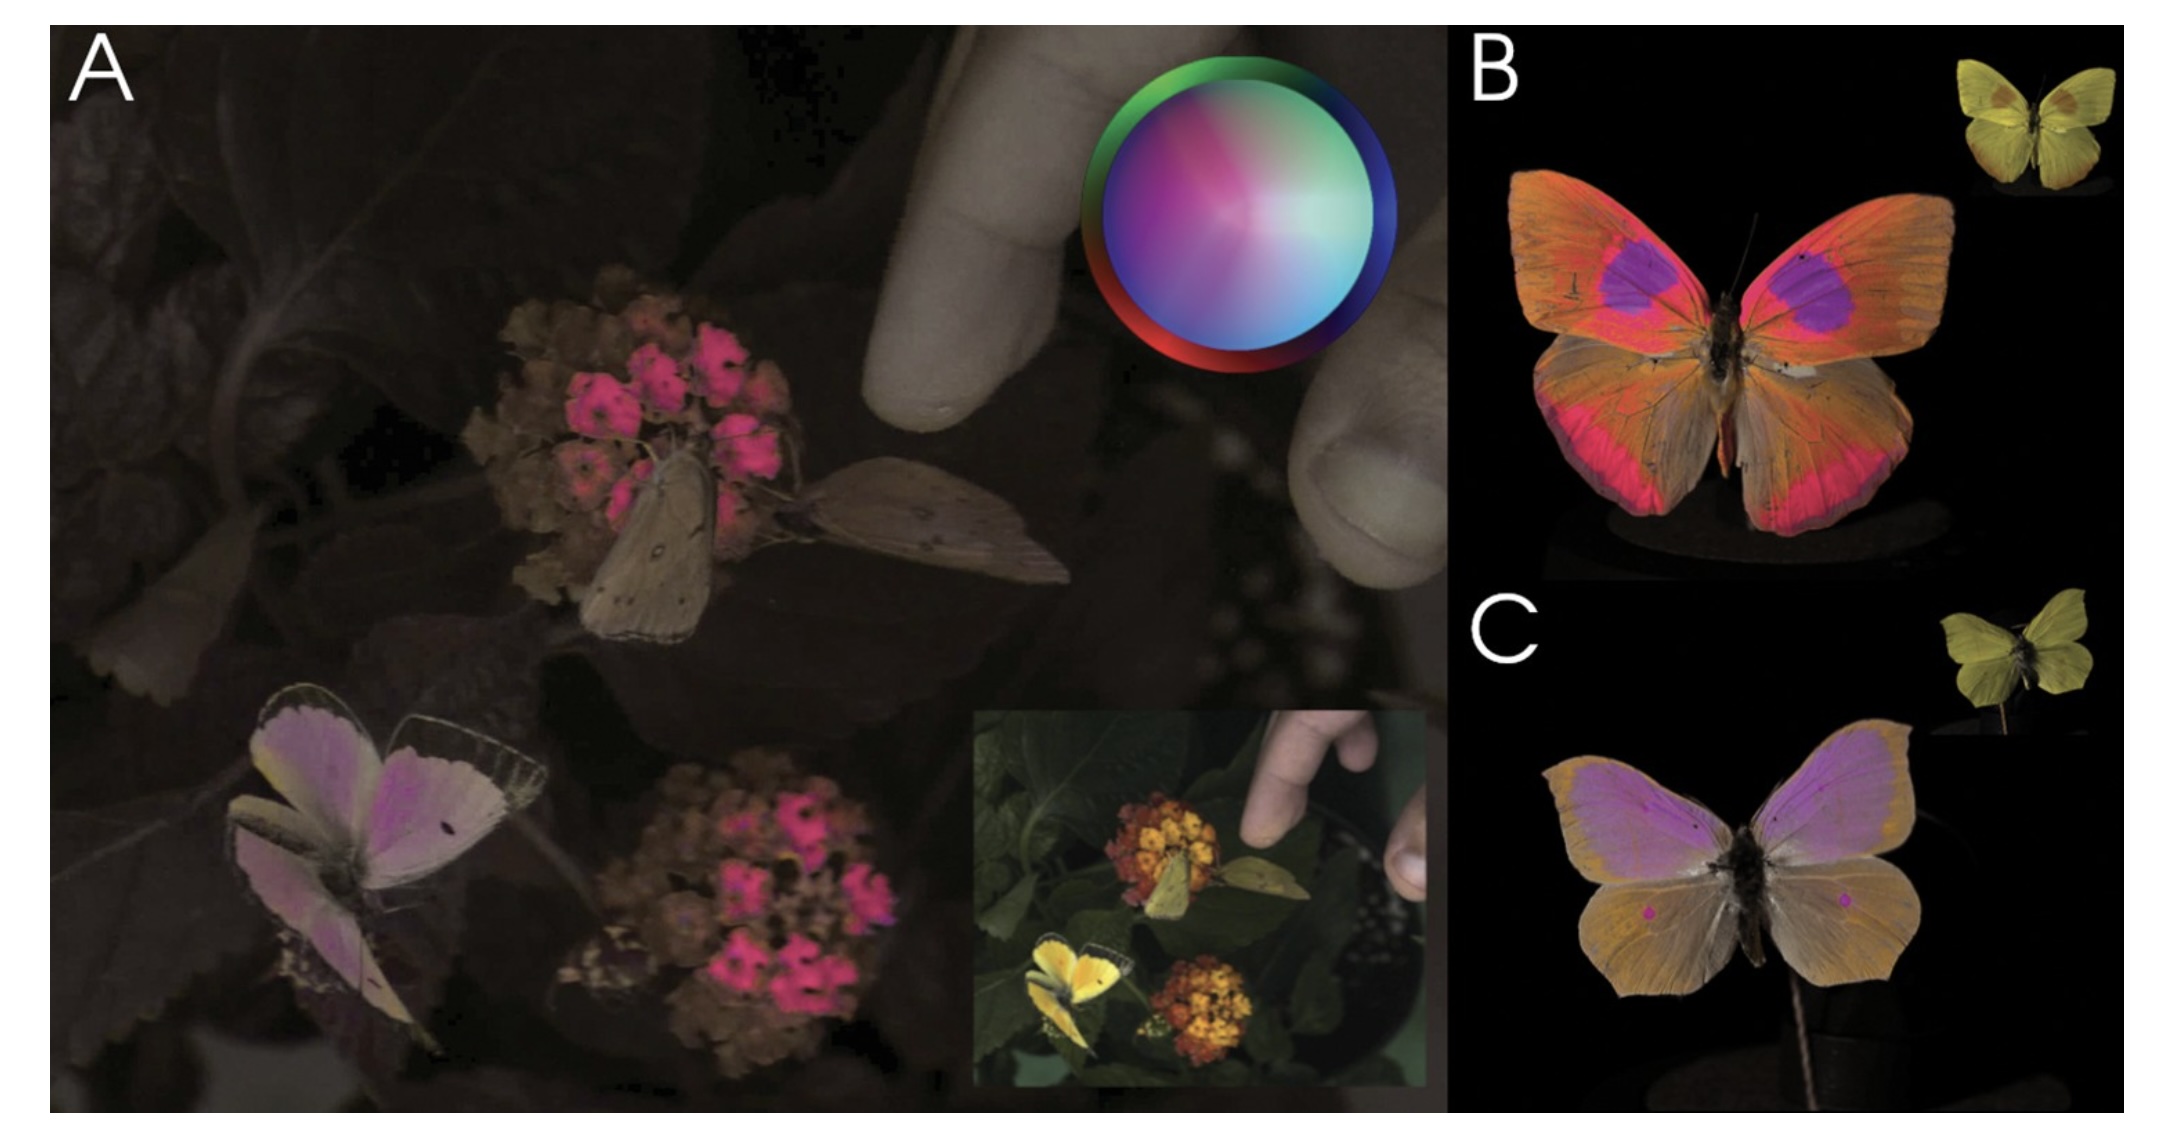
Color
![]()
Vasas et al, PLOS Biology, 2024
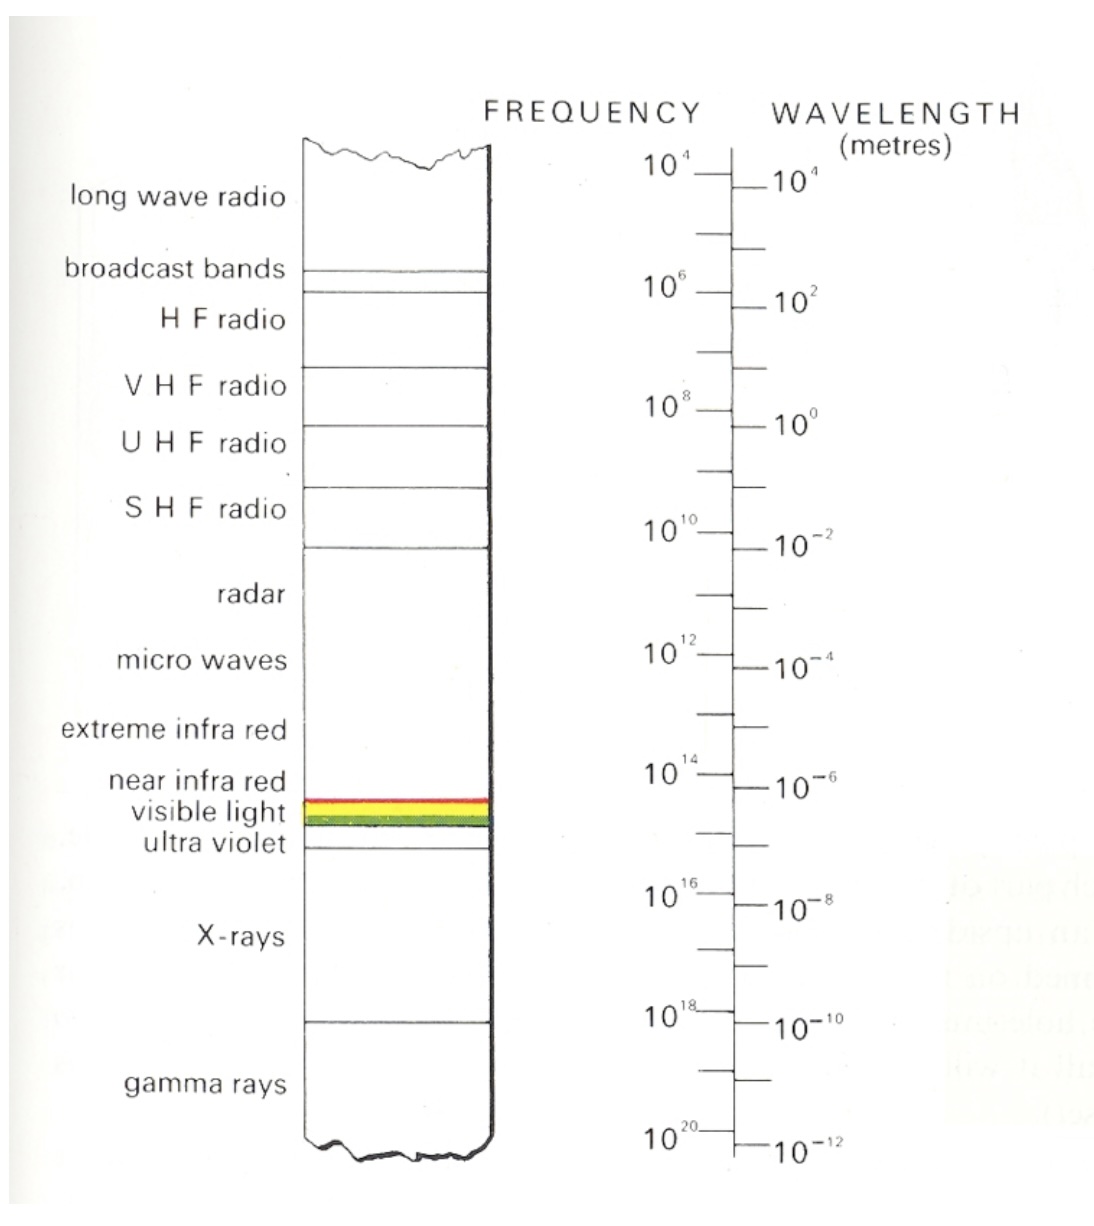
Visible Spectrum
![]()
Light
Visible range: 390-700nm
Luminance has a large dynamic range:
– 0.00003 – Moonless overcast night sky
– 30 – Sky on overcast day
– 3000 – Sky on clear day
– 16,000 – Snowy ground in full sunlight
Colors result from spectral curves
– dominant wavelength, hue
– brightness, lightness
– purity, saturation
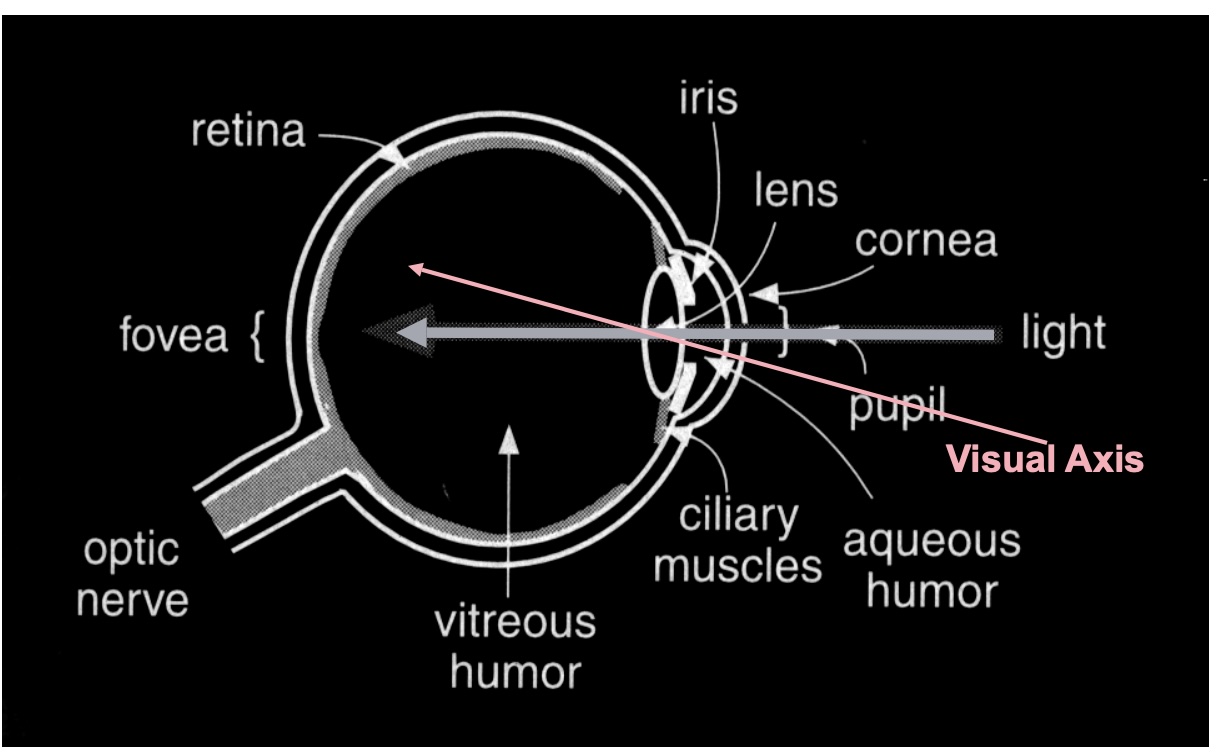
Physiology of the Eye
![]()
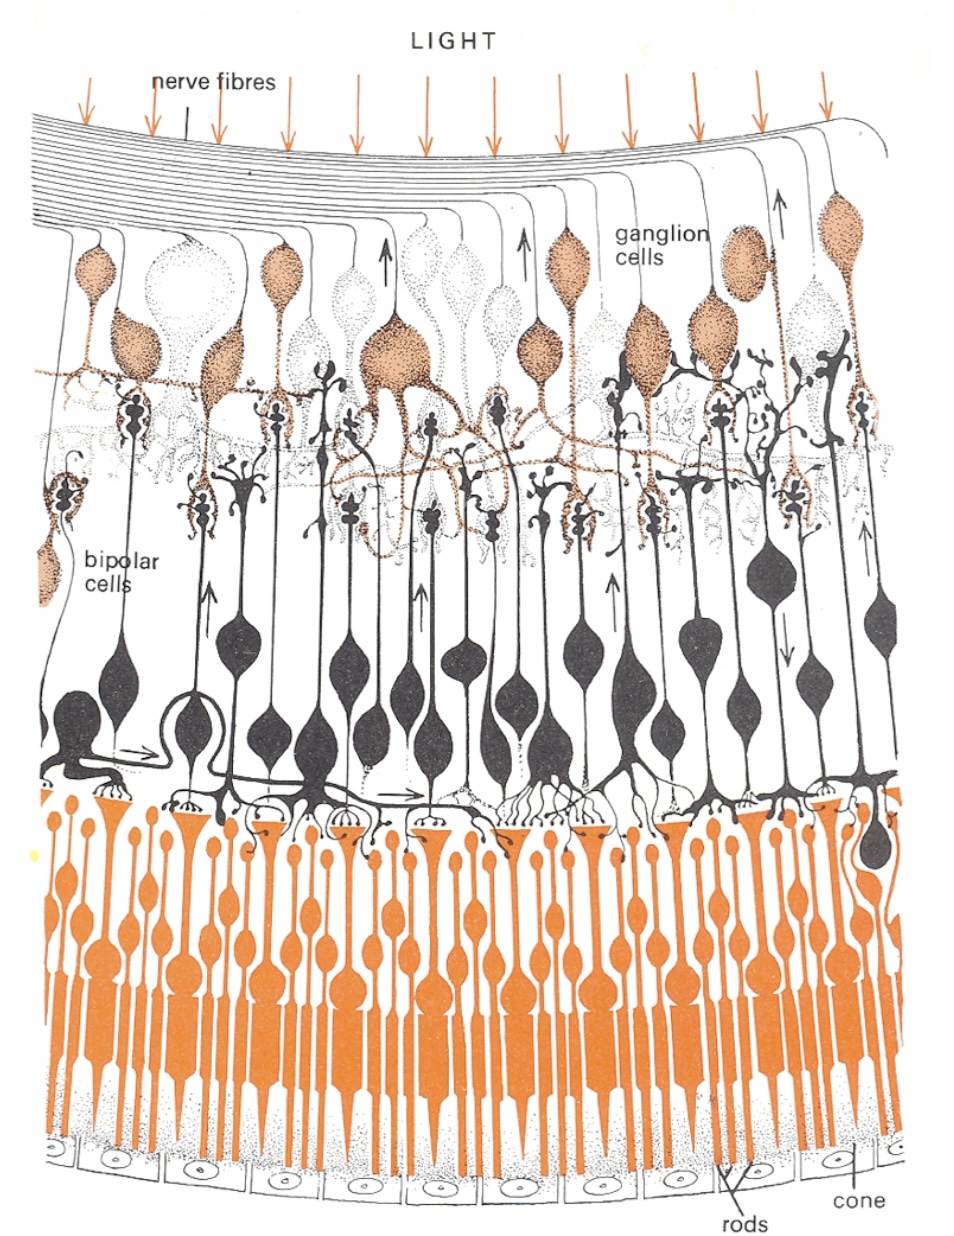
The Retina
![]()
Photoreceptors
- Discrete sensors that measure energy – Adaptation
- Rods
- active at low light levels (scotopic vision)
- only one wavelength-sensitivity function
- Cones
- active at normal light levels (photoptic)
- three types: sensitivity functions with different peaks
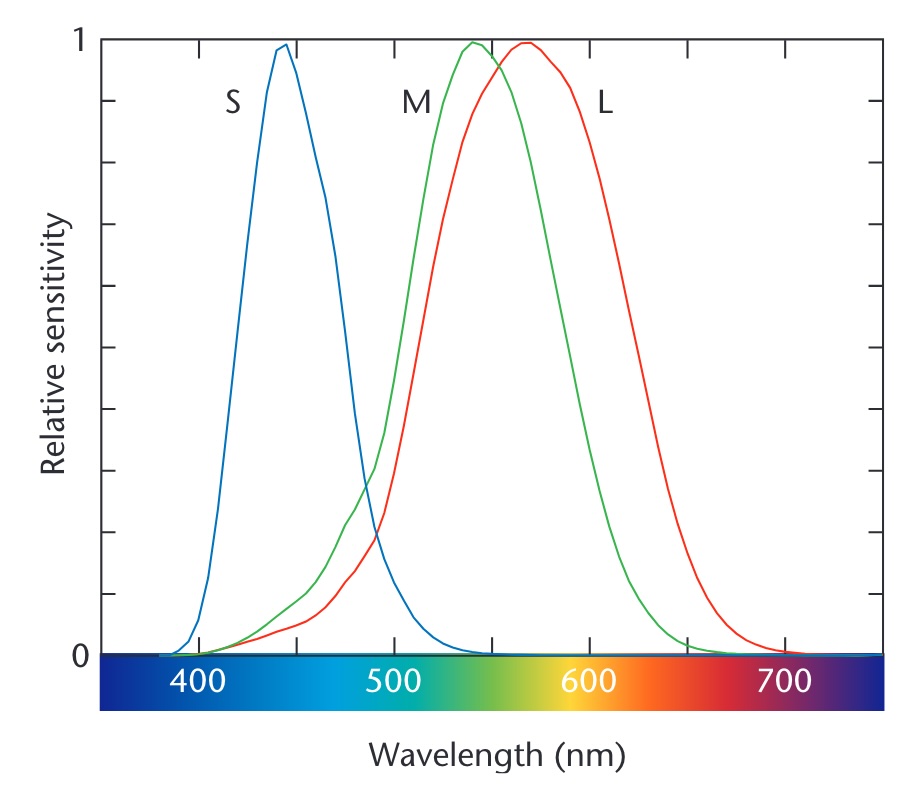
Cone Sensitivity
![]()
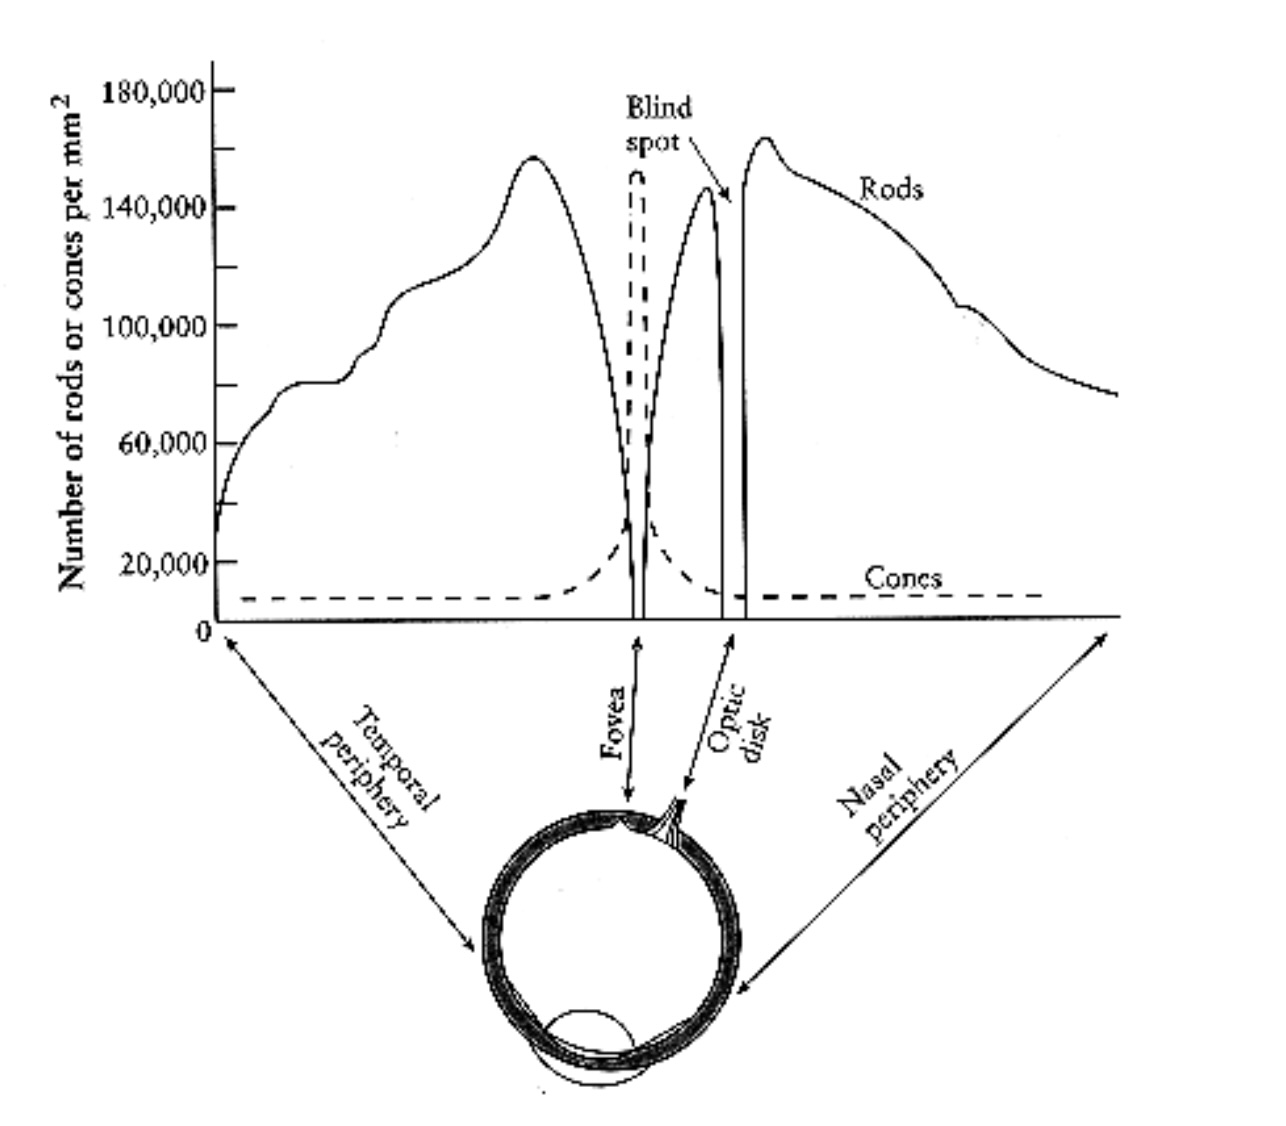
Density of Cones
![]()
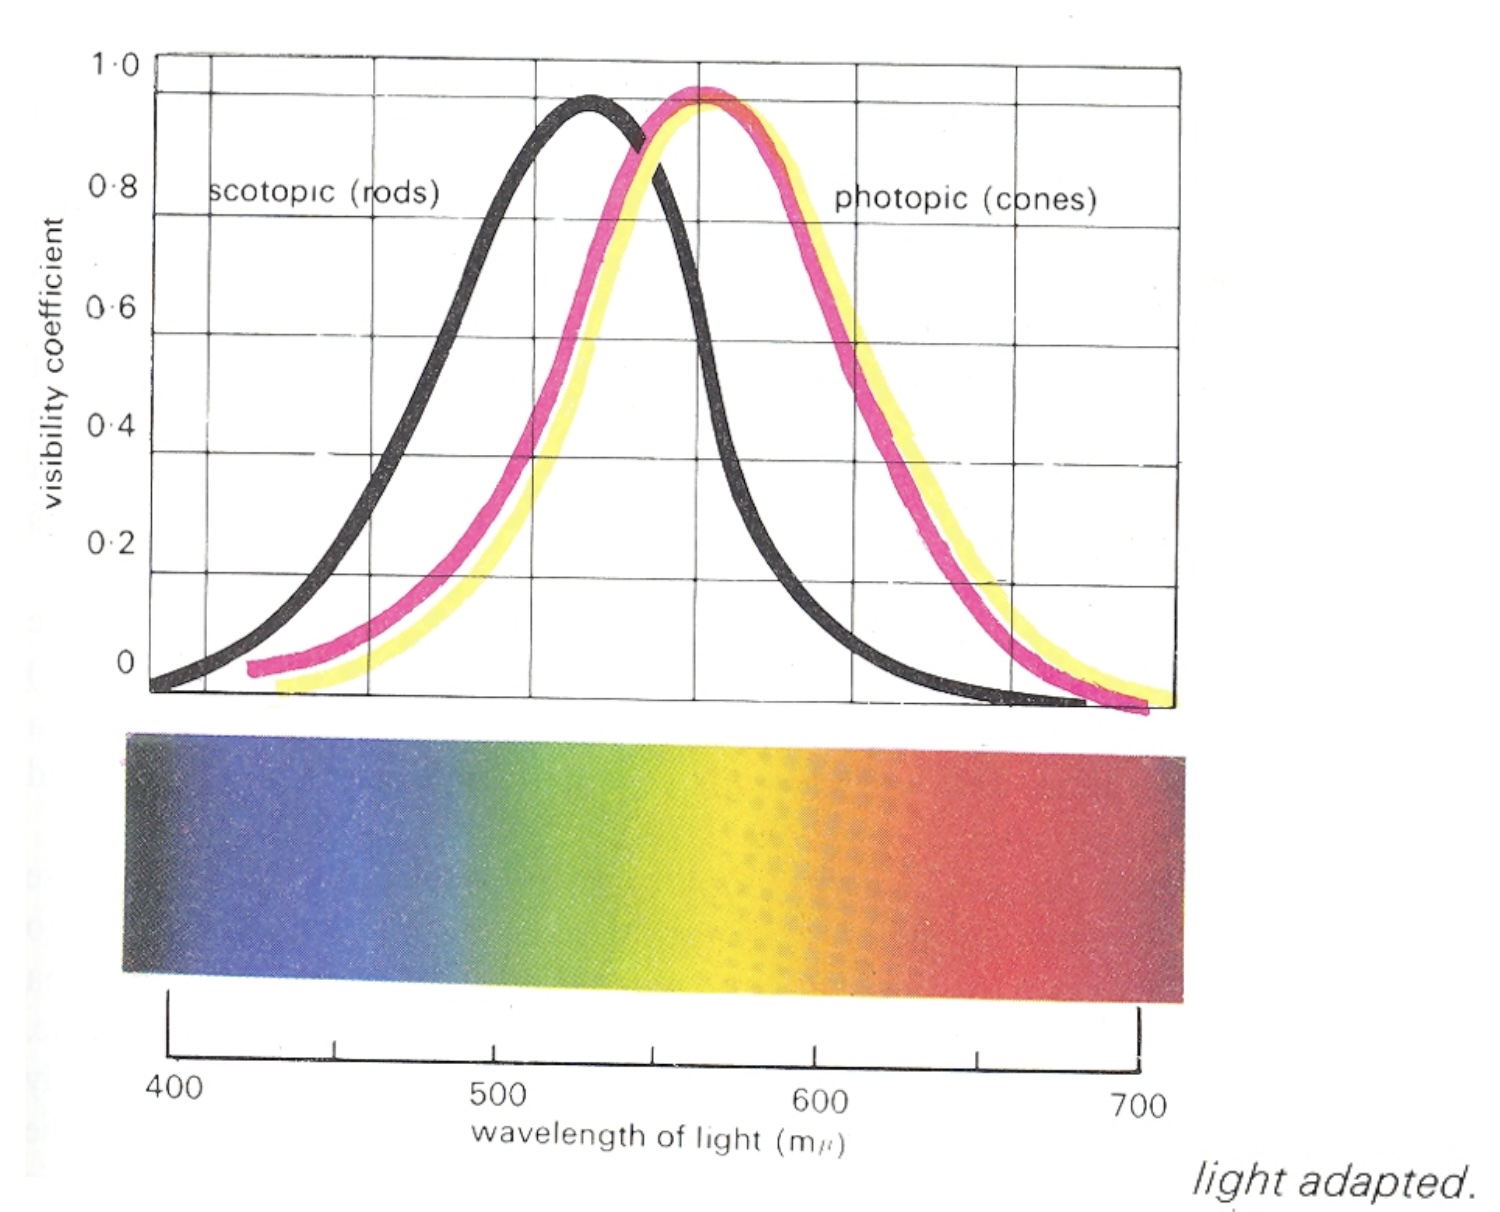
Cones and Rods
![]()
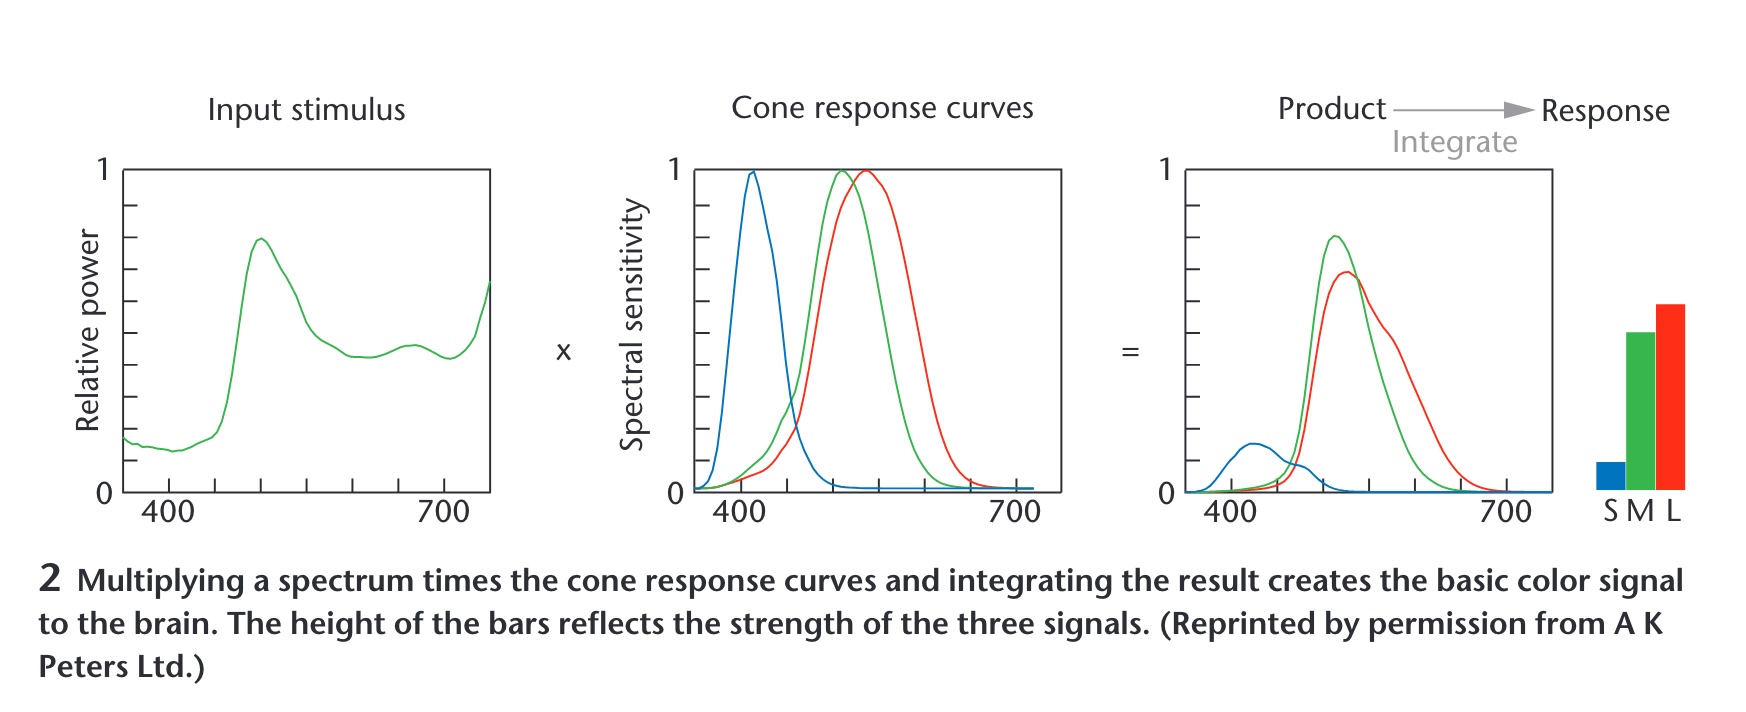
Color Stimulus
![]()
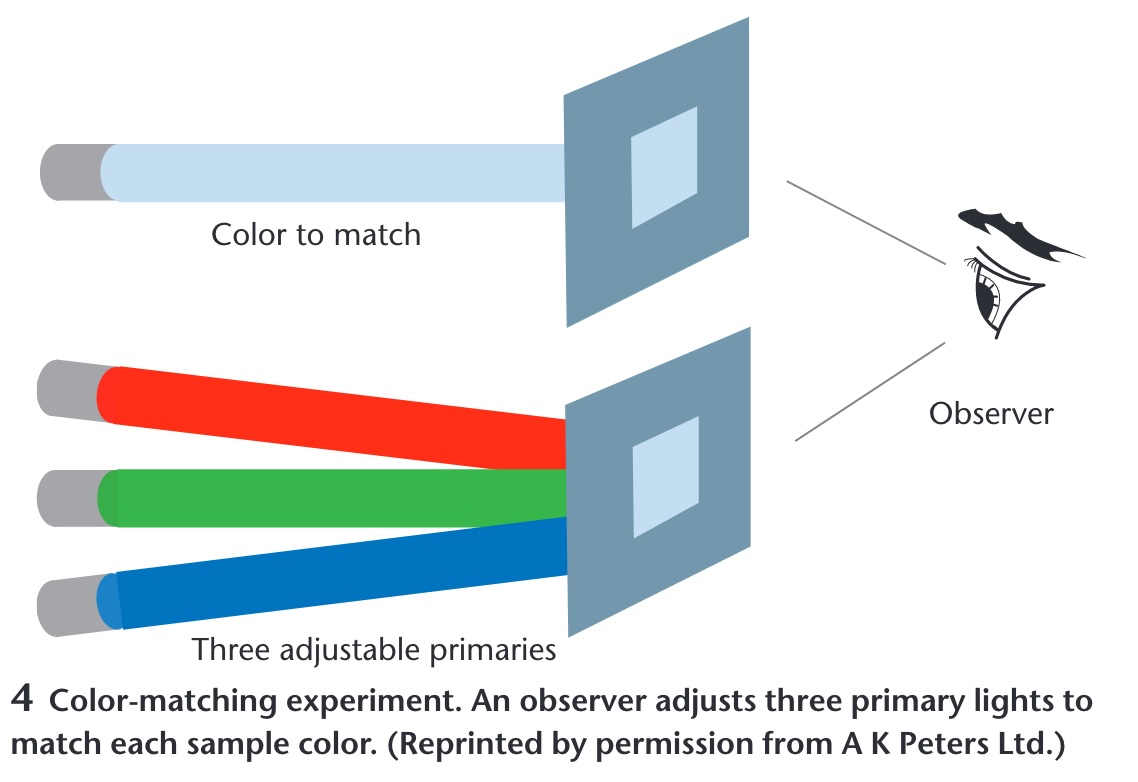
Color Matching Experiments
![]()
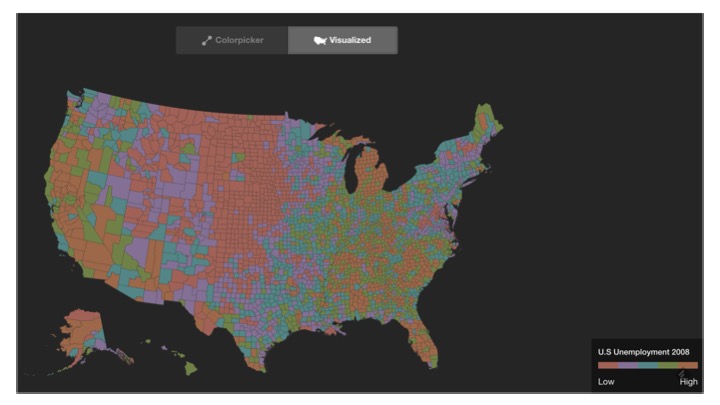
How do we use color in visualization?
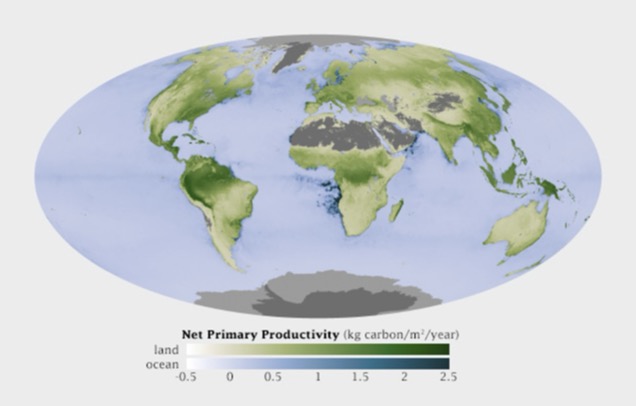
Quantify
![]()
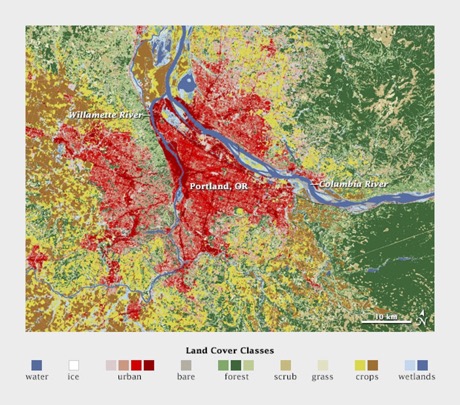
Label
![]()
Quantitative Color Scales
- Desired Properties of Quantitative Color Scale:
- Uniformity (value difference = perceived difference)
- Discriminability (as many distinct values as possible)
Quantitative Color Scales
- Desired Properties of Quantitative Color Scale:
- Uniformity (value difference = perceived difference)
- Discriminability (as many distinct values as possible)
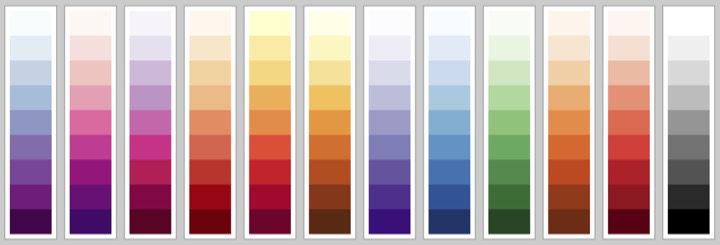
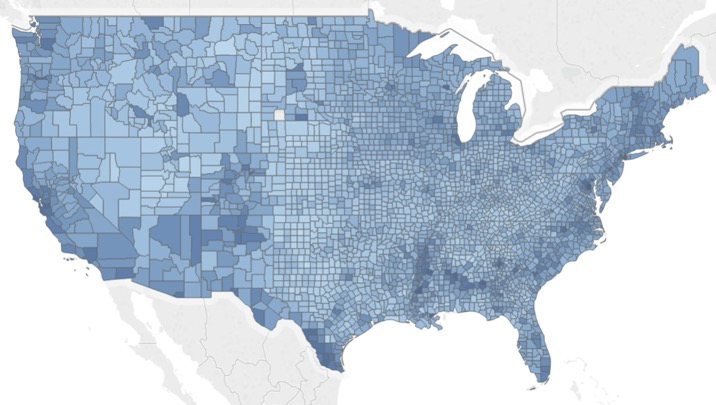
Single Hue Sequential Scales
- Choose one hue
- Map value to luminance
![]()
Categorical Color Scales
- Properties:
- Uniformity (uniform saliency / nothing stands out)
- Discriminability (as many distinct values as possible)
![]()
Categorical Color Scales
How many distinct values can one perceive?
how many can you use in a visualization?
Estimates are between 5-10 distinct codes.
Healey, Christopher G. “Choosing effective colours for data visualization.” Proceedings of IEEE Visualization’96, 1996.
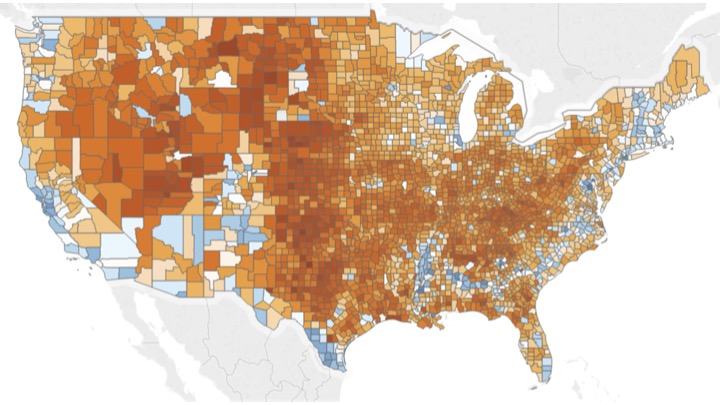
Diverging Color Scales
- Sometime useful/necessary to distinguish values above and below a threshold.
Created using these data: link
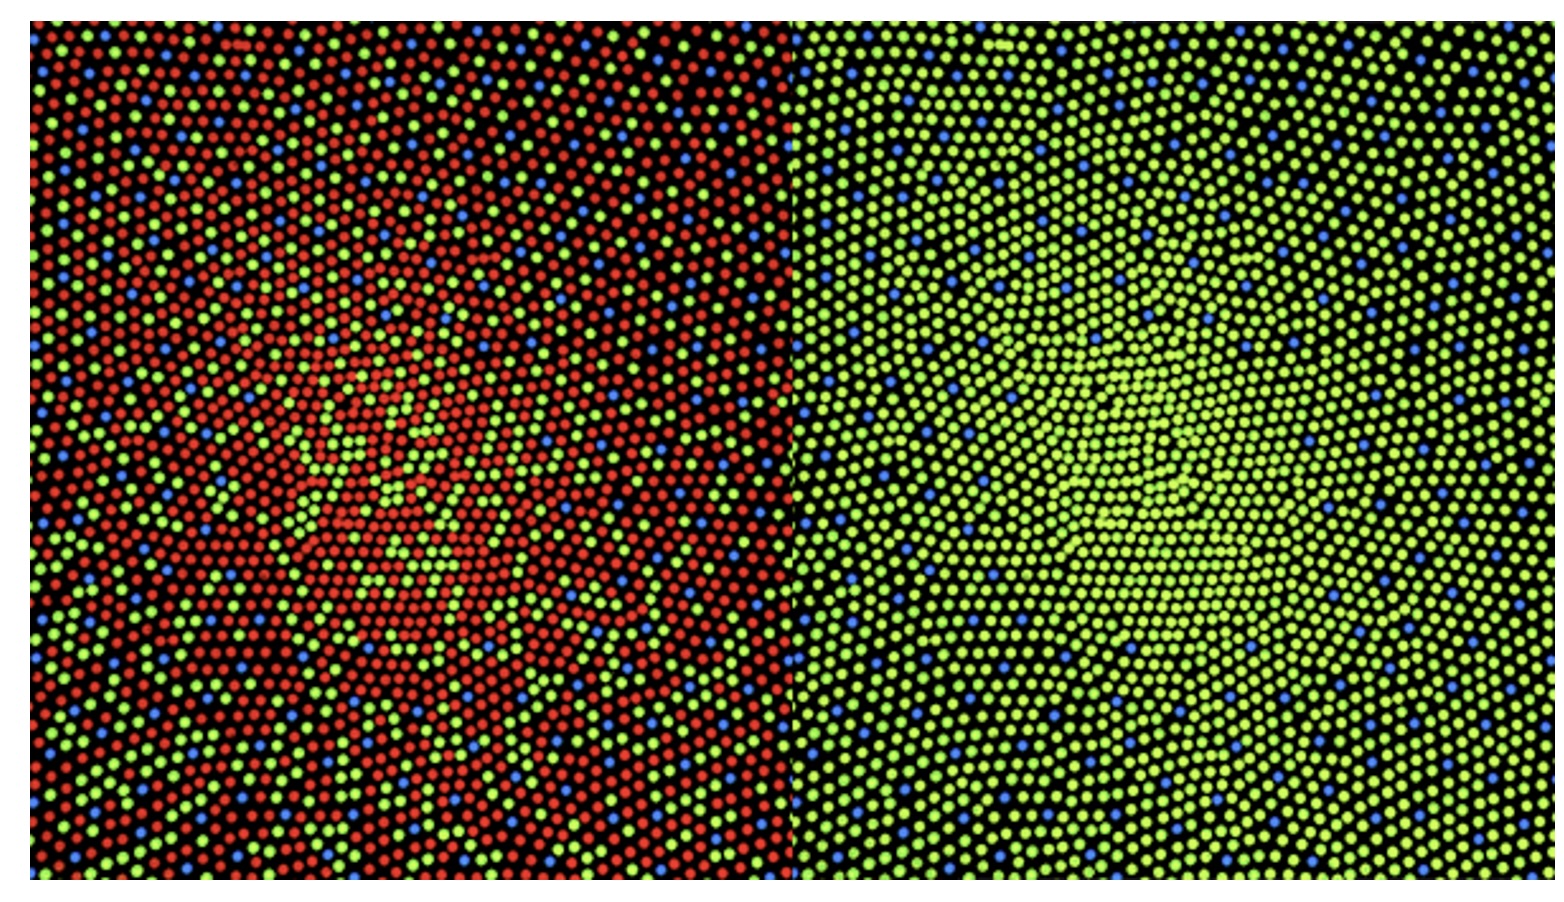
Color Blindness
- Missing or defective photoreceptors:
- 10% male and 1% female have some color deficiencies
![]()
Oliveira, Manuel. “Towards More Accessible Visualizations for Color-Vision-Deficient Individuals.” Comput. Sci. Eng., 2013.