Visualization for Machine Learning
## Teaching Staff - Instructor: Claudio Silva (csilva@nyu.edu); [webpage](https://ctsilva.github.io) - Section Leader: Erin McGowan (erin.mcgowan@nyu.edu) - Teaching Fellow: Vitoria Guardieiro (vitoria.guardieiro@nyu.edu) - Grader: Rithvik Guruprasad (rg4361@nyu.edu) ## Location Instruction Mode: In-Person Meeting Times: - DS-GA 3001.001 (Lecture) Thursdays 6:45pm-8:25pm Classroom: 31 Washington Pl (Silver Ctr) Room 520 - DS-GA 3001.002 (Lab) Fridays 10:15am-11:05am Classroom: 31 Washington Pl (Silver Ctr) Room 520 ## Discord - Class Discord: [https://discord.gg/6pFj8dMK](https://discord.gg/6pFj8dMK). - All our communications happen here. - Anything related to assignments, grading, etc., send a direct message to Grader(s). - Anything related to labs / coding contact Erin or Vitoria. - Feel free to direct message for anything else. ## Course Prerequisites - Solid programming expertise. - The coursework includes extensive programming with JavaScript and D3.js. To be covered in the labs. - We will also expect students to be able to program in Python. - Basic knowlege of machine learning. ## Course Description - Our course is based on foundations of visual analytics, which is an area of data visualization that is concerned with improving the human analytic process. - Visual analytics is concerned with combining automated processes with human-driven processes that are built around data visualization: visual representations of data, and ways to interact with data. ## Course Objectives - This course is designed to sharpen a student's knowledge of visualization. - We aim to make the student a more effective data scientist. - The course has a major project, which will help the student develop research skills. ## Course Structure - The course include lectures and labs. We will strive to have hands-on sessions to complement theoretical materials. - Starts with a short primer on visualization. - Then we will cover techniques for visualizing model assessment, white-box and black-box machine learning explainers, and dimensionality reduction. - Second half of the course has more advanced topics, including Topology Data Analysis and techniques for visualizing deep neural networks. ## Reading Material * There is no textbook for the course. * We will have suggested reading materials for each class. * Supplemental readings to be used as reference material: - Data Visualization Curriculum, Heer, [link](https://observablehq.com/@uwdata/data-visualization-curriculum) - A Course in Machine Learning, Daume, [link](http://ciml.info/dl/v0_99/ciml-v0_99-all.pdf) - Interpretable Machine Learning, Molnar, [link](https://christophm.github.io/interpretable-ml-book/) - Introduction to Machine Learning, Bernard, [link](https://www.wolfram.com/language/introduction-machine-learning/) - Deep Learning, Goodfellow et al, [link](http://www.deeplearningbook.org/) ## Research Project - Course includes a substantial research project. - Projects are expected to be pursued in groups of 2-3. - Once the group is finalized, students cannot change or separate their groups throughout the semester. ## Course Assessment * Assignments (50%) * Project Proposal (4-page writeup): 10% * Project Updates (1-page writeup): 10% * Full Project (up to 8-page writeup): 25% * Class Participation: 5% ## Late Submissions Late submissions of assignments will be penalized as follows: - A standard deduction rate of 20% per day. It means that after 5 days of being late, your assignment will have a maximum grade of 0 (zero). - You will have a one-time exception for submitting assignments late (up to 5 days late). ## Academic Integrity - All students are expected to do their own work. - See detailed policy on class syllabus. - Also, here is a [link to the GSAS statement on Academic Integrity](https://gsas.nyu.edu/about-gsas/policies-and-procedures/gsas-statement-on-academic-integrity.html). ## AI policy - You can use generative AI tools to do the assignments in this class. - If you use an AI to guide you in completing an assignment, you have to disclose which parts were generated by the AI. ## NYU Academic Calendar - [link to NYU Academic Calendar](https://www.nyu.edu/students/student-information-and-resources/registration-records-and-graduation/academic-calendar.html?semester=Spring%202024) - This course does not have a final exam, but there will be a final project presentation. - Also, please pay attention to notable dates such as Add/Drop, Withdrawal, etc. ## End of Course Logistics * Any questions? ## BREAK -- 5 minutes ## Self Introduction for VisML 2024 [slides](https://docs.google.com/presentation/d/1lmbWUSjxR45gdMqda9ZYeRVOvpnxB73qAFdEcAFfPoU/edit?usp=sharing) ## What is Information Visualization? Why Use It? ::: columns ::: {.column width="50%"} “The use of computer-supported, interactive, visual representations of abstract data to amplify cognition.” ::: ::: {.column width="40%"}  ::: ::: ::: footer Slides based on material from Prof. Enrico Bertini ::: ## Key Concepts * Computer-Based * Visual Representation * Abstract Data * Interactive * Amplify Cognition ::: footer Slides based on material from Prof. Enrico Bertini ::: ## Abstract Data ::: columns ::: {.column width="50%"} Data with no obvious/natural visual representation ::: ::: {.column width="50%"} 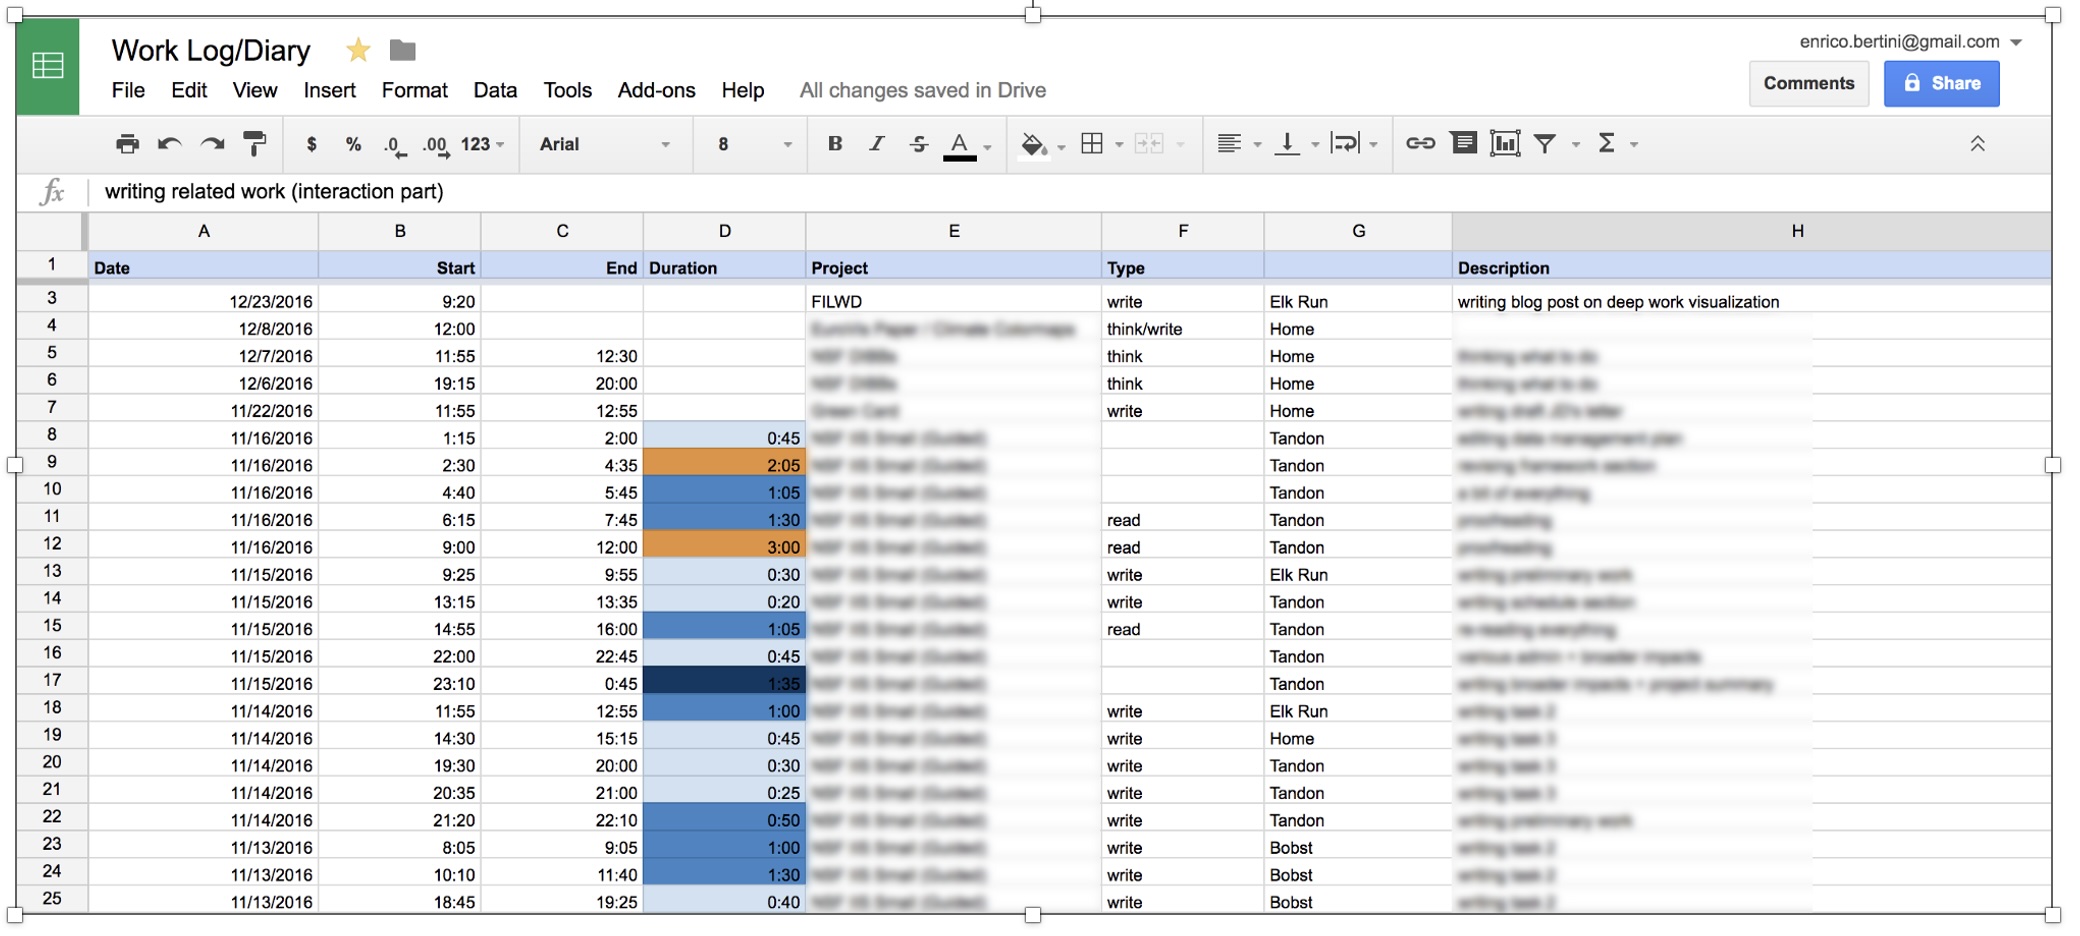 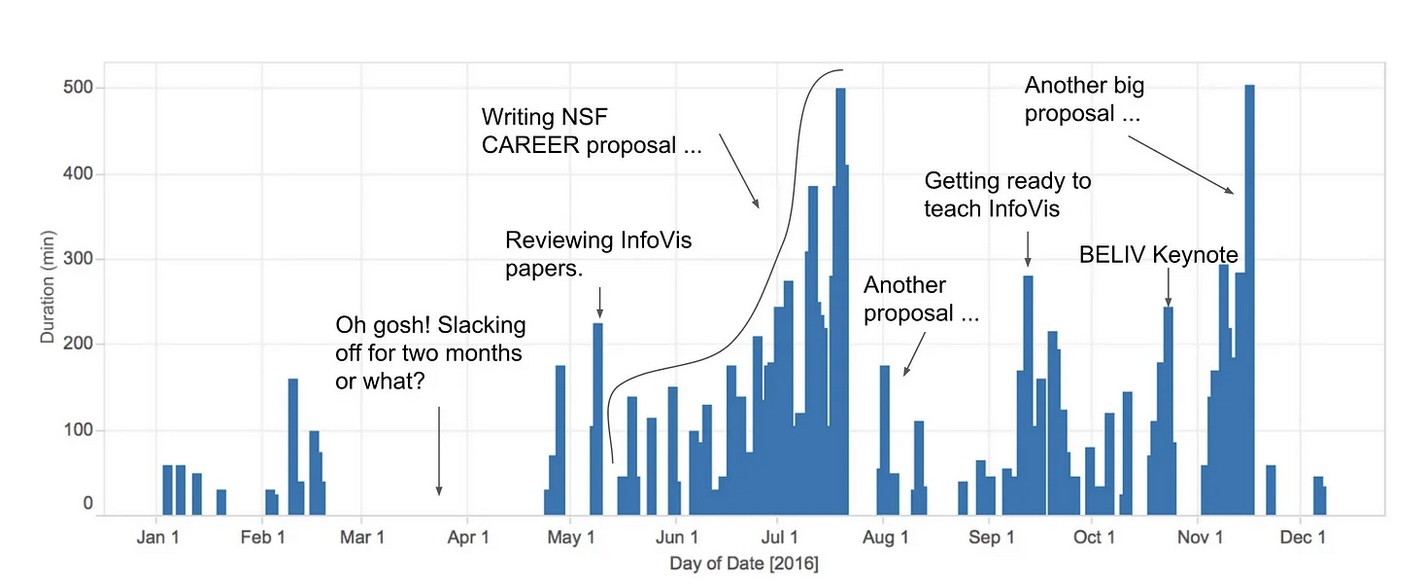 ::: ::: ::: footer Slides based on material from Prof. Enrico Bertini ::: ## Abstract Data ::: columns ::: {.column width="50%"} Data with no obvious/natural visual representation ::: ::: {.column width="40%"} 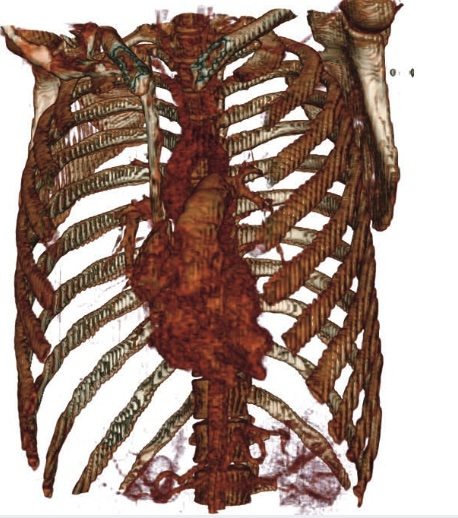 ::: ::: ::: footer Slides based on material from Prof. Enrico Bertini ::: ## Interactive Users can change what is visualized and how it is visualized. ::: footer Slides based on material from Prof. Enrico Bertini ::: --- ## Amplify Cognition ::: incremental * Solve problems with data with less effort, in a shorter time, and more accurately. * … or even be able to do things it would be impossible to do without a computer and a graphical representation. ::: ::: footer Slides based on material from Prof. Enrico Bertini ::: ## Cognitive artifacts: tools that help us think! ::: incremental * Try to multiply 34 x 72 using exclusively your mind ... * … now do it again using pen and paper. ::: ::: footer Slides based on material from Prof. Enrico Bertini ::: ## Why is it easier? ::: incremental * … because we can store intermediary results in the paper rather than keeping the information in mind. That is, part of the memory is in the world rather than in your head. ::: ::: footer Slides based on material from Prof. Enrico Bertini ::: ## Let’s play the “game of 15” ... ::: incremental * The "pieces" for the game are the nine digits: 1, 2, 3, 4, 5, 6, 7, 8, 9. Each player takes a digit in turn. Once a digit is taken, it cannot be used by the other player. The first player to get three digits that sum to 15 wins. * Here is a sample game: Player A takes 8. Player B takes 2. Then A takes 4, and B takes 3. A takes 5. * Question 1: Suppose you are now to step in and play for B. What move would you make? ::: ::: footer Slides based on material from Prof. Enrico Bertini ::: ## Now let's play a different game: tic-tac-toe ::: columns ::: {.column width="70%"} Players alternately place a naught (O) or a cross (X) in one of nine spaces arranged in a rectangular array. Once a space has been taken, it cannot be changed by either player. The first player to get three symbols in a straight line wins. Suppose player A is X and B is O, and the game has reached the state on the right. Question 2: Suppose you are now to step in and play an O for B. What move would you make? ::: ::: {.column width="20%"}  ::: ::: ::: footer Slides based on material from Prof. Enrico Bertini ::: ## Problem Isomorphs (Herbert Simon) ::: incremental * The two problems are equivalent! ::: ::: footer Slides based on material from Prof. Enrico Bertini ::: ## Why use visualization? * Explanatory * Exploratory * Confirmatory ::: footer Slides based on material from Prof. Enrico Bertini ::: ## Why use a graphical representation? * Large parts of our brain are devoted to spatial processing ::: footer Slides based on material from Prof. Enrico Bertini ::: ## Why use a computer to visualize data? ::: footer Slides based on material from Prof. Enrico Bertini ::: ## Why use interaction? * Each visualization can only answer a subset of questions. * With interaction the user can change what is visualized and how to answer a multitude of questions. * Also one cannot visualize everything at once. ::: footer Slides based on material from Prof. Enrico Bertini ::: ## How do you assess the quality of a visualization? * Isn’t it subjective? Some people like A, whereas some others like B. ::: incremental * Some visual representations are better than others at solving particular problems ... ::: ::: footer Slides based on material from Prof. Enrico Bertini ::: ## Designing effective visualizations requires ::: incremental * Knowing the design space * Being able to compare the solutions * … in turn comparing the solutions requires understanding human perception. ::: ::: footer Slides based on material from Prof. Enrico Bertini ::: ---
