
Visualization for Machine Learning
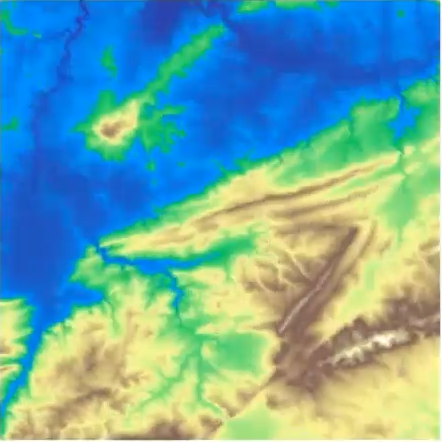
What is a peak?
\ 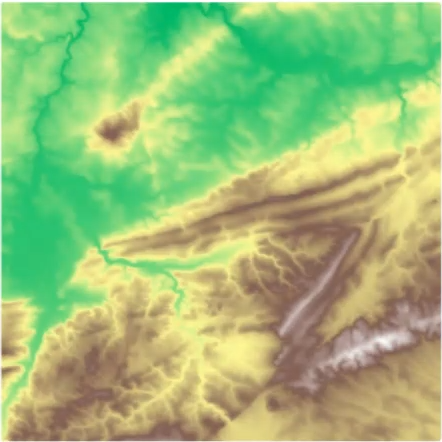{fig-align="center"} :::footer Slides based on Vincent Divol's [CDS Lunch Seminar](https://cds.nyu.edu/data-science-lunch-seminar-series/) presentation ::: ## First Example - MapWhat is a peak?
First idea: Using local maximum
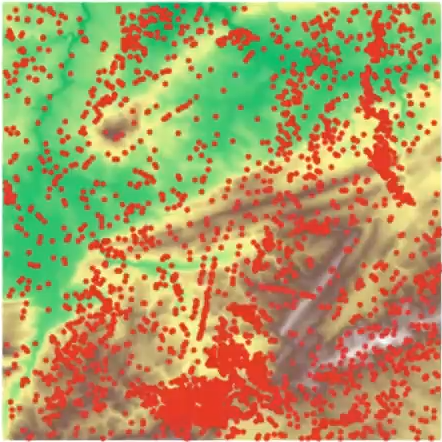{fig-align="center"} :::footer Slides based on Vincent Divol's [CDS Lunch Seminar](https://cds.nyu.edu/data-science-lunch-seminar-series/) presentation ::: ## First Example - MapWhat is a peak?
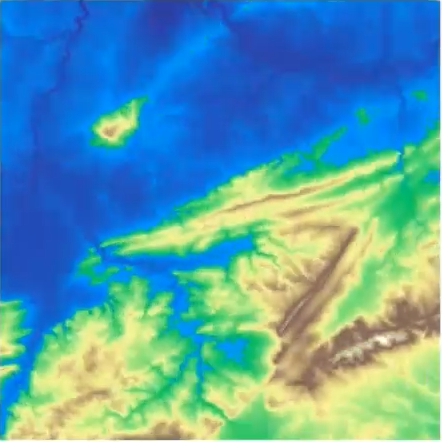
Second idea: flooding
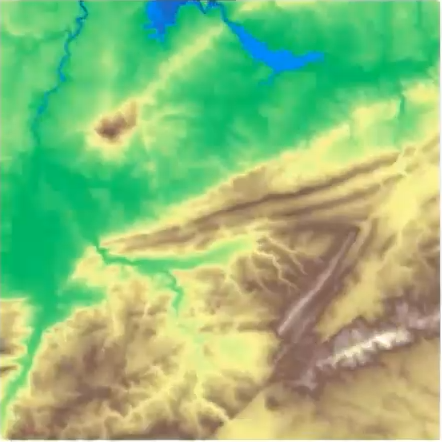{fig-align="center"} :::footer Slides based on Vincent Divol's [CDS Lunch Seminar](https://cds.nyu.edu/data-science-lunch-seminar-series/) presentation ::: ## First Example - MapWhat is a peak?
Second idea: flooding
{fig-align="center"} :::footer Slides based on Vincent Divol's [CDS Lunch Seminar](https://cds.nyu.edu/data-science-lunch-seminar-series/) presentation ::: ## First Example - MapWhat is a peak?
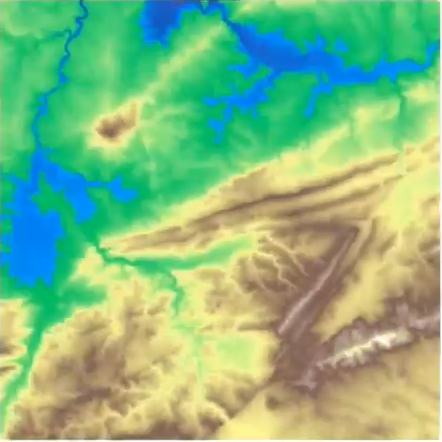
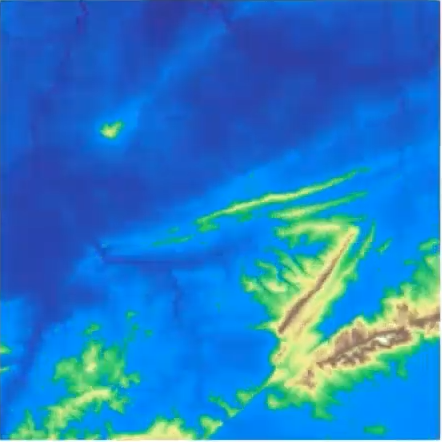
Second idea: flooding
{fig-align="center"} :::footer Slides based on Vincent Divol's [CDS Lunch Seminar](https://cds.nyu.edu/data-science-lunch-seminar-series/) presentation ::: ## First Example - MapWhat is a peak?
Second idea: flooding
{fig-align="center"} :::footer Slides based on Vincent Divol's [CDS Lunch Seminar](https://cds.nyu.edu/data-science-lunch-seminar-series/) presentation ::: ## First Example - MapWhat is a peak?
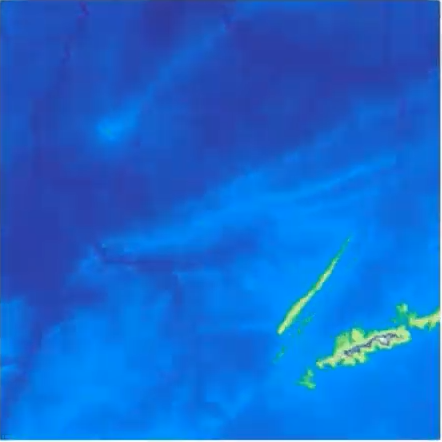
Second idea: flooding
{fig-align="center"} :::footer Slides based on Vincent Divol's [CDS Lunch Seminar](https://cds.nyu.edu/data-science-lunch-seminar-series/) presentation ::: ## First Example - MapWhat is a peak?
Second idea: flooding
{fig-align="center"} :::footer Slides based on Vincent Divol's [CDS Lunch Seminar](https://cds.nyu.edu/data-science-lunch-seminar-series/) presentation ::: ## First Example - MapWhat is a peak?
Second idea: flooding
{fig-align="center"} :::footer Slides based on Vincent Divol's [CDS Lunch Seminar](https://cds.nyu.edu/data-science-lunch-seminar-series/) presentation ::: ## First Example - MapThe island $I$ appears at sea level $b$ (its **birth time**)...
\ 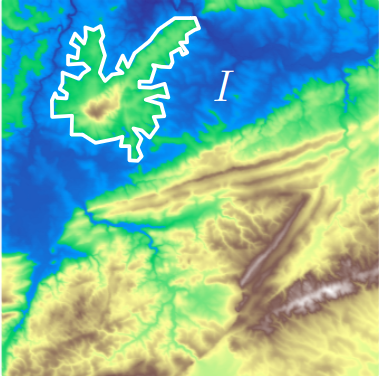{fig-align="center"} :::footer Slides based on Vincent Divol's [CDS Lunch Seminar](https://cds.nyu.edu/data-science-lunch-seminar-series/) presentation ::: ## First Example - MapThe island $I$ appears at sea level $b$ (its **birth time**)...
and disapears at seas level $d$ (its **death time**) at local maximum $x$.
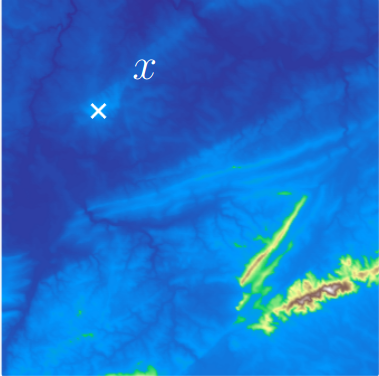{fig-align="center"}The point $x$ is a peak if the **persistence**$:= d-b$ of the island $I$ is larger than $91$m (=$300$ft).
:::footer Slides based on Vincent Divol's [CDS Lunch Seminar](https://cds.nyu.edu/data-science-lunch-seminar-series/) presentation ::: ## First Example - Map 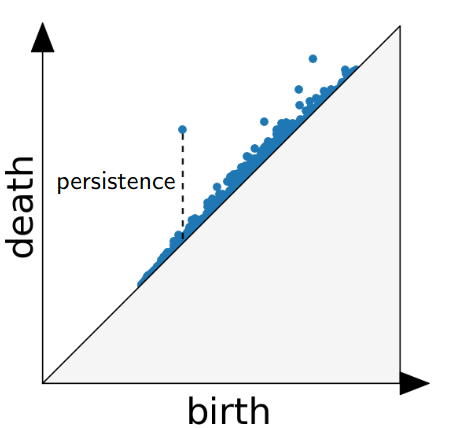{fig-align="center"} The persistence diagram (PD) of the elevation function is the collection of the points $(b,d)$, where $(b,d)$ corresponds to the birth/death of an island. :::footer Slides based on Vincent Divol's [CDS Lunch Seminar](https://cds.nyu.edu/data-science-lunch-seminar-series/) presentation ::: ## First Example - Map 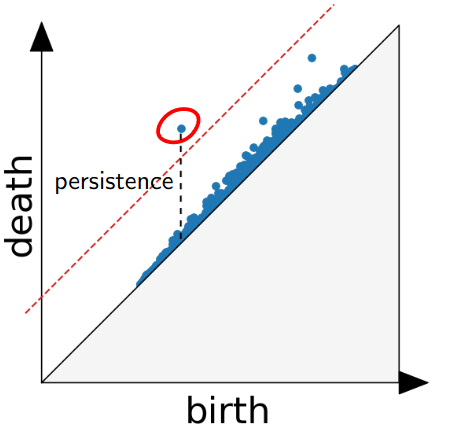{fig-align="center"} The persistence diagram (PD) of the elevation function is the collection of the points $(b,d)$, where $(b,d)$ corresponds to the birth/death of an island. :::footer Slides based on Vincent Divol's [CDS Lunch Seminar](https://cds.nyu.edu/data-science-lunch-seminar-series/) presentation ::: ## Second Example 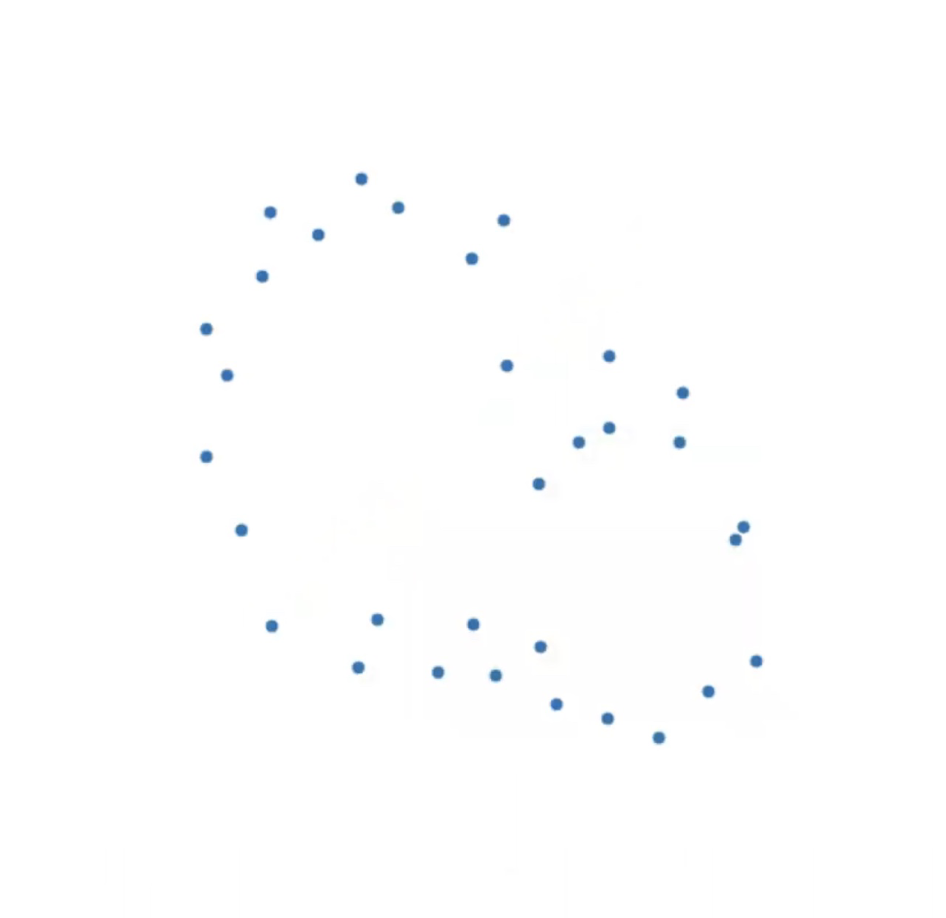{fig-align="center"} :::footer Slides based on Vincent Divol's [CDS Lunch Seminar](https://cds.nyu.edu/data-science-lunch-seminar-series/) presentation ::: ## Second Example {fig-align="center"} :::footer Slides based on Vincent Divol's [CDS Lunch Seminar](https://cds.nyu.edu/data-science-lunch-seminar-series/) presentation ::: ## Second Example {fig-align="center"} :::footer Slides based on Vincent Divol's [CDS Lunch Seminar](https://cds.nyu.edu/data-science-lunch-seminar-series/) presentation ::: ## Second Example {fig-align="center"} :::footer Slides based on Vincent Divol's [CDS Lunch Seminar](https://cds.nyu.edu/data-science-lunch-seminar-series/) presentation ::: ## Second Example {fig-align="center"} :::footer Slides based on Vincent Divol's [CDS Lunch Seminar](https://cds.nyu.edu/data-science-lunch-seminar-series/) presentation ::: ## Second Example {fig-align="center"} :::footer Slides based on Vincent Divol's [CDS Lunch Seminar](https://cds.nyu.edu/data-science-lunch-seminar-series/) presentation ::: ## Second Example {fig-align="center"} :::footer Slides based on Vincent Divol's [CDS Lunch Seminar](https://cds.nyu.edu/data-science-lunch-seminar-series/) presentation ::: ## Second Example {fig-align="center"} :::footer Slides based on Vincent Divol's [CDS Lunch Seminar](https://cds.nyu.edu/data-science-lunch-seminar-series/) presentation ::: ## Second Example 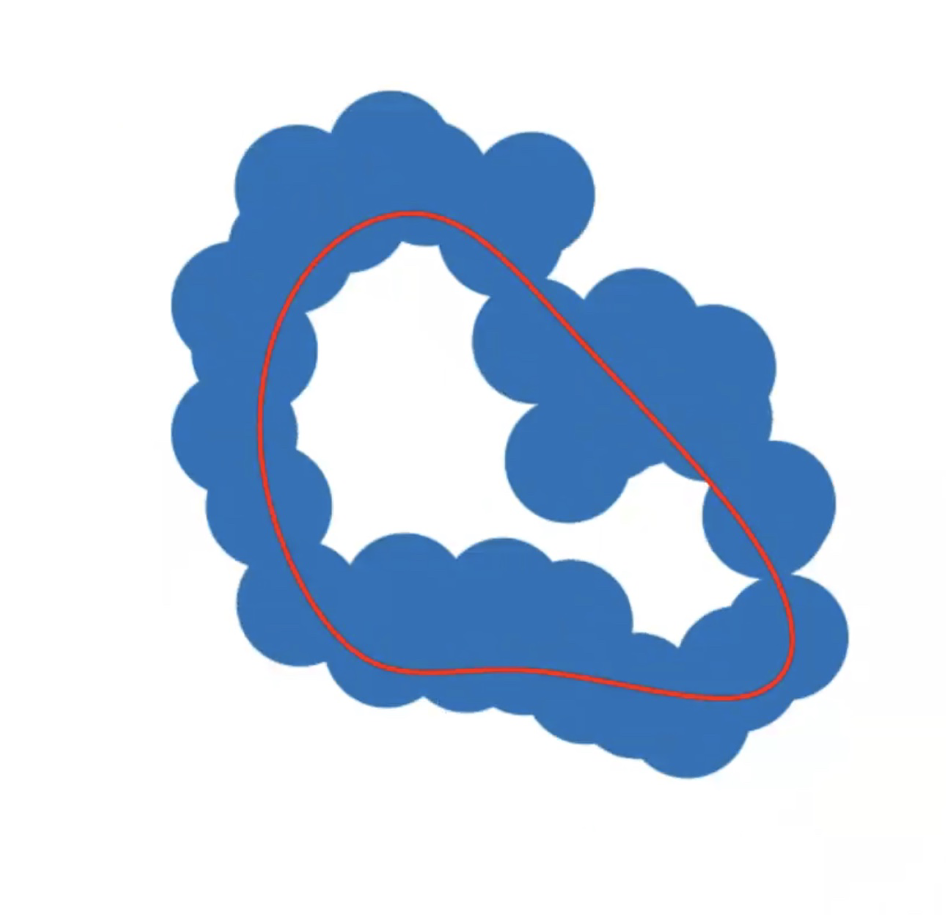{fig-align="center"} :::footer Slides based on Vincent Divol's [CDS Lunch Seminar](https://cds.nyu.edu/data-science-lunch-seminar-series/) presentation ::: ## Second Example 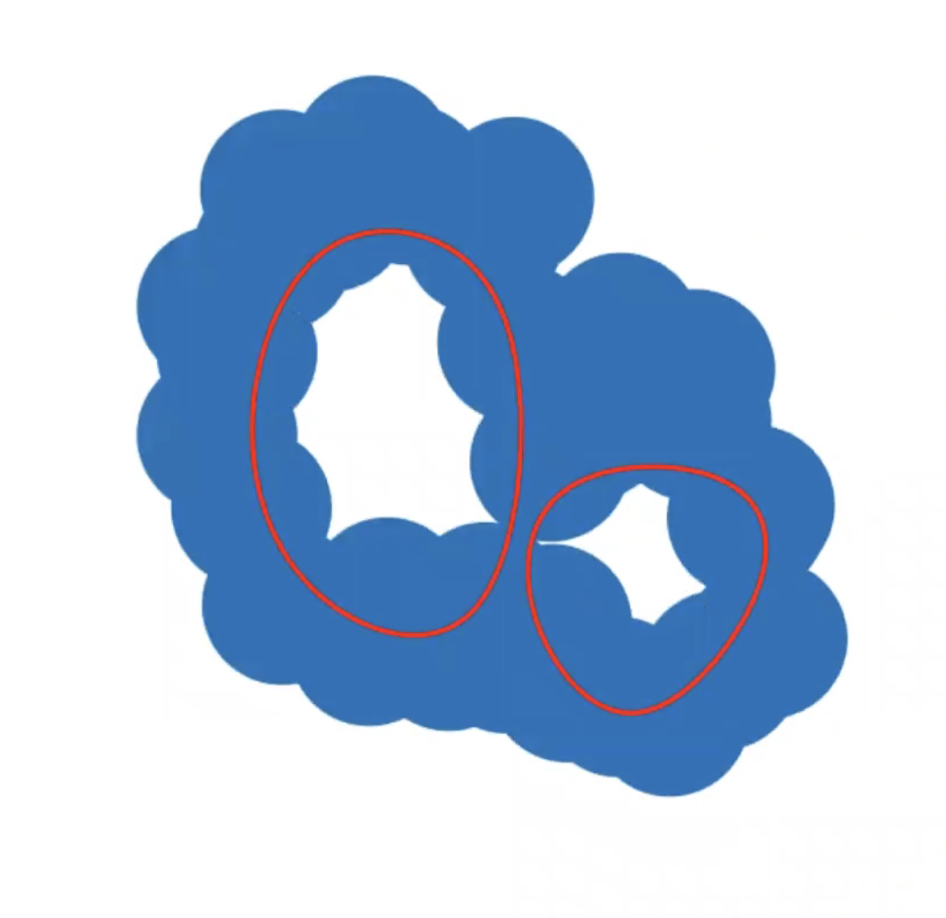{fig-align="center"} :::footer Slides based on Vincent Divol's [CDS Lunch Seminar](https://cds.nyu.edu/data-science-lunch-seminar-series/) presentation ::: ## Second Example 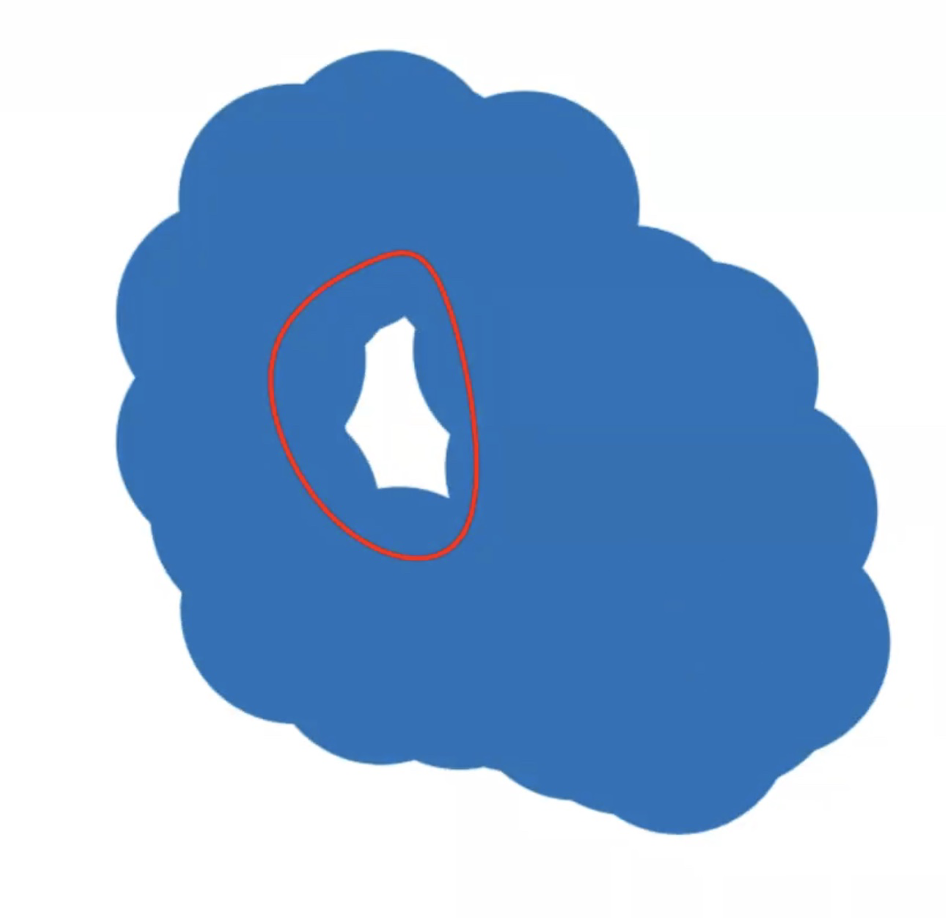{fig-align="center"} :::footer Slides based on Vincent Divol's [CDS Lunch Seminar](https://cds.nyu.edu/data-science-lunch-seminar-series/) presentation ::: ## Second Example {fig-align="center"} :::footer Slides based on Vincent Divol's [CDS Lunch Seminar](https://cds.nyu.edu/data-science-lunch-seminar-series/) presentation ::: ## Second Example 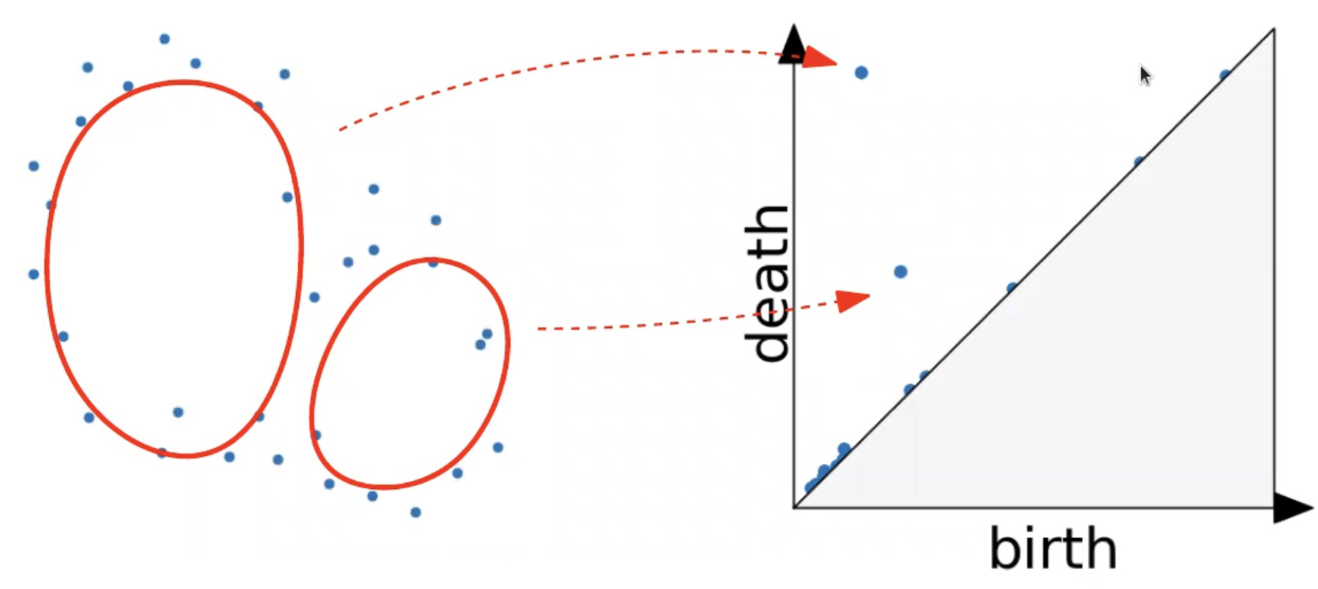{fig-align="center"} :::footer Slides based on Vincent Divol's [CDS Lunch Seminar](https://cds.nyu.edu/data-science-lunch-seminar-series/) presentation ::: ## Persistence diagram 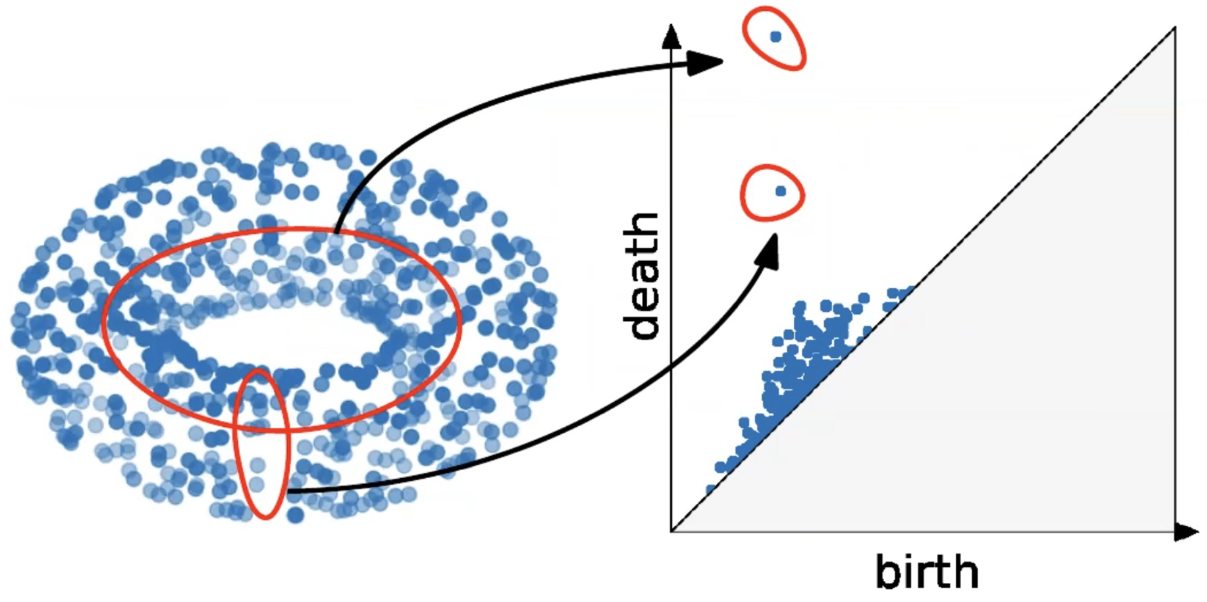{fig-align="center"} :::footer Slides based on Vincent Divol's [CDS Lunch Seminar](https://cds.nyu.edu/data-science-lunch-seminar-series/) presentation ::: ## Distance between persistence diagrams \If we have more than one persistence diagram, how do we measure the distance between them?
{fig-align="center"} :::footer Slides based on Vincent Divol's [CDS Lunch Seminar](https://cds.nyu.edu/data-science-lunch-seminar-series/) presentation ::: ## Distance between persistence diagrams \ :::: {.columns} ::: {.column width="30%"} We place both in the same diagram ::: ::: {.column width="70%"} 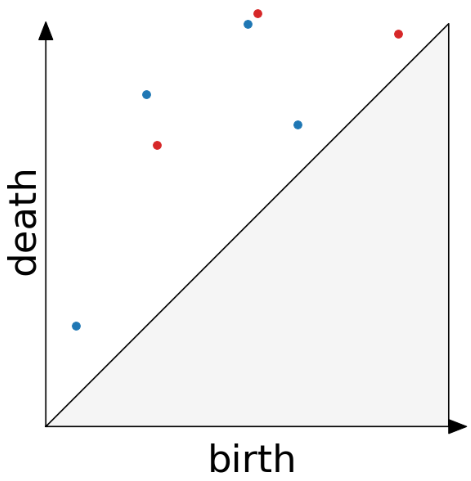{fig-align="center"} ::: :::: :::footer Slides based on Vincent Divol's [CDS Lunch Seminar](https://cds.nyu.edu/data-science-lunch-seminar-series/) presentation ::: ## Distance between persistence diagrams \ :::: {.columns} ::: {.column width="30%"} We place both in the same diagram Get the optimal pair matching between the points (including the diagonal) ::: ::: {.column width="70%"} 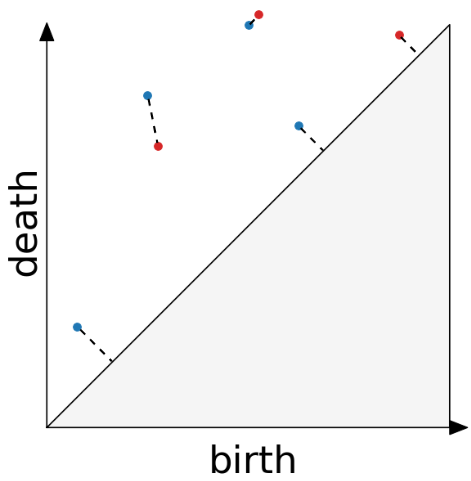{fig-align="center"} ::: :::: :::footer Slides based on Vincent Divol's [CDS Lunch Seminar](https://cds.nyu.edu/data-science-lunch-seminar-series/) presentation ::: ## Distance between persistence diagrams \ :::: {.columns} ::: {.column width="30%"} We place both in the same diagram Get the optimal pair matching between the points (including the diagonal) The **bottleneck distance** between them will be the largest pair distance ::: ::: {.column width="70%"} {fig-align="center"} ::: :::: :::footer Slides based on Vincent Divol's [CDS Lunch Seminar](https://cds.nyu.edu/data-science-lunch-seminar-series/) presentation ::: ## Simplicial complexes **Definition** We call a non-empty family of sets $K$ with a collection of non-empty subsets $S$ an *abstract simplicial complex* if: 1. $\{v\} \in S$ for all $v \in K$ 2. If $\sigma \in S$ and $\tau \subseteq \sigma$, then $\tau \in K$. **Terminology** The elements of a simplicial complex $K$ are called *simplices*. A $k$-simplex consists of $k+1$ verticies. :::footer Slides based on Bastian Rieck's [Topological Data Analysis for Machine Learning](https://bastian.rieck.me/talks/ecml_pkdd_2020/) ::: ## Simplicial complexes **Example** Simplicial complexes can be decomposed into their skeletons, which only contain simplices of a certain dimension. 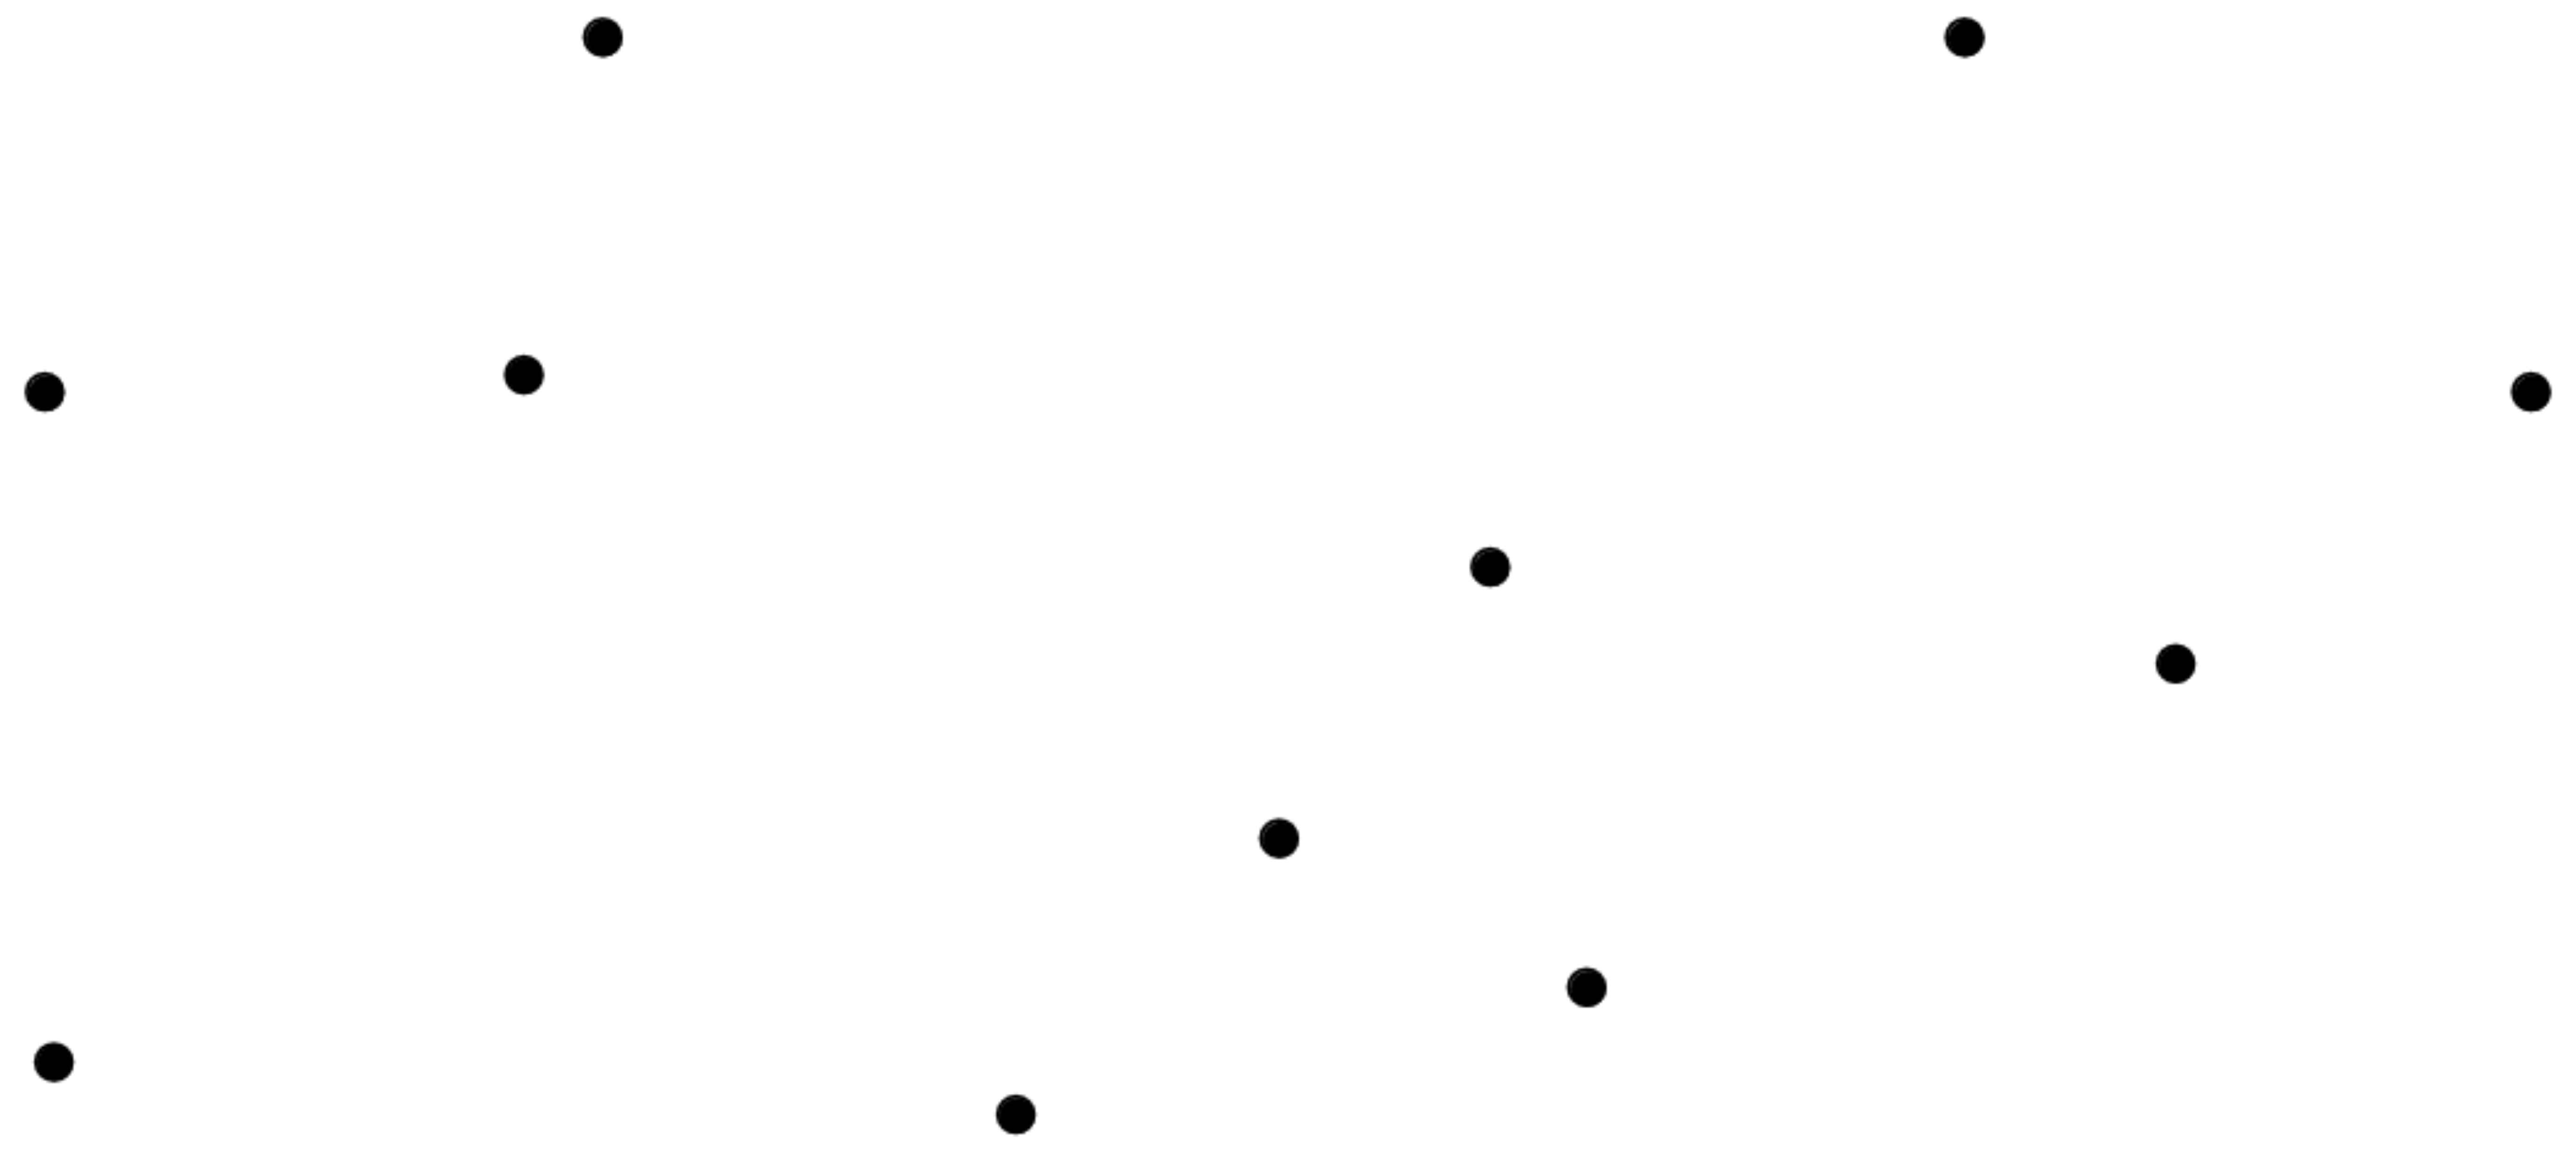{fig-align="center" width=50%} :::footer Slides based on Bastian Rieck's [Topological Data Analysis for Machine Learning](https://bastian.rieck.me/talks/ecml_pkdd_2020/) ::: ## Simplicial complexes **Example** Simplicial complexes can be decomposed into their skeletons, which only contain simplices of a certain dimension. 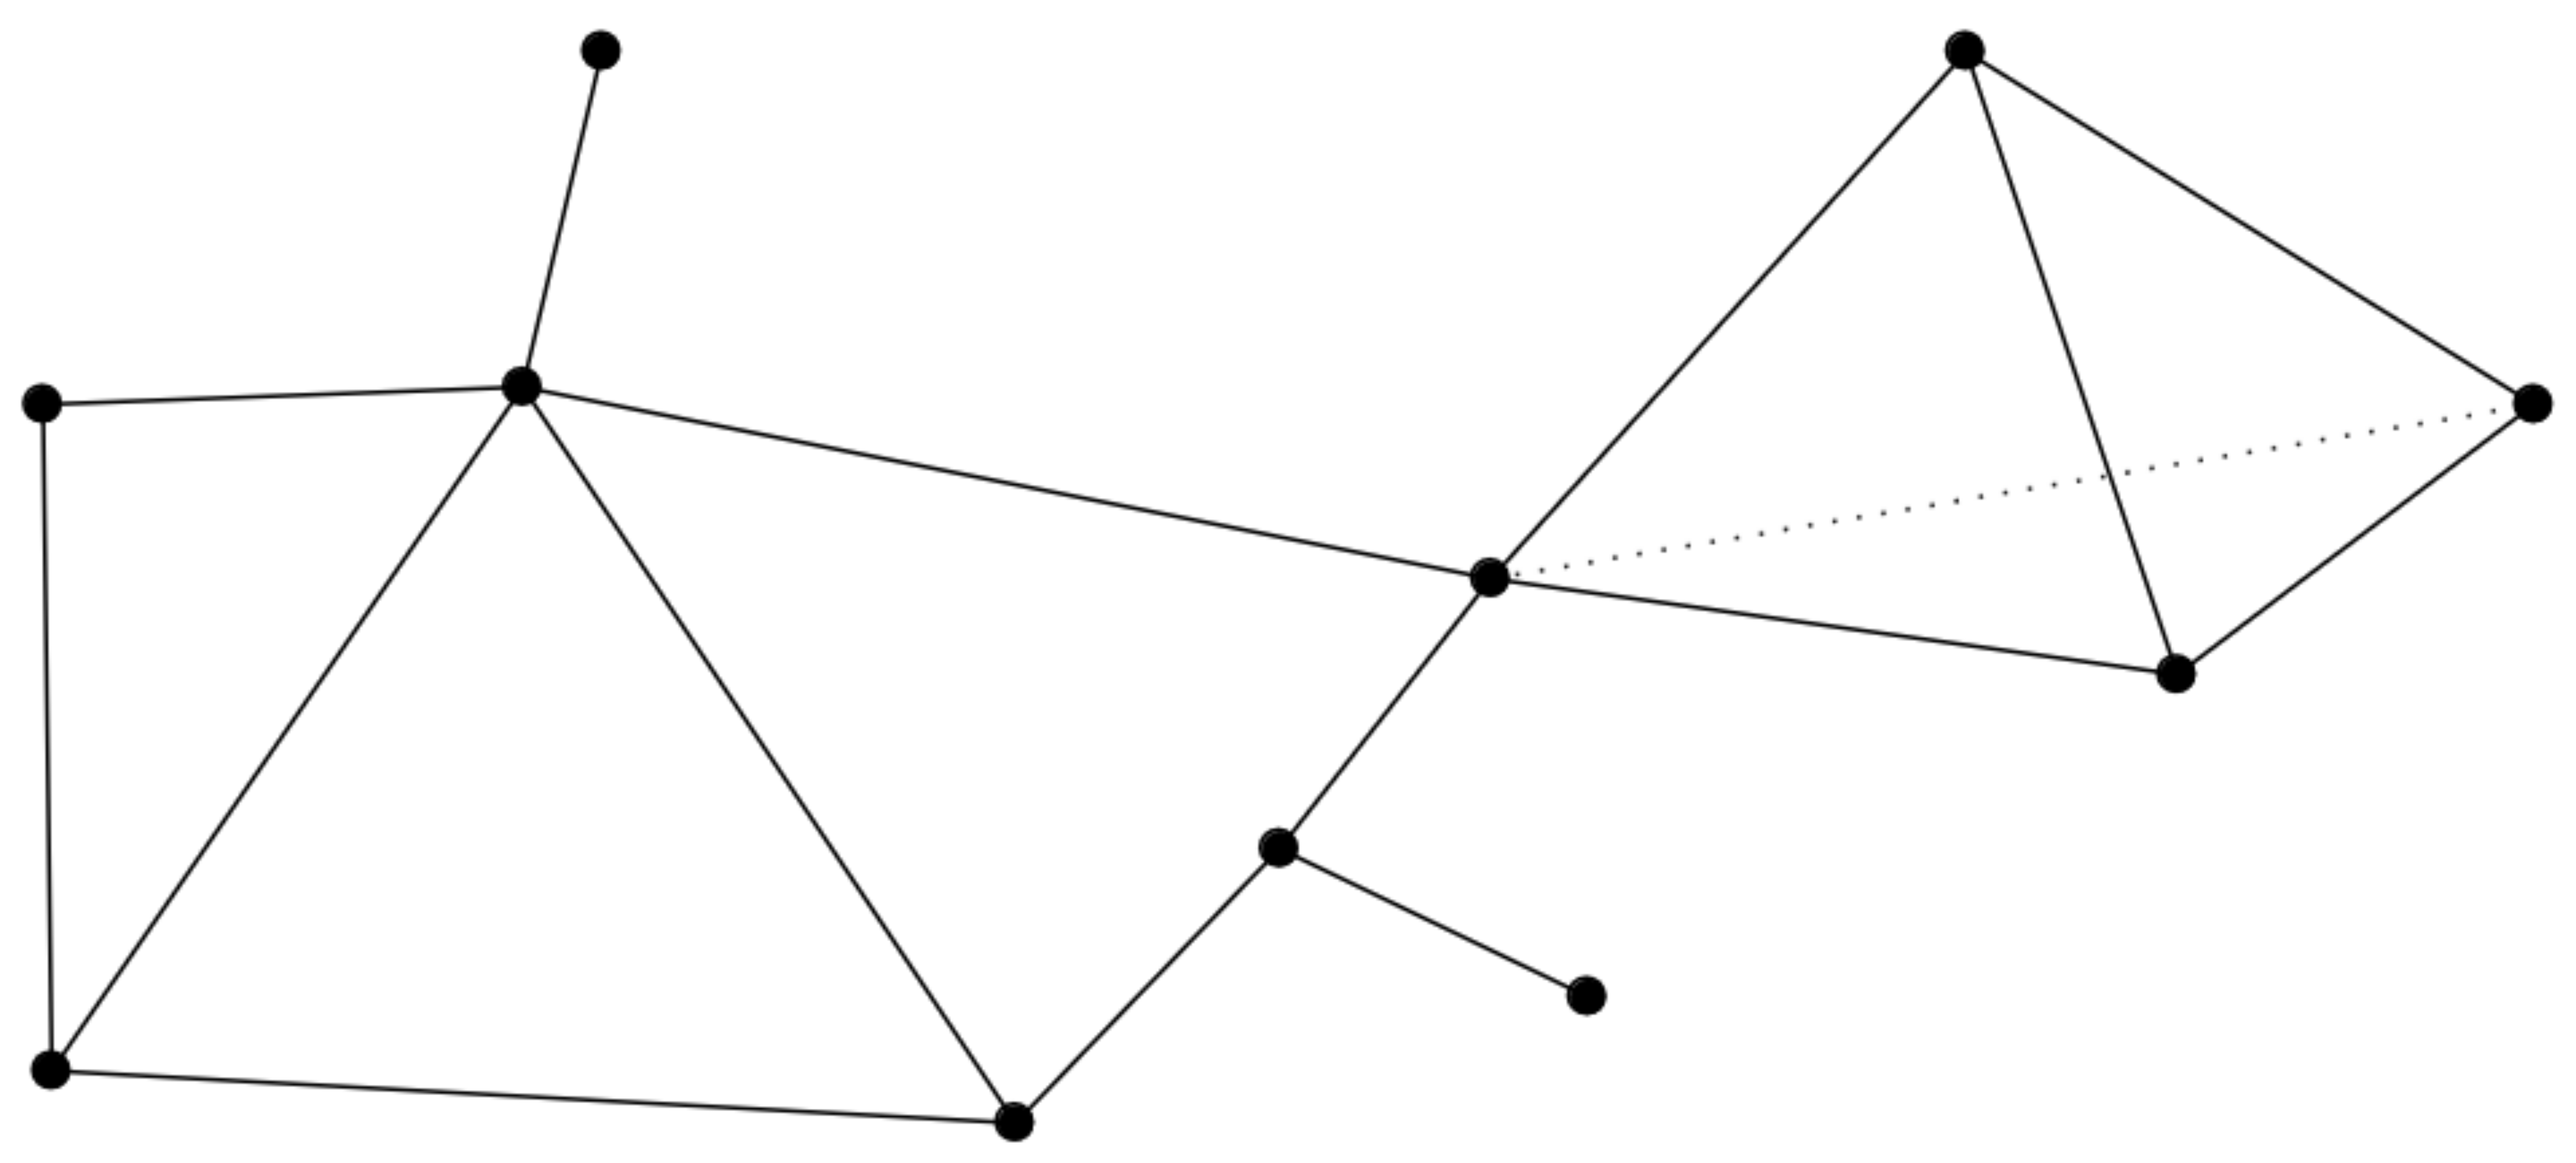{fig-align="center" width=50%} :::footer Slides based on Bastian Rieck's [Topological Data Analysis for Machine Learning](https://bastian.rieck.me/talks/ecml_pkdd_2020/) ::: ## Simplicial complexes **Example** Simplicial complexes can be decomposed into their skeletons, which only contain simplices of a certain dimension. 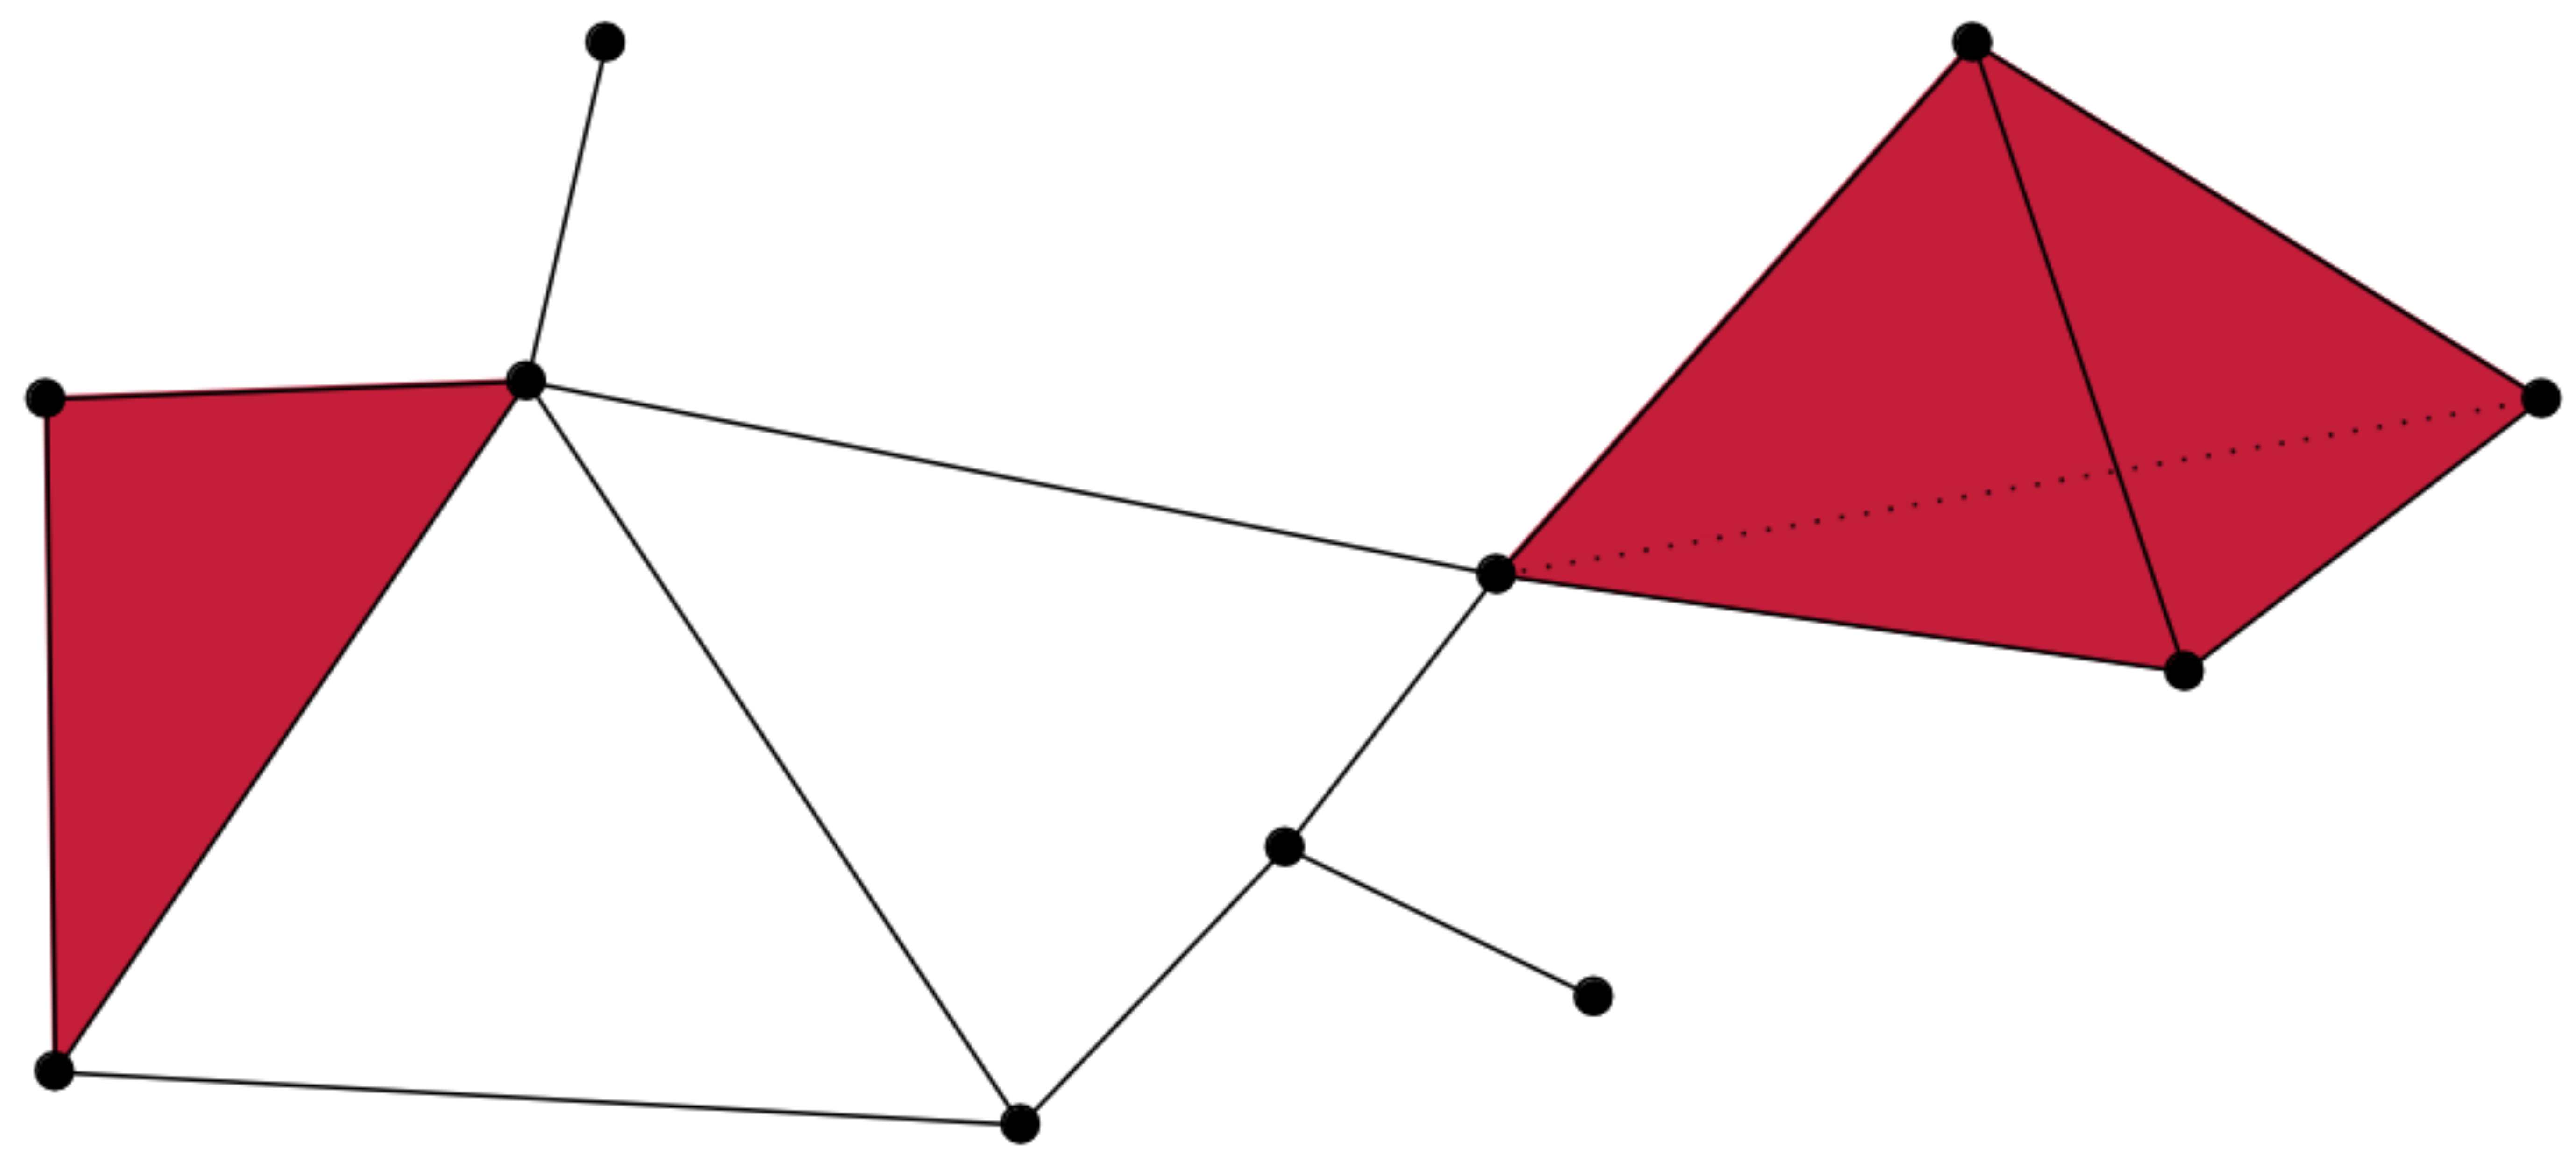{fig-align="center" width=50%} :::footer Slides based on Bastian Rieck's [Topological Data Analysis for Machine Learning](https://bastian.rieck.me/talks/ecml_pkdd_2020/) ::: ## Simplicial complexes **Example** Simplicial complexes can be decomposed into their skeletons, which only contain simplices of a certain dimension. 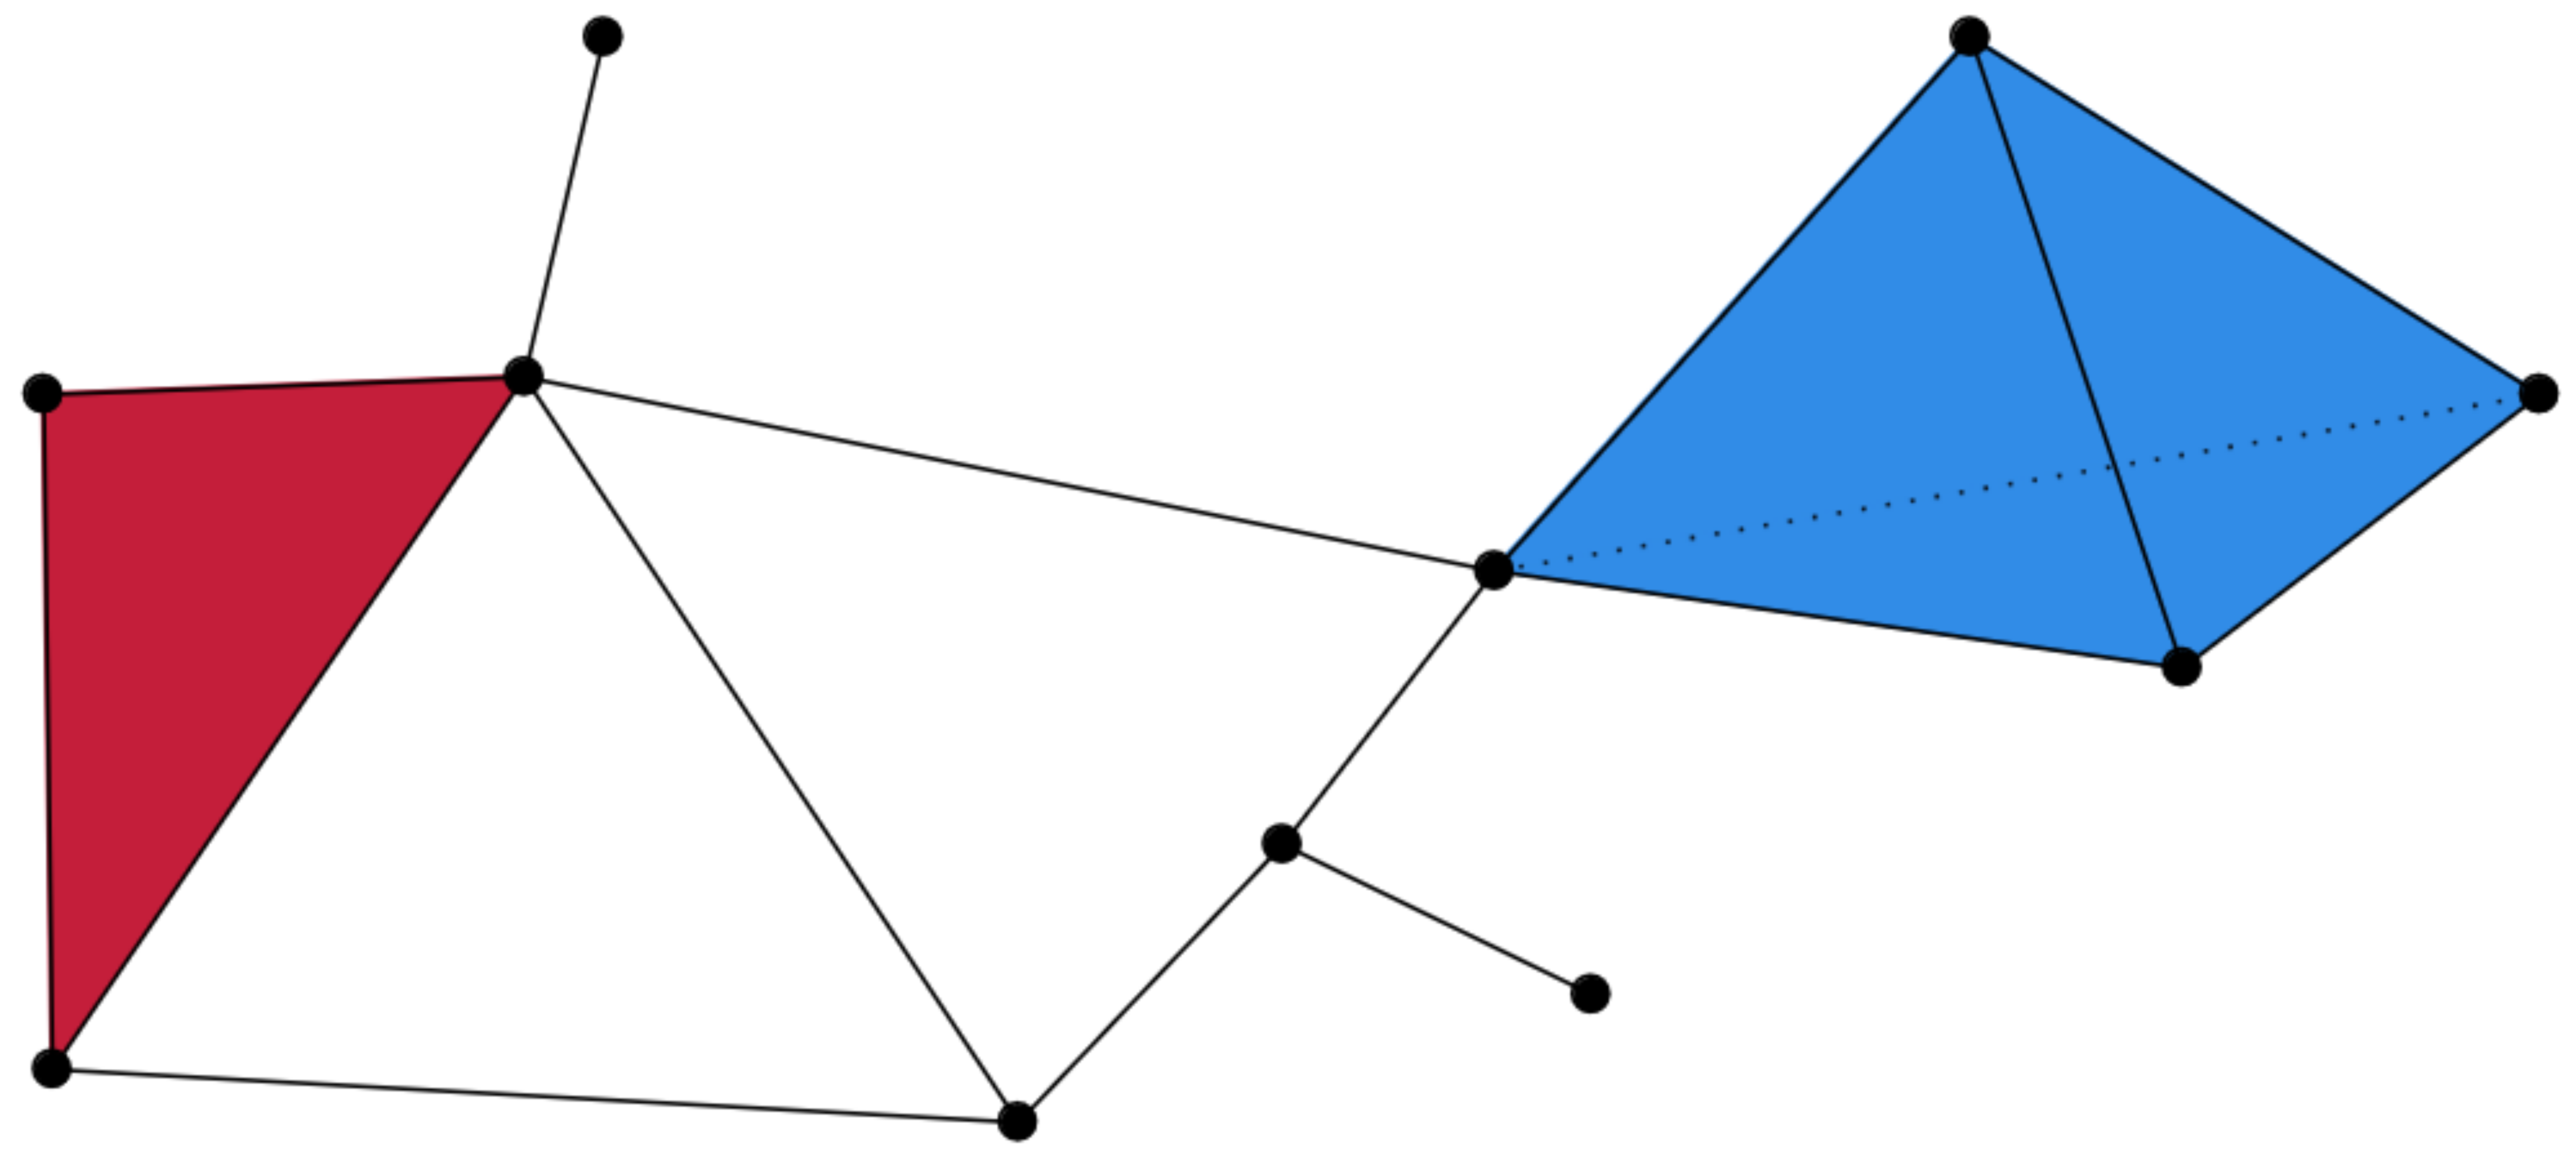{fig-align="center" width=50%} :::footer Slides based on Bastian Rieck's [Topological Data Analysis for Machine Learning](https://bastian.rieck.me/talks/ecml_pkdd_2020/) ::: ## Simplicial complexes **Non-example** This is *not* a simplicial complex because some higher-dimensional simplices do not intersect in a lower dimensional one! 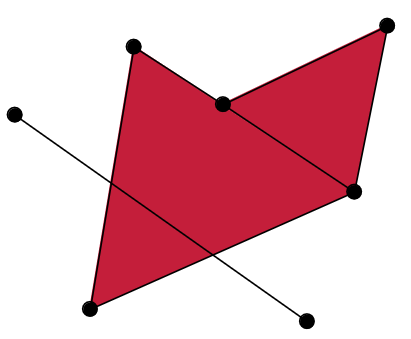{fig-align="center"} :::footer Slides based on Bastian Rieck's [Topological Data Analysis for Machine Learning](https://bastian.rieck.me/talks/ecml_pkdd_2020/) ::: ## Simplicial complexes **Example** 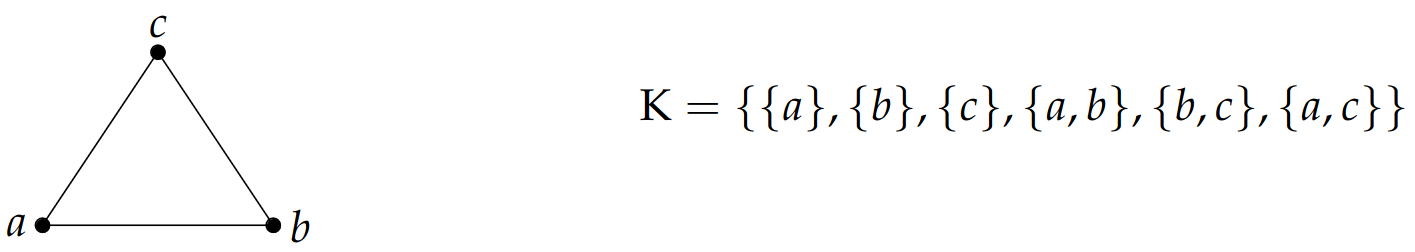{fig-align="center"} Notice that $K$ does not contain the 2-simplex $\{a,b,c\}$ :::footer Slides based on Bastian Rieck's [Topological Data Analysis for Machine Learning](https://bastian.rieck.me/talks/ecml_pkdd_2020/) ::: # From points clouds to simplicial complexes ## From points clouds to simplicial complexes \ 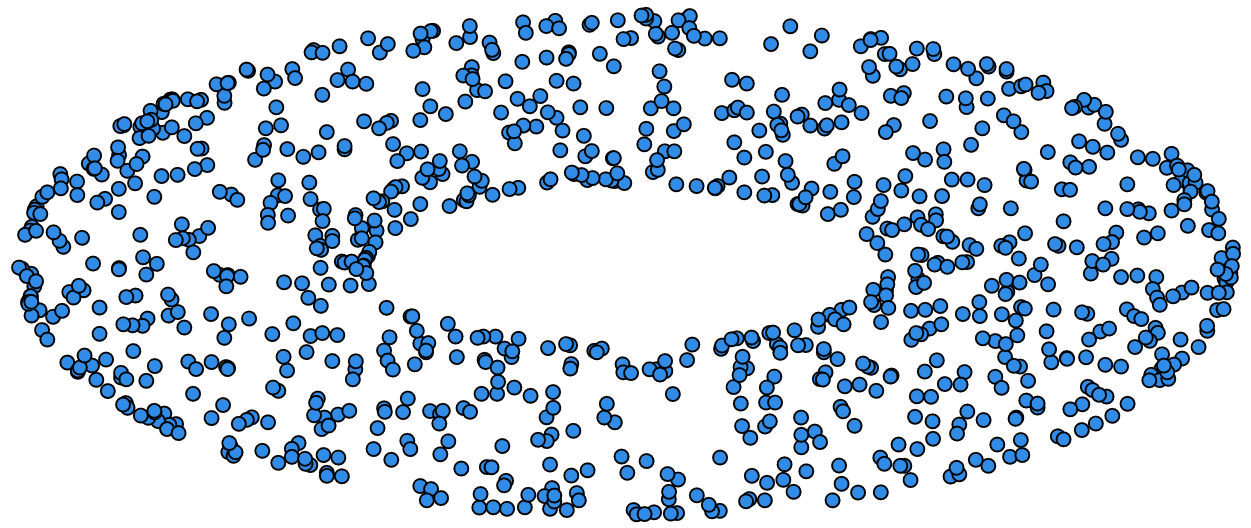{fig-align="center"} ## From points clouds to simplicial complexes {fig-align="center"} # ::: {style="font-size: 180%;"} **Strategy 1: Triangulation** ::: ::: {style="font-size: 150%;"} Constructing the data's simplicial complex ::: ## Vietoris-Rips construction **Definition** Given a set of points $\mathcal{X} = \{x_1,\dots,x_n\}$ and a metric $dist$ (such as the Euclidean distance), pick a threshold $\epsilon$ and build the Vietoris-Rips complex $\mathcal{V}_\epsilon$ defined as: $$\mathcal{V}_\epsilon := \{\sigma \subseteq \mathcal{X} | \forall u,v \in \sigma : dist(u,v) \leq \epsilon\}$$ Equivalently, $\mathcal{V}_\epsilon$ contains all simplices whose *diameter* is less than or equal to $\epsilon$. :::footer Slides based on Bastian Rieck's [Topological Data Analysis for Machine Learning](https://bastian.rieck.me/talks/ecml_pkdd_2020/) ::: ## Vietoris-Rips construction **Example** 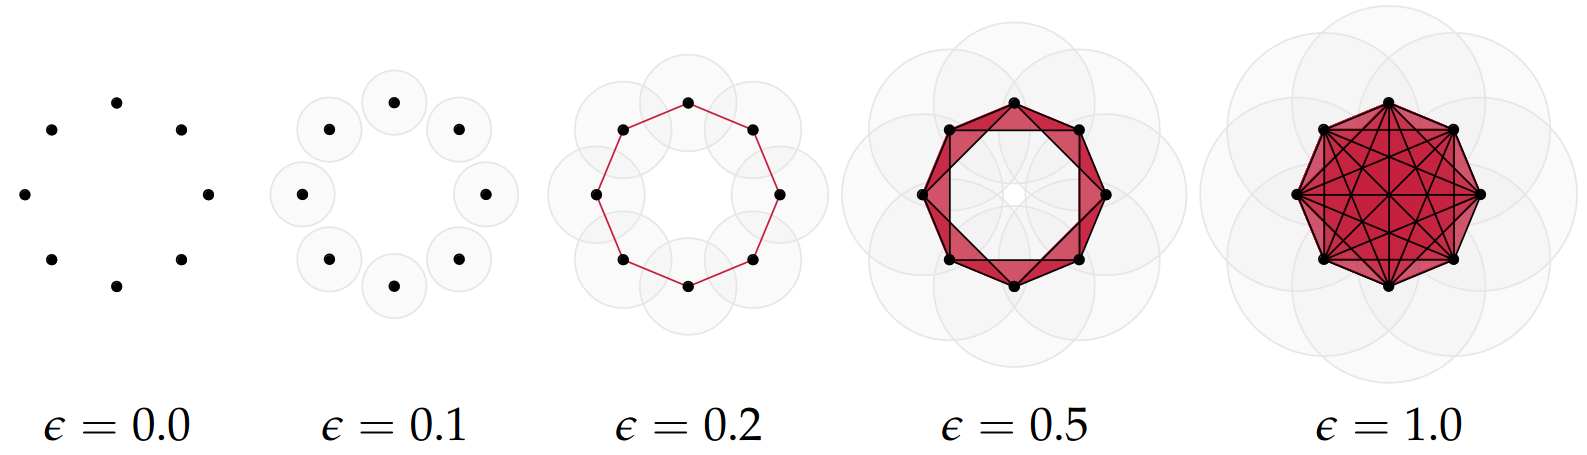{fig-align="center"} Draw Euclidean balls (circles) of diameter $\epsilon$ and create a $k$-simplex $\sigma$ for each subset of $k+1$ points that intersect pairwise. :::footer Slides based on Bastian Rieck's [Topological Data Analysis for Machine Learning](https://bastian.rieck.me/talks/ecml_pkdd_2020/) ::: ## Some details about this construction :::: {.columns} ::: {.column width="30%"} 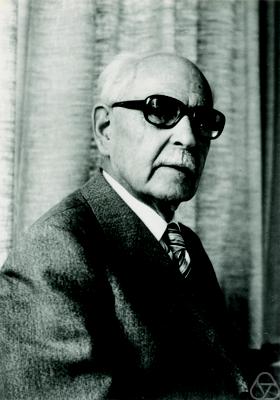 ::: ::: {.column width="70%"} - This construction dates back to a 1927 article by Leopold Vietoris$^1$ - A 2010 paper by Afra Zomorodian$^2$ describes several construction algorithms - The basic idea is to build higher-dimensional simplices inductively from lower-dimensional ones - In the worst case, the Vietoris-Rips complex will contain all $2^n$ subsets of its underluing point clous $\mathcal{X}$! ::: :::: :::footer ::: {style="font-size: 80%;"} $^1$ Vietoris, Leopold. "Über den höheren Zusammenhang kompakter Räume und eine Klasse von zusammenhangstreuen Abbildungen." Mathematische Annalen 97.1 (1927): 454-472. $^2$ Zomorodian, Afra. "Fast construction of the Vietoris-Rips complex." Computers & Graphics 34.3 (2010): 263-271. ::: Slides based on Bastian Rieck's [Topological Data Analysis for Machine Learning](https://bastian.rieck.me/talks/ecml_pkdd_2020/) ::: ## The betti numbers of a Vietoris-Rips complex **Example** 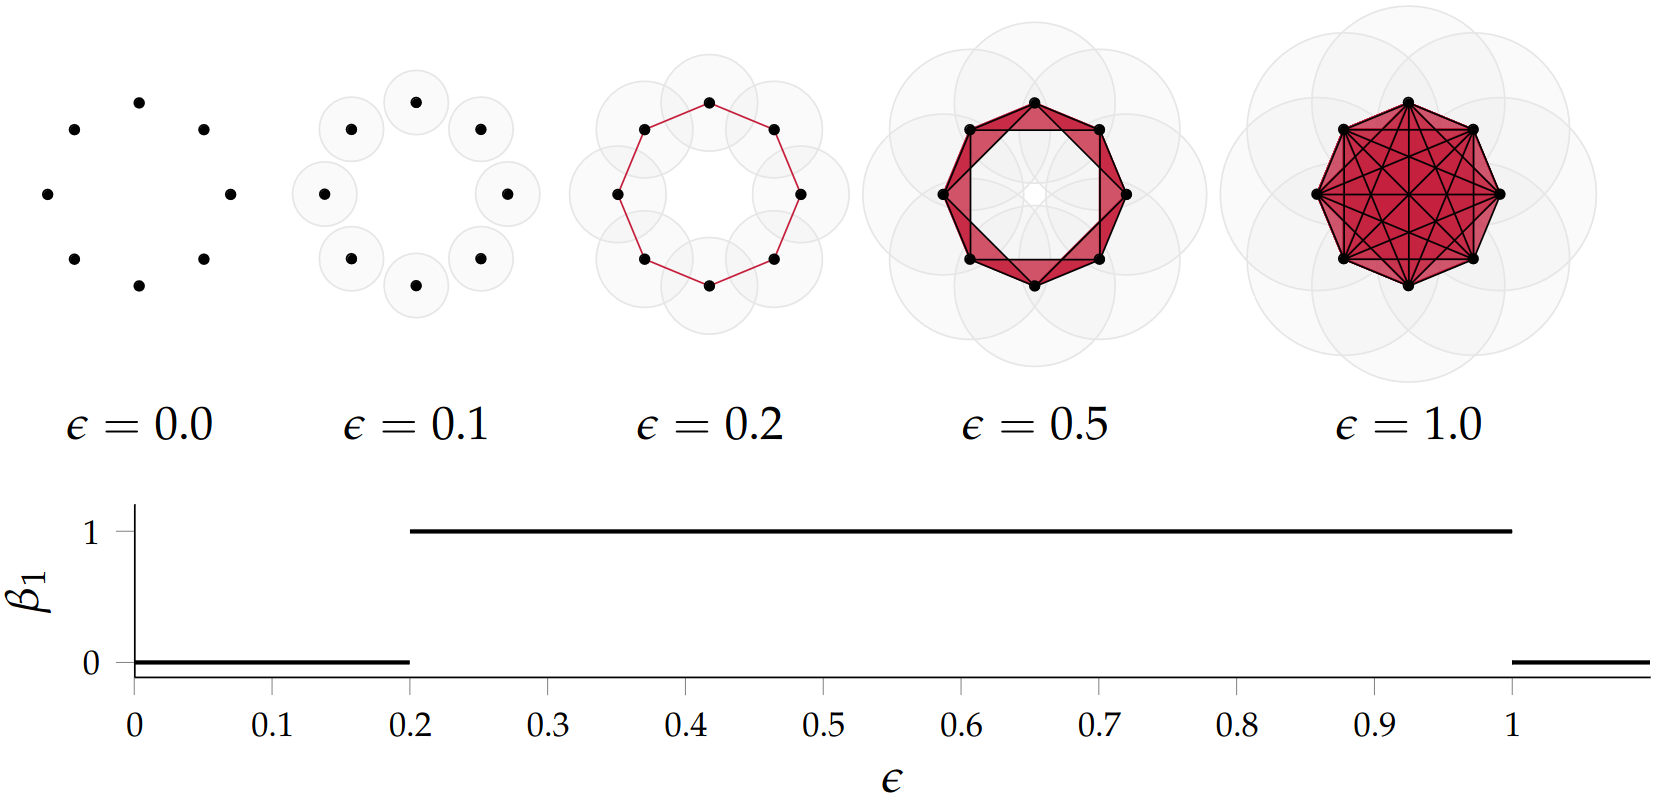{fig-align="center"} :::footer Slides based on Bastian Rieck's [Topological Data Analysis for Machine Learning](https://bastian.rieck.me/talks/ecml_pkdd_2020/) ::: ## Issues with this approach \ ::: {style="font-size: 120%;"} - How to pick $\epsilon$? - There might not be one 'correct' value for $\epsilon$. - Computationally inefficient ::: :::footer Slides based on Bastian Rieck's [Topological Data Analysis for Machine Learning](https://bastian.rieck.me/talks/ecml_pkdd_2020/) ::: ## Picking $\epsilon$ - Topological Persistence **Intuition:** Go through all scales and track the topological features :::: {.columns} ::: {.column width="50%"}  ::: :::: :::footer Slides based on Bastian Rieck's [Topological Data Analysis for Machine Learning](https://bastian.rieck.me/talks/ecml_pkdd_2020/) ::: ## Picking $\epsilon$ - Topological Persistence **Intuition:** Go through all scales and track the topological features :::: {.columns} ::: {.column width="50%"} 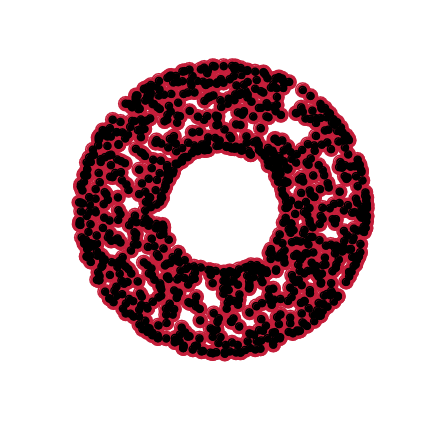 ::: :::: :::footer Slides based on Bastian Rieck's [Topological Data Analysis for Machine Learning](https://bastian.rieck.me/talks/ecml_pkdd_2020/) ::: ## Picking $\epsilon$ - Topological Persistence **Intuition:** Go through all scales and track the topological features :::: {.columns} ::: {.column width="50%"} 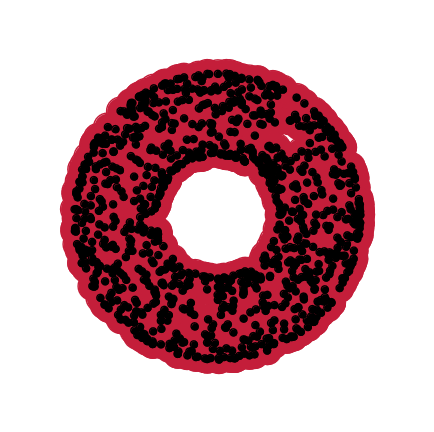 ::: :::: :::footer Slides based on Bastian Rieck's [Topological Data Analysis for Machine Learning](https://bastian.rieck.me/talks/ecml_pkdd_2020/) ::: ## Picking $\epsilon$ - Topological Persistence **Intuition:** Go through all scales and track the topological features :::: {.columns} ::: {.column width="50%"}  ::: :::: :::footer Slides based on Bastian Rieck's [Topological Data Analysis for Machine Learning](https://bastian.rieck.me/talks/ecml_pkdd_2020/) ::: ## Picking $\epsilon$ - Topological Persistence **Intuition:** Go through all scales and track the topological features :::: {.columns} ::: {.column width="50%"}  ::: ::: {.column width="50%"} 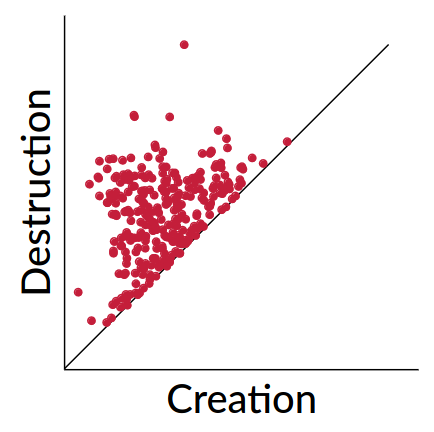 ::: :::: :::footer Slides based on Bastian Rieck's [Topological Data Analysis for Machine Learning](https://bastian.rieck.me/talks/ecml_pkdd_2020/) ::: # ::: {style="font-size: 180%;"} **Strategy 2: Data skeleton** ::: ::: {style="font-size: 150%;"} The Mapper Algortihm ::: ## Math World \ We start in "Math World", where - We draw the data as a smooth manifold - Functions that appear are smooth or continuous We will not need either of these assumptions once we are in the "Data World". Even more importantly, data in the real world is **never** like this. :::footer Slides based on Anthony Bak's [Stanford Seminar - Topological Data Analysis](https://www.youtube.com/watch?v=x3Hl85OBuc0) presentation ::: ## Math World 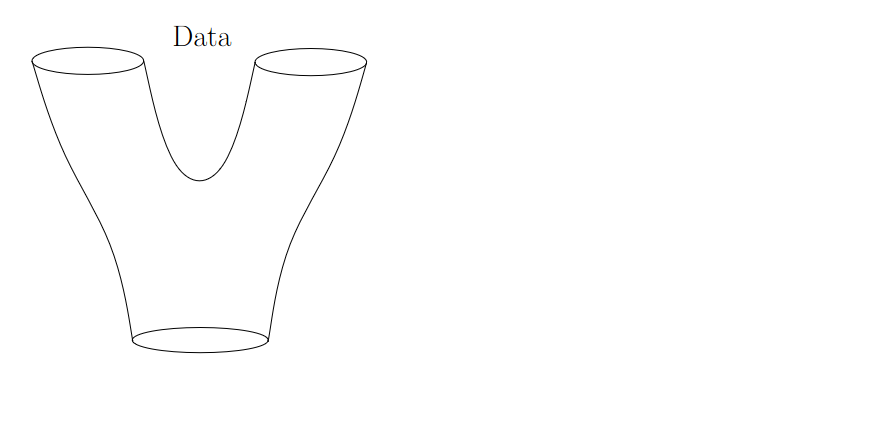{fig-align="center"} :::footer Slides based on Anthony Bak's [Stanford Seminar - Topological Data Analysis](https://www.youtube.com/watch?v=x3Hl85OBuc0) presentation ::: ## Math World 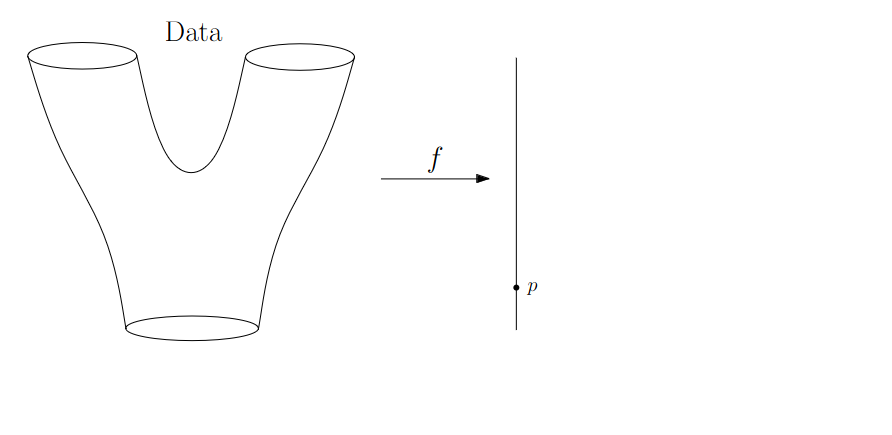{fig-align="center"} :::footer Slides based on Anthony Bak's [Stanford Seminar - Topological Data Analysis](https://www.youtube.com/watch?v=x3Hl85OBuc0) presentation ::: ## Math World 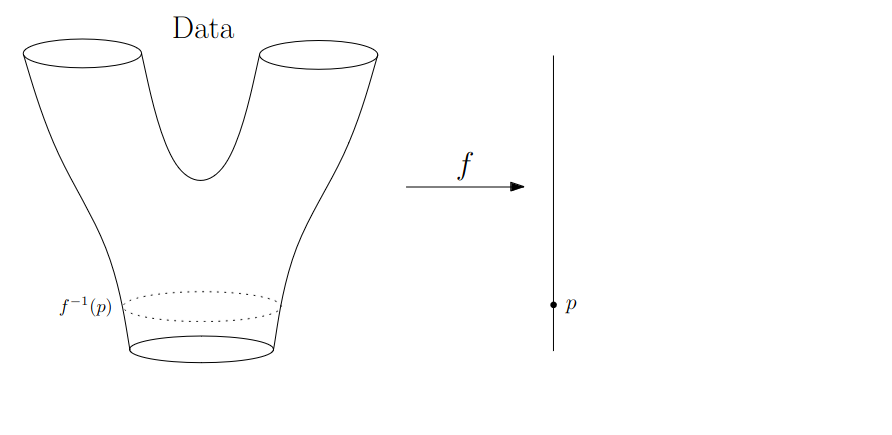{fig-align="center"} :::footer Slides based on Anthony Bak's [Stanford Seminar - Topological Data Analysis](https://www.youtube.com/watch?v=x3Hl85OBuc0) presentation ::: ## Math World 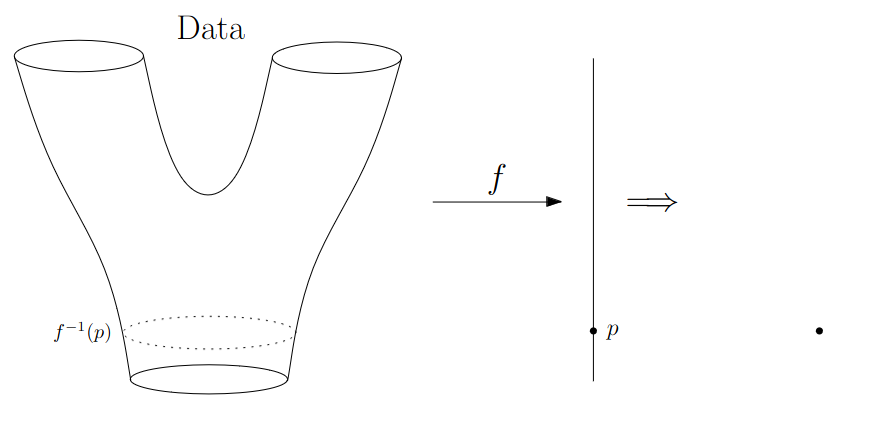{fig-align="center"} :::footer Slides based on Anthony Bak's [Stanford Seminar - Topological Data Analysis](https://www.youtube.com/watch?v=x3Hl85OBuc0) presentation ::: ## Math World 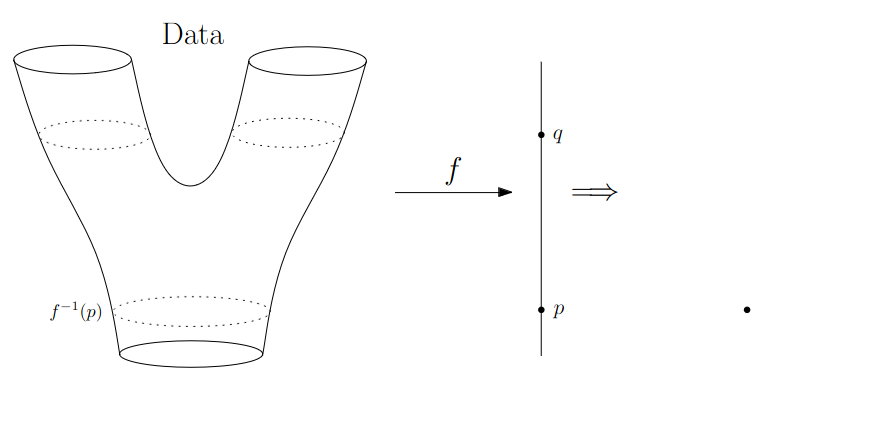{fig-align="center"} :::footer Slides based on Anthony Bak's [Stanford Seminar - Topological Data Analysis](https://www.youtube.com/watch?v=x3Hl85OBuc0) presentation ::: ## Math World 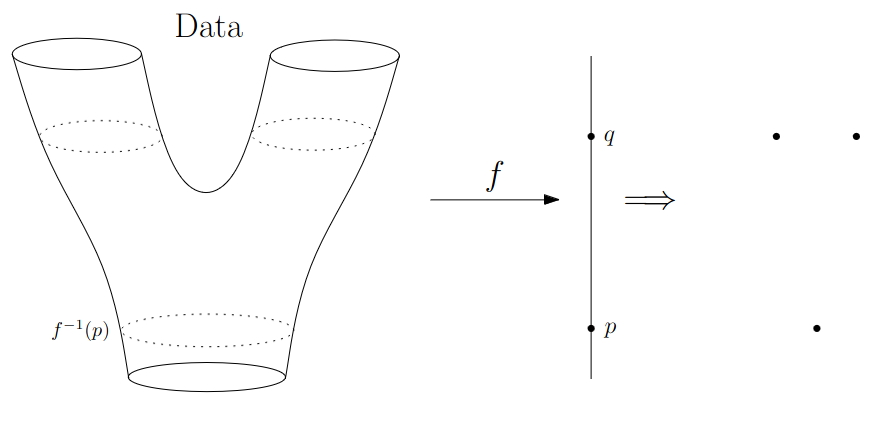{fig-align="center"} :::footer Slides based on Anthony Bak's [Stanford Seminar - Topological Data Analysis](https://www.youtube.com/watch?v=x3Hl85OBuc0) presentation ::: ## Math World 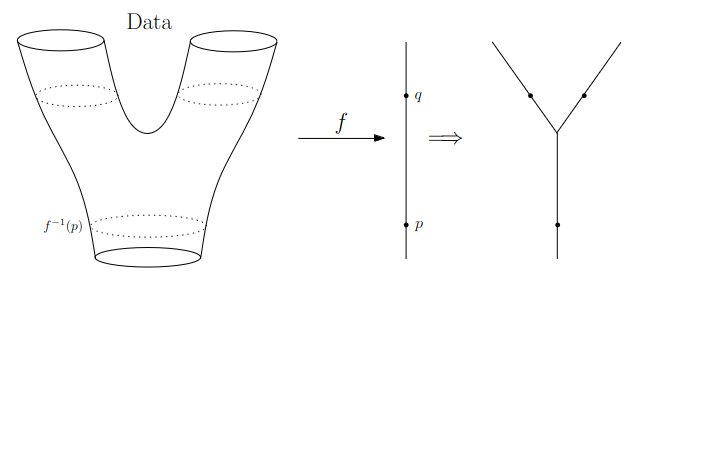{fig-align="center"} :::footer Slides based on Anthony Bak's [Stanford Seminar - Topological Data Analysis](https://www.youtube.com/watch?v=x3Hl85OBuc0) presentation ::: ## Math World 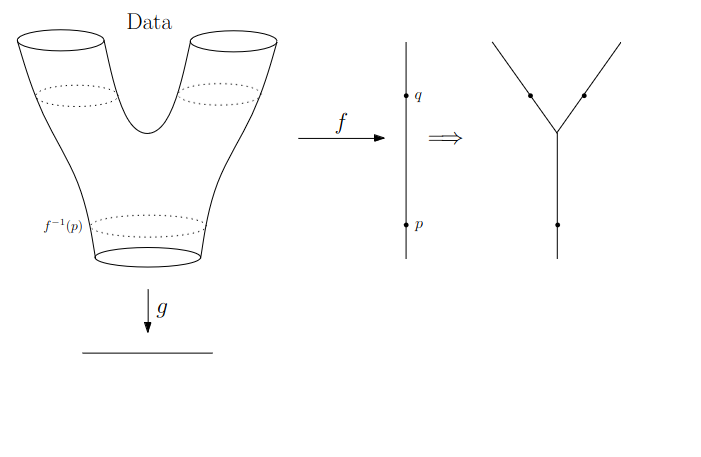{fig-align="center"} :::footer Slides based on Anthony Bak's [Stanford Seminar - Topological Data Analysis](https://www.youtube.com/watch?v=x3Hl85OBuc0) presentation ::: ## Math World 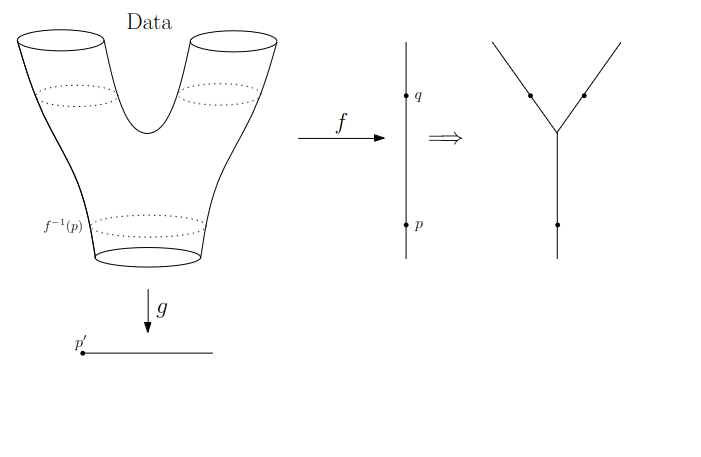{fig-align="center"} :::footer Slides based on Anthony Bak's [Stanford Seminar - Topological Data Analysis](https://www.youtube.com/watch?v=x3Hl85OBuc0) presentation ::: ## Math World 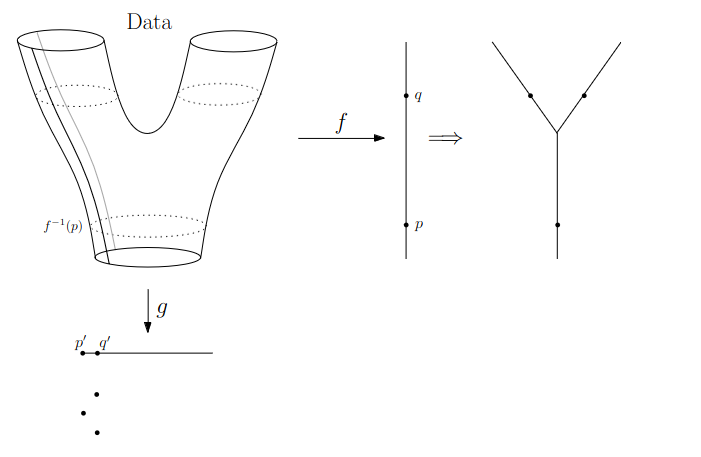{fig-align="center"} :::footer Slides based on Anthony Bak's [Stanford Seminar - Topological Data Analysis](https://www.youtube.com/watch?v=x3Hl85OBuc0) presentation ::: ## Math World 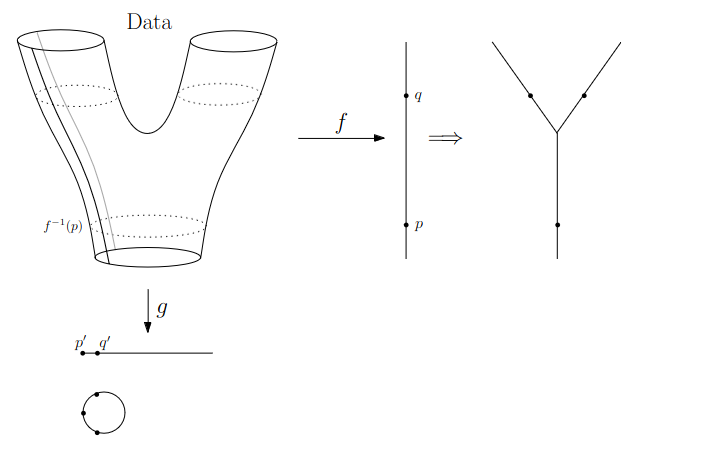{fig-align="center"} :::footer Slides based on Anthony Bak's [Stanford Seminar - Topological Data Analysis](https://www.youtube.com/watch?v=x3Hl85OBuc0) presentation ::: ## Math World 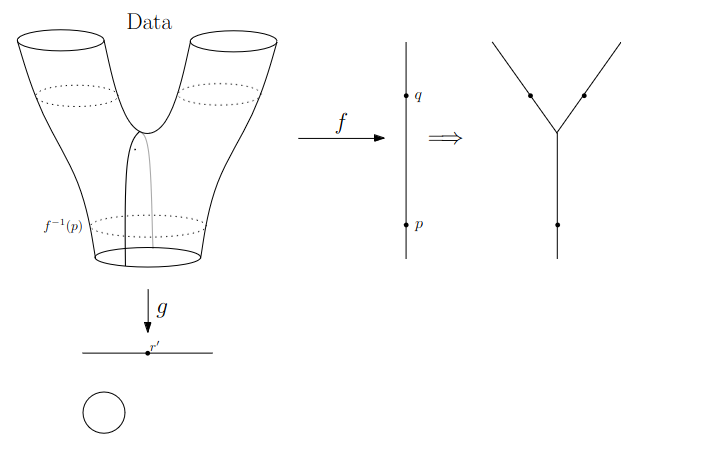{fig-align="center"} :::footer Slides based on Anthony Bak's [Stanford Seminar - Topological Data Analysis](https://www.youtube.com/watch?v=x3Hl85OBuc0) presentation ::: ## Math World 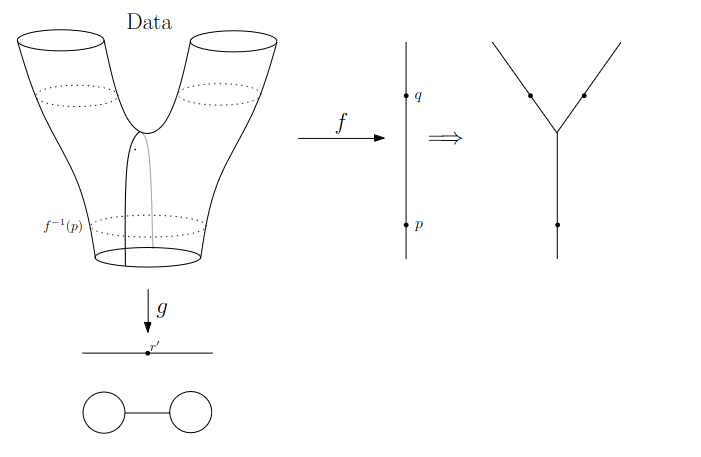{fig-align="center"} :::footer Slides based on Anthony Bak's [Stanford Seminar - Topological Data Analysis](https://www.youtube.com/watch?v=x3Hl85OBuc0) presentation ::: ## Math World 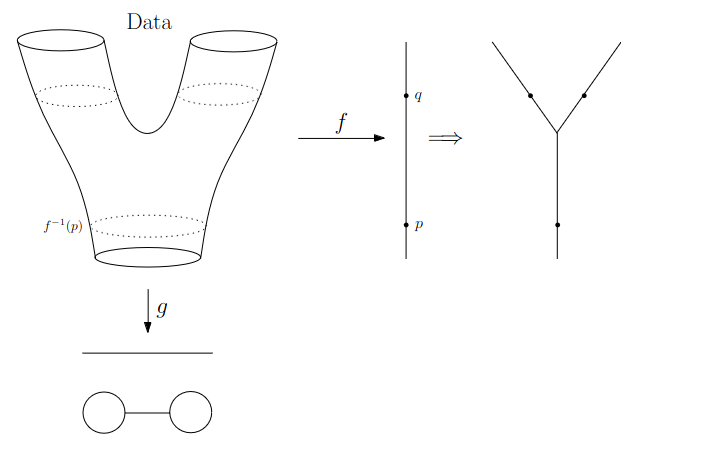{fig-align="center"} :::footer Slides based on Anthony Bak's [Stanford Seminar - Topological Data Analysis](https://www.youtube.com/watch?v=x3Hl85OBuc0) presentation ::: ## Why is this useful? We get "easy" understanding of the localizations of quantities of interest. 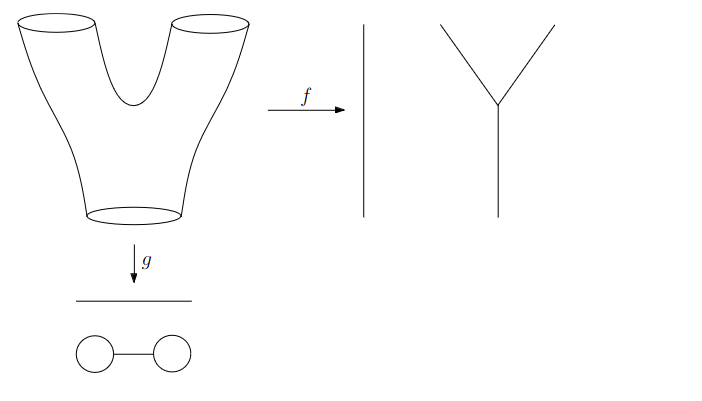{fig-align="center"} :::footer Slides based on Anthony Bak's [Stanford Seminar - Topological Data Analysis](https://www.youtube.com/watch?v=x3Hl85OBuc0) presentation ::: ## Why is this useful? We get "easy" understanding of the localizations of quantities of interest. 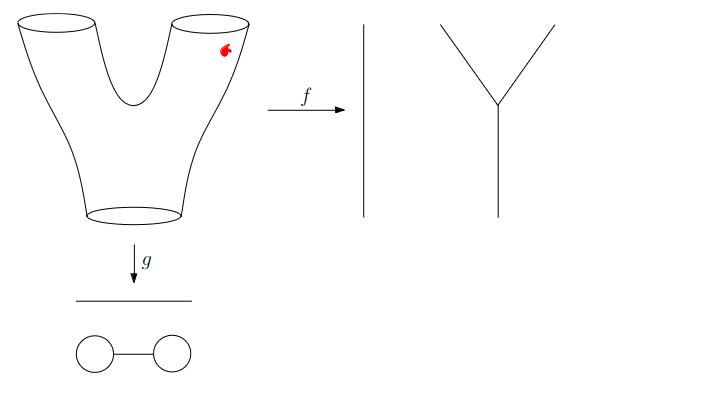{fig-align="center"} :::footer Slides based on Anthony Bak's [Stanford Seminar - Topological Data Analysis](https://www.youtube.com/watch?v=x3Hl85OBuc0) presentation ::: ## Why is this useful? We get "easy" understanding of the localizations of quantities of interest. 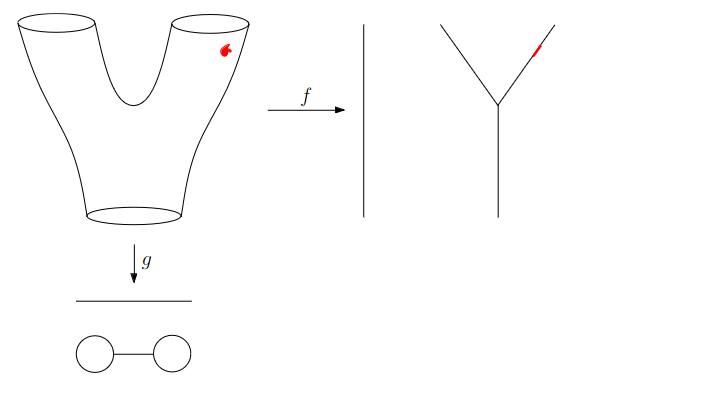{fig-align="center"} :::footer Slides based on Anthony Bak's [Stanford Seminar - Topological Data Analysis](https://www.youtube.com/watch?v=x3Hl85OBuc0) presentation ::: ## Why is this useful? We get "easy" understanding of the localizations of quantities of interest. 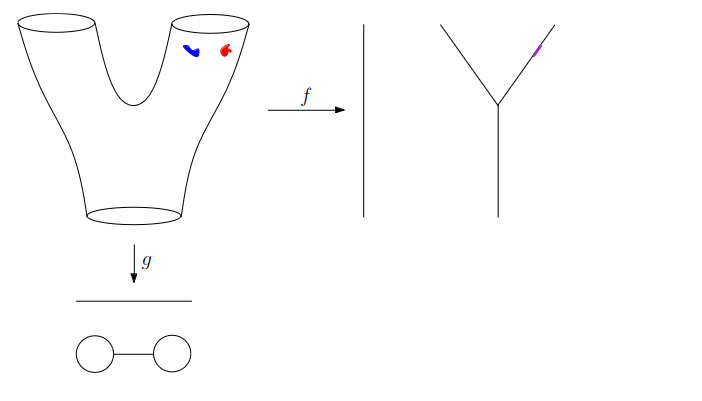{fig-align="center"} :::footer Slides based on Anthony Bak's [Stanford Seminar - Topological Data Analysis](https://www.youtube.com/watch?v=x3Hl85OBuc0) presentation ::: ## Why is this useful? We get "easy" understanding of the localizations of quantities of interest. 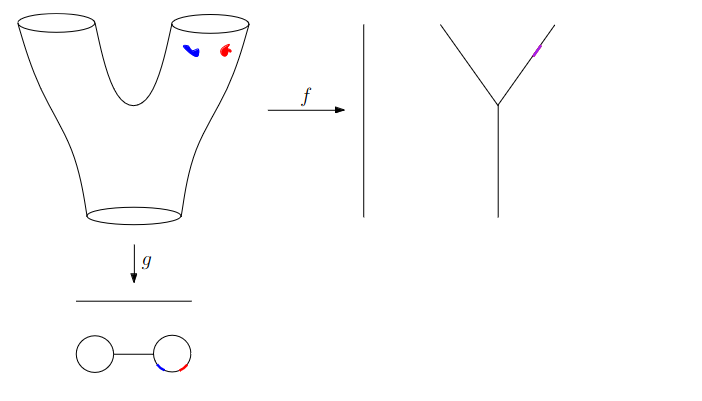{fig-align="center"} :::footer Slides based on Anthony Bak's [Stanford Seminar - Topological Data Analysis](https://www.youtube.com/watch?v=x3Hl85OBuc0) presentation ::: ## Why is this useful? We get "easy" understanding of the localizations of quantities of interest. 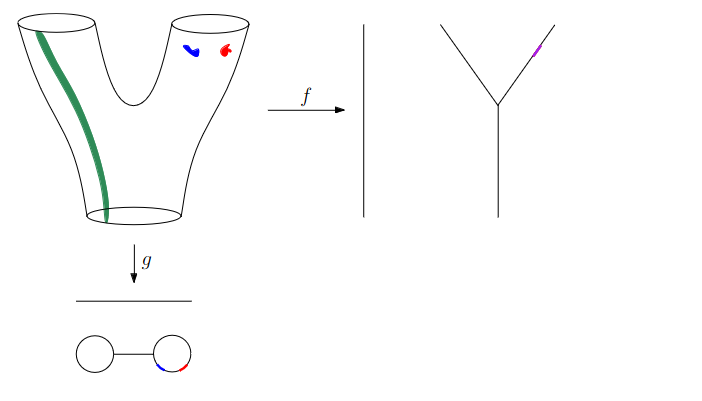{fig-align="center"} :::footer Slides based on Anthony Bak's [Stanford Seminar - Topological Data Analysis](https://www.youtube.com/watch?v=x3Hl85OBuc0) presentation ::: ## Why is this useful? We get "easy" understanding of the localizations of quantities of interest. 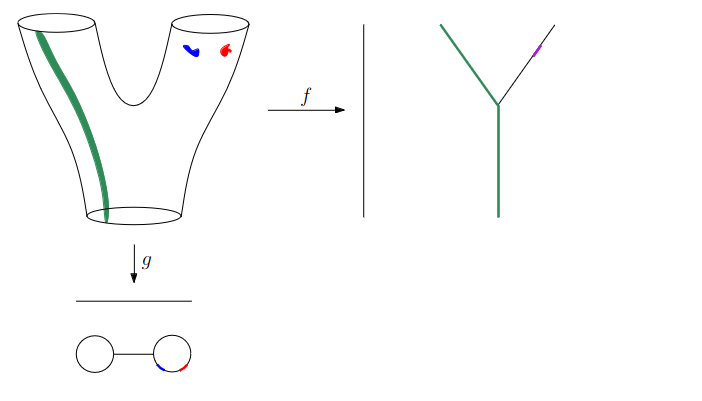{fig-align="center"} :::footer Slides based on Anthony Bak's [Stanford Seminar - Topological Data Analysis](https://www.youtube.com/watch?v=x3Hl85OBuc0) presentation ::: ## Why is this useful? We get "easy" understanding of the localizations of quantities of interest. - Lenses inform us where in the space to look for phenomena. - For easy localizations many different lenses will be informative. - For hard (= geometrically distributed) localizations we have to be more careful. But even then, we frequently get incremental knowledge from a poorly chosen lens. :::footer Slides based on Anthony Bak's [Stanford Seminar - Topological Data Analysis](https://www.youtube.com/watch?v=x3Hl85OBuc0) presentation ::: ## Data World - Mapper We need to adjust the "Math World" view to bring the algorithm into the "Data World" - We replace points with open sets in the range of the lens - We replace "connected component of the inverse image" with "clusters in the inverse image" - We connect clusters (nodes) with an edge if they share points in common. :::footer Slides based on Anthony Bak's [Stanford Seminar - Topological Data Analysis](https://www.youtube.com/watch?v=x3Hl85OBuc0) presentation ::: ## Data World - Mapper 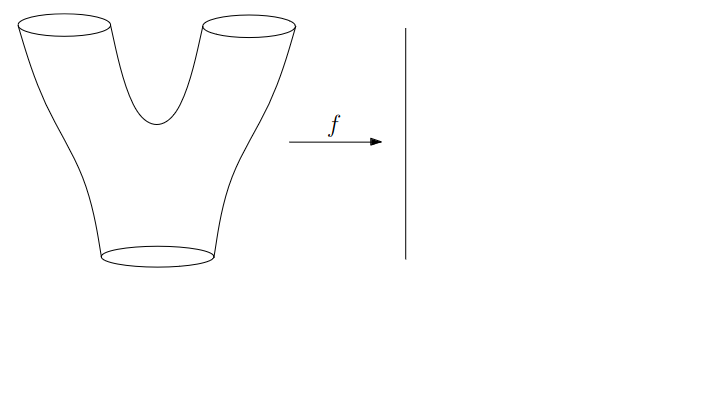{fig-align="center"} :::footer Slides based on Anthony Bak's [Stanford Seminar - Topological Data Analysis](https://www.youtube.com/watch?v=x3Hl85OBuc0) presentation ::: ## Data World - Mapper 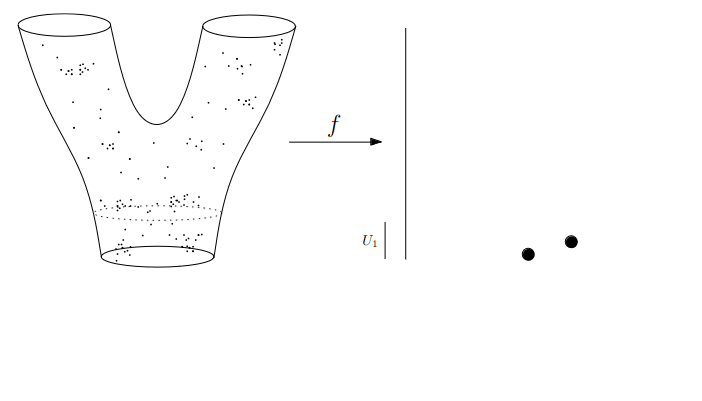{fig-align="center"} :::footer Slides based on Anthony Bak's [Stanford Seminar - Topological Data Analysis](https://www.youtube.com/watch?v=x3Hl85OBuc0) presentation ::: ## Data World - Mapper 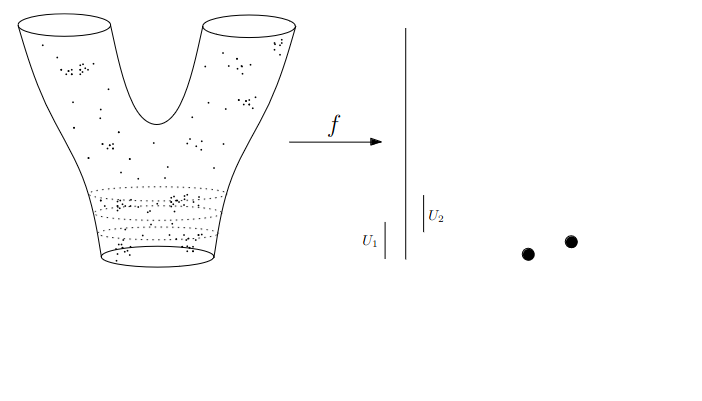{fig-align="center"} :::footer Slides based on Anthony Bak's [Stanford Seminar - Topological Data Analysis](https://www.youtube.com/watch?v=x3Hl85OBuc0) presentation ::: ## Data World - Mapper 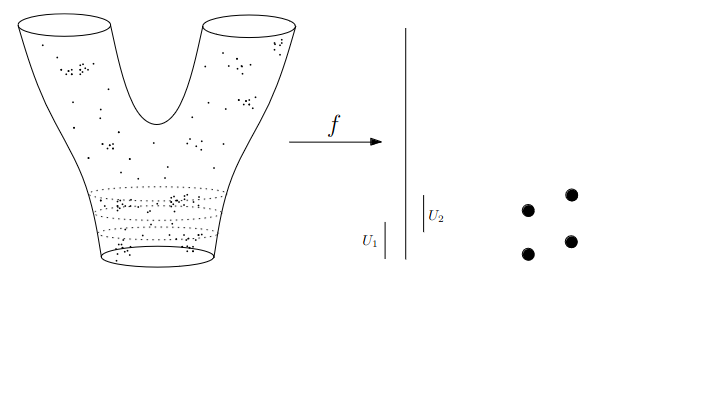{fig-align="center"} :::footer Slides based on Anthony Bak's [Stanford Seminar - Topological Data Analysis](https://www.youtube.com/watch?v=x3Hl85OBuc0) presentation ::: ## Data World - Mapper {fig-align="center"} :::footer Slides based on Anthony Bak's [Stanford Seminar - Topological Data Analysis](https://www.youtube.com/watch?v=x3Hl85OBuc0) presentation ::: ## Data World - Mapper 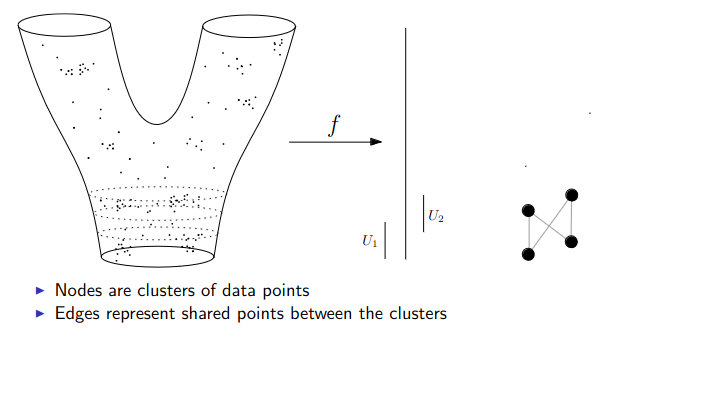{fig-align="center"} :::footer Slides based on Anthony Bak's [Stanford Seminar - Topological Data Analysis](https://www.youtube.com/watch?v=x3Hl85OBuc0) presentation ::: ## Data World - Mapper 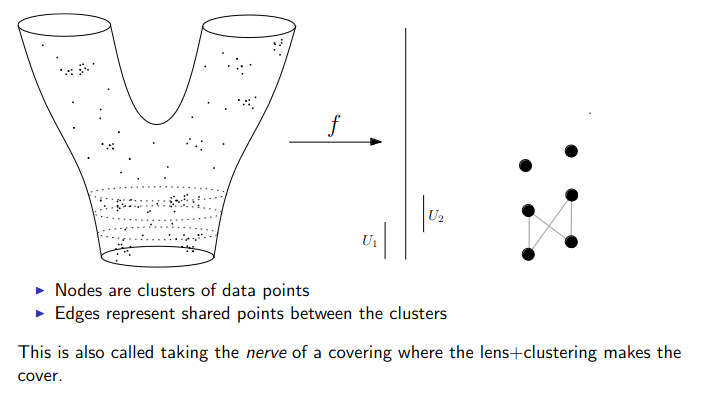{fig-align="center"} :::footer Slides based on Anthony Bak's [Stanford Seminar - Topological Data Analysis](https://www.youtube.com/watch?v=x3Hl85OBuc0) presentation ::: ## Data World - Mapper 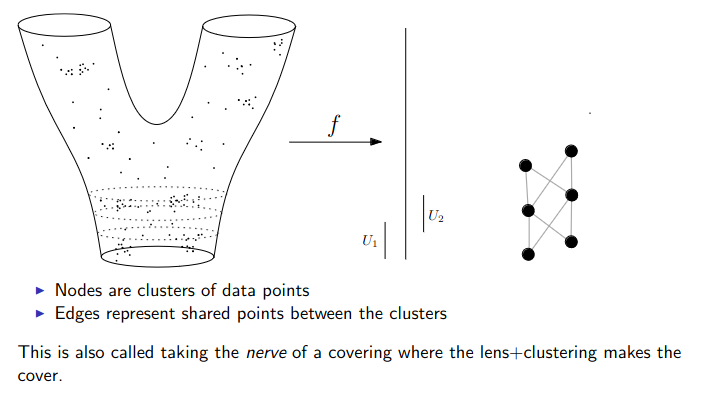{fig-align="center"} :::footer Slides based on Anthony Bak's [Stanford Seminar - Topological Data Analysis](https://www.youtube.com/watch?v=x3Hl85OBuc0) presentation ::: ## Data World - Mapper {fig-align="center"} :::footer Slides based on Anthony Bak's [Stanford Seminar - Topological Data Analysis](https://www.youtube.com/watch?v=x3Hl85OBuc0) presentation ::: ## Data World - Mapper 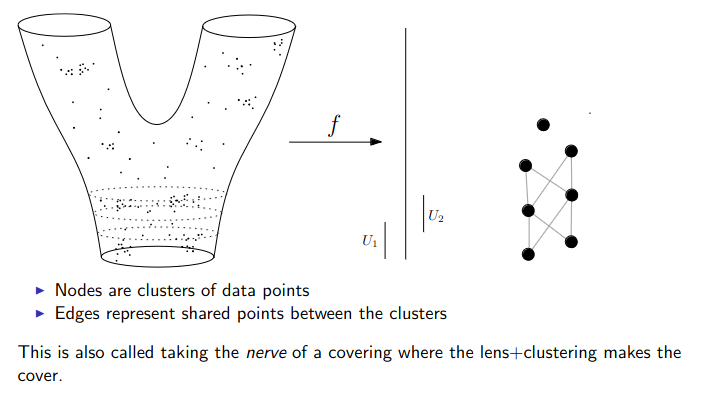{fig-align="center"} :::footer Slides based on Anthony Bak's [Stanford Seminar - Topological Data Analysis](https://www.youtube.com/watch?v=x3Hl85OBuc0) presentation ::: ## Data World - Mapper 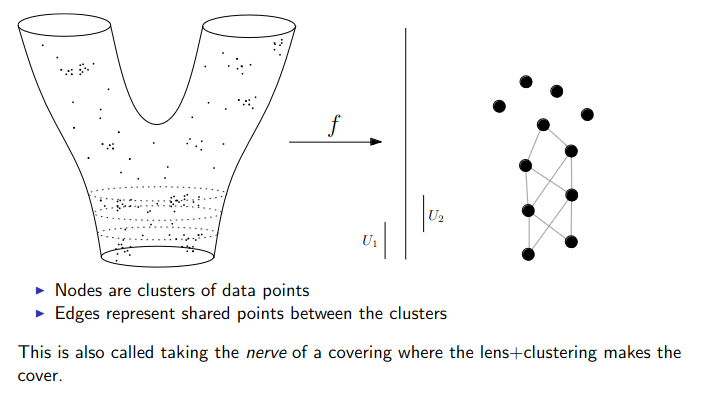{fig-align="center"} :::footer Slides based on Anthony Bak's [Stanford Seminar - Topological Data Analysis](https://www.youtube.com/watch?v=x3Hl85OBuc0) presentation ::: ## Data World - Mapper 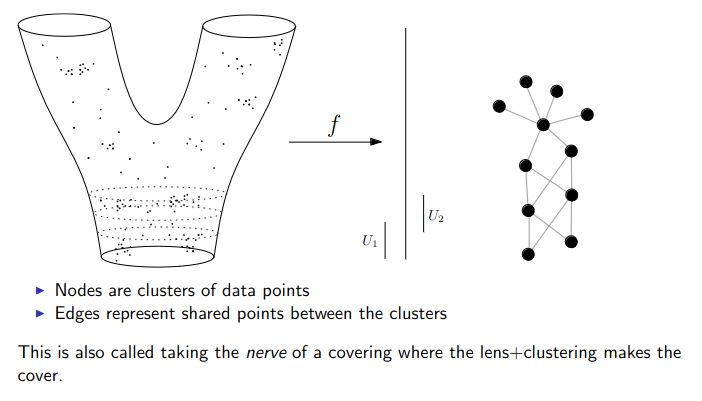{fig-align="center"} :::footer Slides based on Anthony Bak's [Stanford Seminar - Topological Data Analysis](https://www.youtube.com/watch?v=x3Hl85OBuc0) presentation ::: ## Data World - Mapper 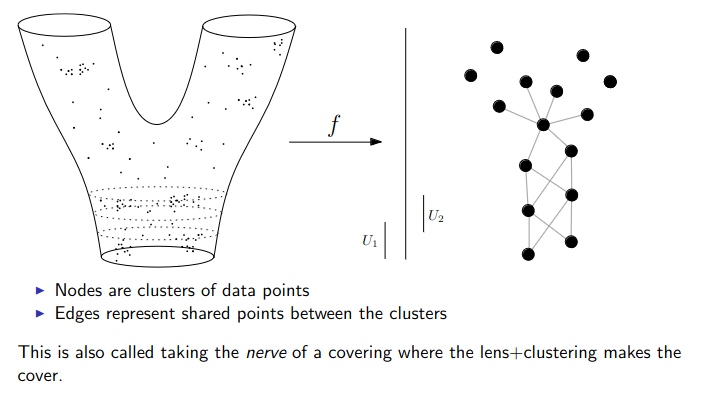{fig-align="center"} :::footer Slides based on Anthony Bak's [Stanford Seminar - Topological Data Analysis](https://www.youtube.com/watch?v=x3Hl85OBuc0) presentation ::: # To look further ## References - For more information about the persistence diagram, see Vincent Divol's [CDS Lunch Seminar](https://cds.nyu.edu/data-science-lunch-seminar-series/) presentation “Quantifying the topology of datasets using Topological Data Analysis” - For more information about the mapper algorithm, see Anthony Bak's [Stanford Seminar - Topological Data Analysis](https://www.youtube.com/watch?v=x3Hl85OBuc0) presentation - To learn more about TDA for Machine Learning, see Bastian Rieck's [Topological Data Analysis for Machine Learning](https://bastian.rieck.me/talks/ecml_pkdd_2020/) tutorial (around 4 hours total) - For a course in TDA, see Raphaël Tinarrage's [Topological Data Analysis with Persistent Homology](https://raphaeltinarrage.github.io/EMAp.html) summer course ## References Some books of interest: - Edelsbrunner, Herbert, and John L. Harer. Computational topology: an introduction. American Mathematical Society, 2022. - Dey, Tamal Krishna, and Yusu Wang. Computational topology for data analysis. Cambridge University Press, 2022. - Carlsson, Gunnar, and Mikael Vejdemo-Johansson. Topological data analysis with applications. Cambridge University Press, 2021. Introductory paper: - Chazal, Frédéric, and Bertrand Michel. "An introduction to topological data analysis: fundamental and practical aspects for data scientists." Frontiers in artificial intelligence 4 (2021): 108. ## References TDA in Python: - For overall TDA data structures and algorithms: [GUDHI](https://gudhi.inria.fr/) (both C++ and Python) or [scikit-tda](https://docs.scikit-tda.org/en/latest/) - For a faster implementation of the Vietoris-Rips: [Ripser.py](https://ripser.scikit-tda.org/en/latest/) - For a faster implementation of the Mapper: [KeplerMapper](https://kepler-mapper.scikit-tda.org/en/latest/) For an open-source library and software collection for topological data analysis and visualization: [Topology ToolKit](https://topology-tool-kit.github.io/) For more examples of TDA aplications: - [DONUT - Database of Original & Non-Theoretical Uses of Topology](https://donut.topology.rocks/) - Applied Algebraic Topology Research Network [seminar series](https://www.aatrn.net/seminar)