Week 12 Lab: Final Project Reminders, Exercise
CS-GY 6313 - Information Visualization
Ryan Kim
New York University
2025-11-21
Week 12 Lab Overview
Today’s Lab Activities
Today we will be a exploring the following topics:
- Group and Mini Projects: Reminders
- Group Project Evaluation
- What makes a Good Project?
- Evaluation Criteria
- Exercise: Evaluating Existing Dashboards
Group and Mini Projects: Reminders
| Assignment | Due Date | Details |
|---|---|---|
| Milestone #4: Second Draft | Dec. 1st | Refined narrative and polished visualizations |
| Mini-Project #3 | Dec. 4th | Network data visualization |
| Final Project Presentations | Dec. 5th | Good luck! |
Group Project Milestone #4: Deliverables
Transform your notebook into a complete article with:
- Title - Clear and informative
- Introduction - Problem, background, motivation, overview of findings
- Data Description - Sources, collection methods, attributes used
- Questions and Findings - For each question:
- Clear question statement
- Polished D3 visualization
- Analysis and interpretation
- Insights and implications
- Conclusion - Summary of findings, recommendations, limitations
Focus on narrative flow - someone unfamiliar with your project should be able to read and understand it.
Group Project Evaluation
What makes a Good Project?
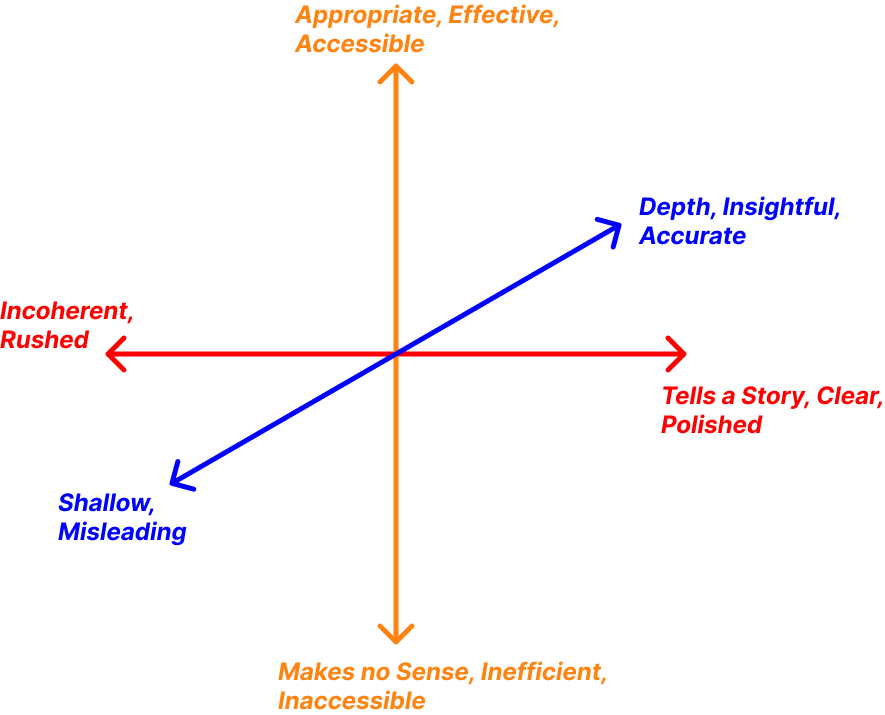
Evaluation Criteria
What Makes a Good Project?
- Clear Problem Statement
- Specific, focused, and well-motivated
- Explains why this matters
- Rich Dataset(s)
- Accessible, complete, and appropriate
- Multiple attributes to explore
- Temporal and/or spatial dimensions
- Coherent Questions
- Form a logical progression (a story)
- Can be answered with visualizations
- Build toward insights
- Appropriate Visualizations
- Match the data and questions
- Well-designed and clearly labeled
- Interactive where it adds value
The best projects:
- Tell a story:
- Explore a compelling problem
- Use appropriate data to explore it
- ask questions that build on each other
- reveal insights that matter.
- Avoid:
- “Let’s visualize this data” without clear questions.
- Questions that are too broad (“what patterns exist?”) or too narrow (“what was the value on Tuesday?”).
Think about what a reader would learn from your project and why they should care.
Evaluation Criteria
Technical Implementation (35%)
- D3 code quality and correctness
- Appropriate use of D3 features
- Interactivity implementation
- Code organization and documentation
Visualization Design (30%)
- Appropriate chart types
- Effective visual encodings
- Clear labels and legends
- Color and layout choices
- Accessibility considerations
Analysis & Insights (20%)
- Question quality and coherence
- Depth of analysis
- Insight generation
- Interpretation accuracy
Communication (10%)
- Narrative flow
- Writing clarity
- Presentation quality
- Professional polish
Teamwork (5%)
- Equal contribution
- Coordination evidence
Lab Exercises:
Evaluating Existing Dashboards
Our Goal: Look at various examples of implementations, and argue how they fit within our standards
For each example:
- Try to understand the purpose behind the dashboard
- Answer the linked questions
- Let’s Discuss!
Approx. ~5mins for each example.
Example #1: Wealth shown to scale
Example #2: WTF Happened In 1971
- URL: https://wtfhappenedin1971.com/
- Google Form: https://forms.gle/zTqK9UhcFFrkCXGj8
Example #3: Locomotion Vault
- URL: https://locomotionvault.github.io/
- Google Form:: https://forms.gle/zvdBTZhyP2FotDmn7
Example #4: after babylon
Example 5: Love Songs
- URL: https://pudding.cool/2024/11/love-songs/
- Google Form: https://forms.gle/9Wjwbf4S5gsywj8W8
Example 6: Coronavirus Tracked
- URL: https://ig.ft.com/coronavirus-chart/?areas=eur&areas=usa&areas=bra&areas=gbr&areas=rus&areas=rou&areasRegional=usny&areasRegional=usla&areasRegional=usnd&areasRegional=usak&areasRegional=usfl&areasRegional=ustn&cumulative=0&logScale=0&per100K=1&startDate=2020-09-01&values=deaths
- Google Form: https://forms.gle/Qt45JHxzAw2kKXE2A
Final Reminders
Resources for You
Group and Mini Projects: Reminders
| Assignment | Due Date | Details |
|---|---|---|
| Milestone #4: Second Draft | Dec. 1st | Refined narrative and polished visualizations |
| Mini-Project #3 | Dec. 4th | Network data visualization |
| Final Project Presentations | Dec. 5th | Good luck! |
REMINDER: Legislative Friday!
- Next class is on the Nov. 26th!
- No Lab!
