Week 8 Lab: Plotting and Troubleshooting GeoJSON with D3
CS-GY 6313 - Information Visualization
2025-10-24
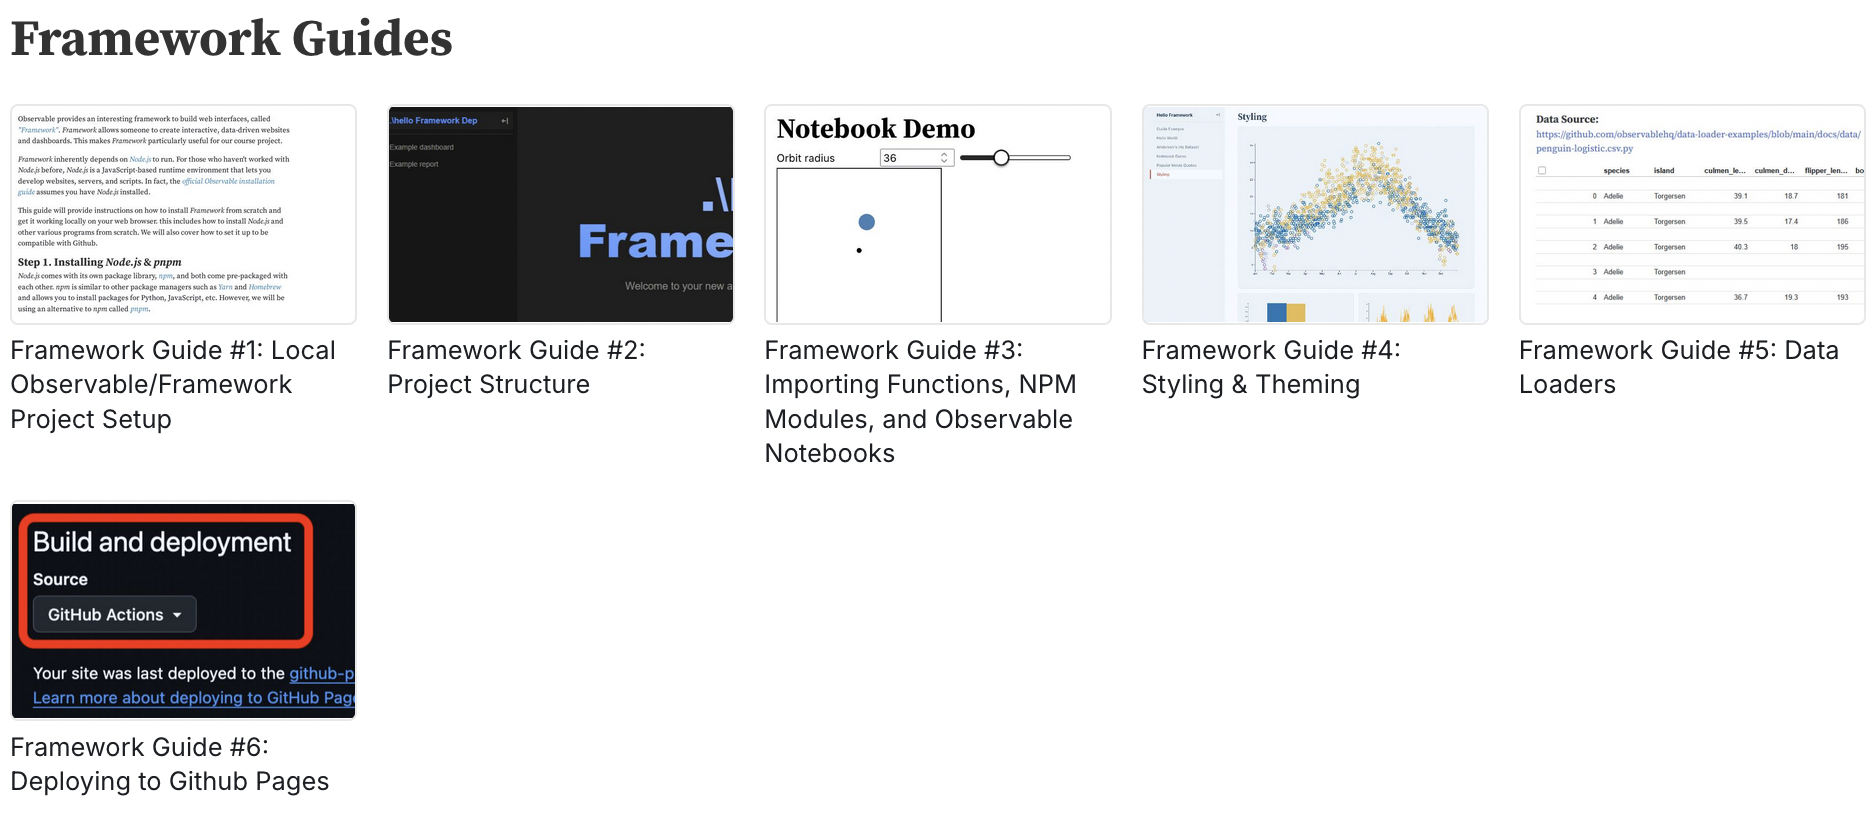
Changes to Framework Guides
| URL To Guides | Example Github Repo | Example Dashboard |
|---|---|---|
| Framework Guides | Repository | Dashboard |
Where can we Find Geodata?
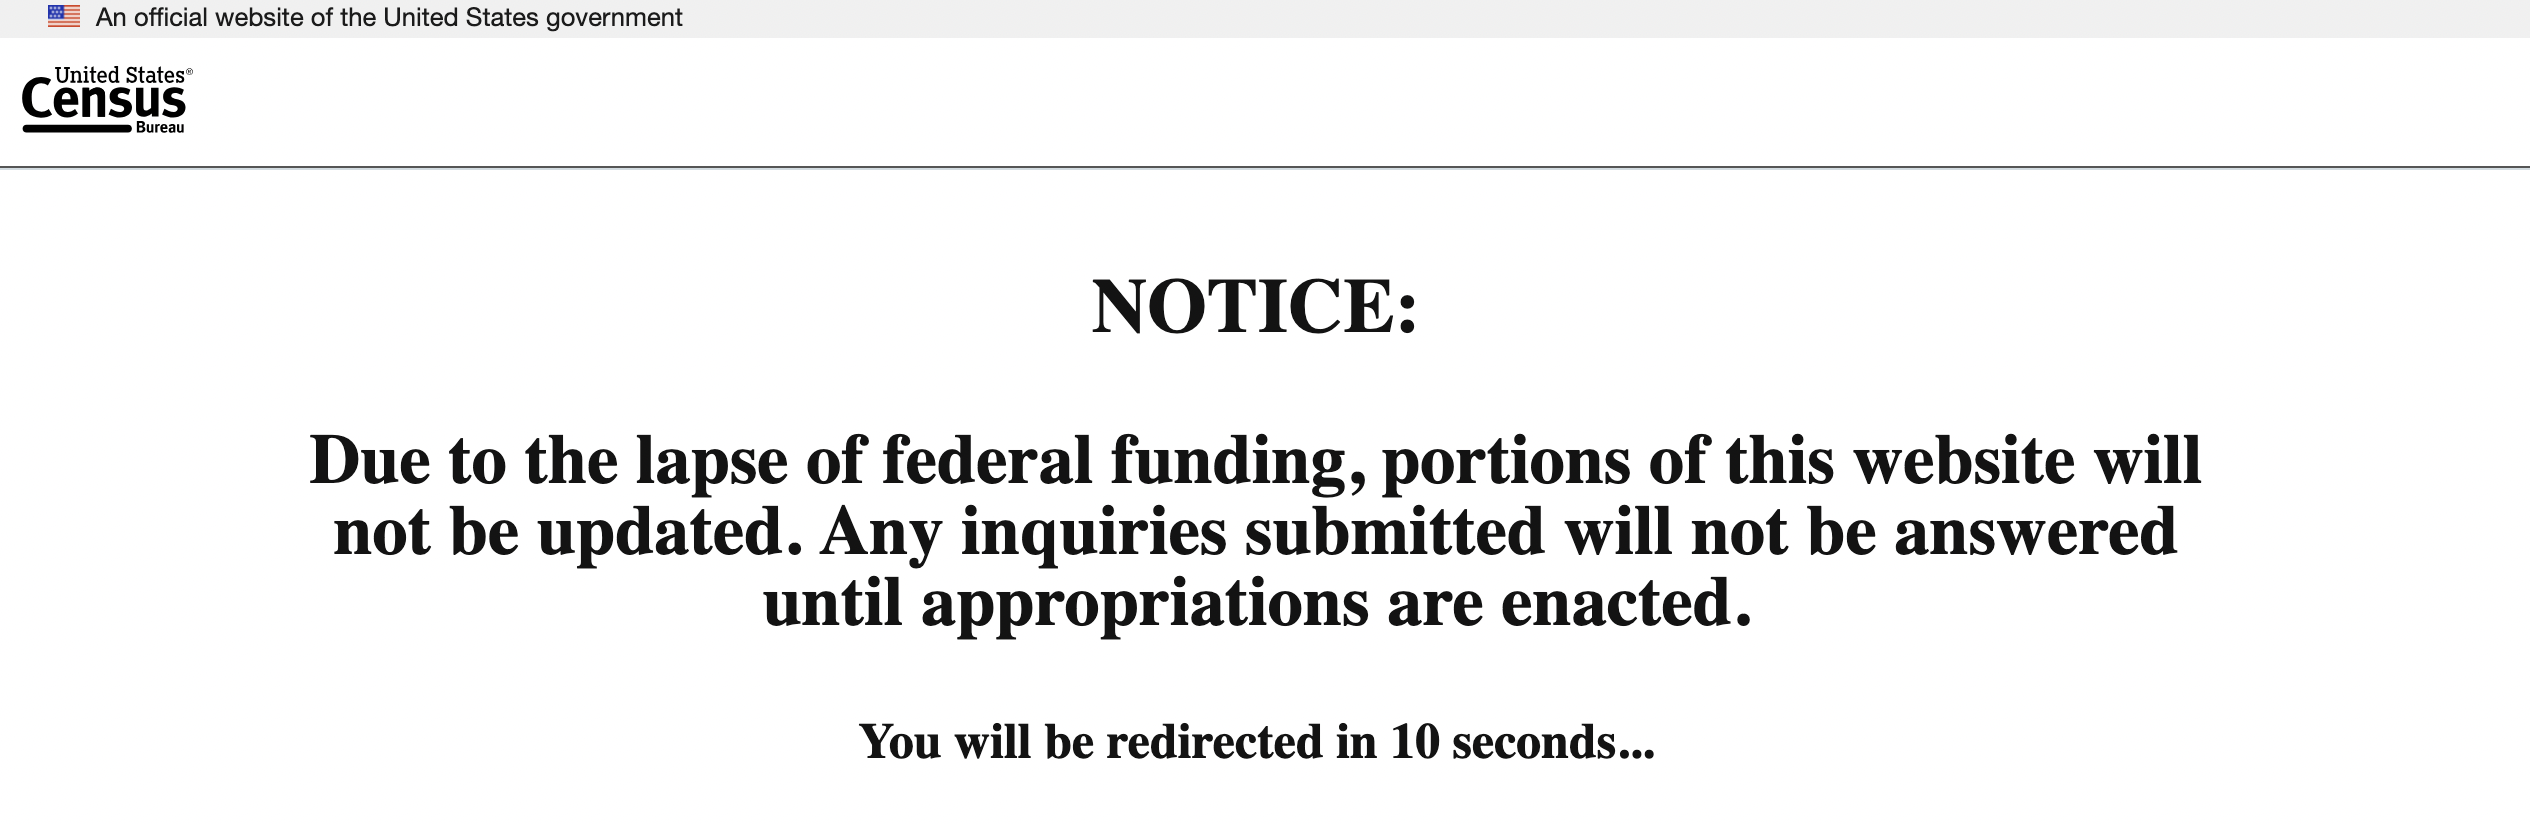
- Older guides will commonly refer you to https://data.census.gov/. But…
- You can also likely find existing GeoJSON files in the wild, such as in Vega-Lite’s pre-existing US-Atlas GeoJSON, but you don’t really have much control over the fidelity and properties of the GeoJSON itself.
Let’s try Steps 1 and 2
Let’s download map data for the US states from https://gadm.org/data.html, then simplify using https://mapshaper.org/.
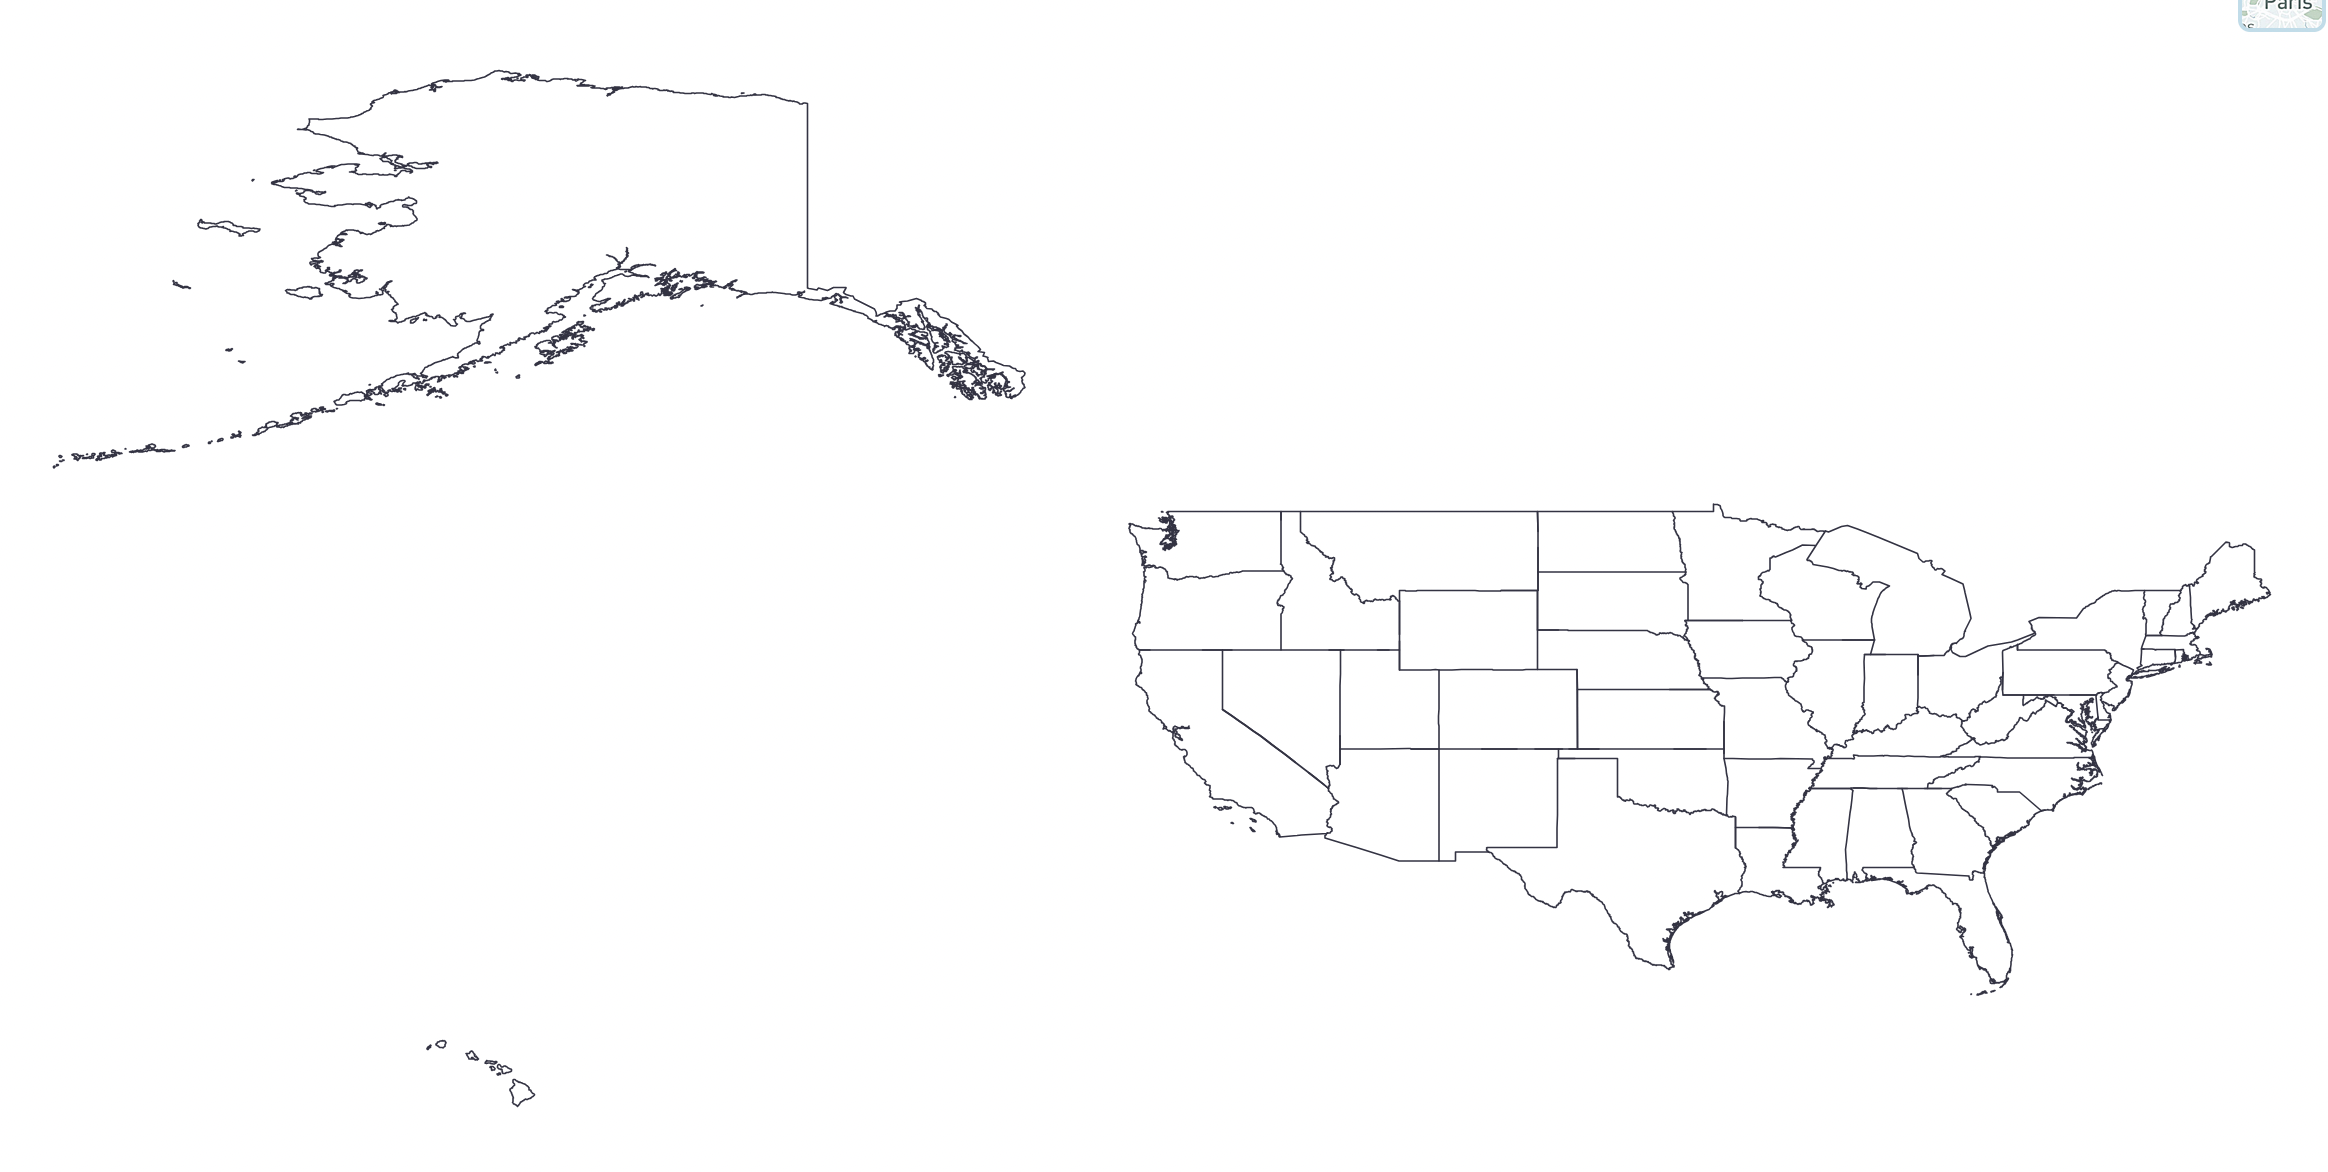
D3 GeoMaps… Wait, What?
// Define parameters, svg, and chart (we've covered this by now a lot)
const width = 400, height = 250, margins=50;

// Create our SVG and Chart
// ...

// Need a projection, with `.scale()`, `.center()`, and `.translate()`
const projection = d3.geoMercator()
  .scale(200)
  .center([-98, 39])  // Lat/Lon of the U.S.
  .translate([width/2, height*0.75]);

/*
// ALTERNATIVE: Let D3 attempt to fit the data
const projection = d3.geoMercator()
  .fitSize([width, height], usa);
*/

// `d3.geoPath()` returns a function that can be called later.
const path = d3.geoPath().projection(projection);

// Render our chart.
chart.append("g")
  .selectAll("path")
  .data(usa.features)
  .enter()
    .append("path")
      .attr("d", path)        // Draw each state
      .attr('fill','#ccc')  // Stylize our states
      .style("stroke", "#000");