VisML Lab Week 5
CS-GY 9223 - Fall 2025
Parikshit Solunke
NYU Tandon School of Engineering
2025-09-29
Recap: Model Interpretability?
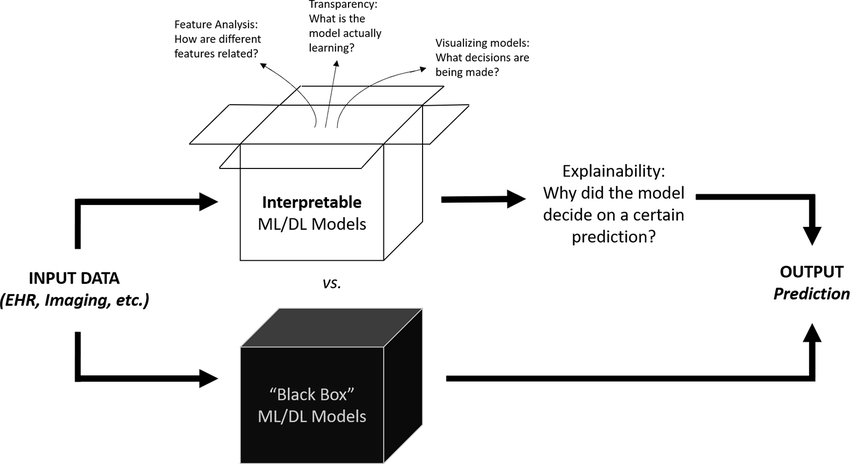
- Black box vs Interpretable models
- Why interpretability matters in ML
- Trade-off: Performance vs Explainability
![]()
Model comparison showing interpretable vs black box approaches
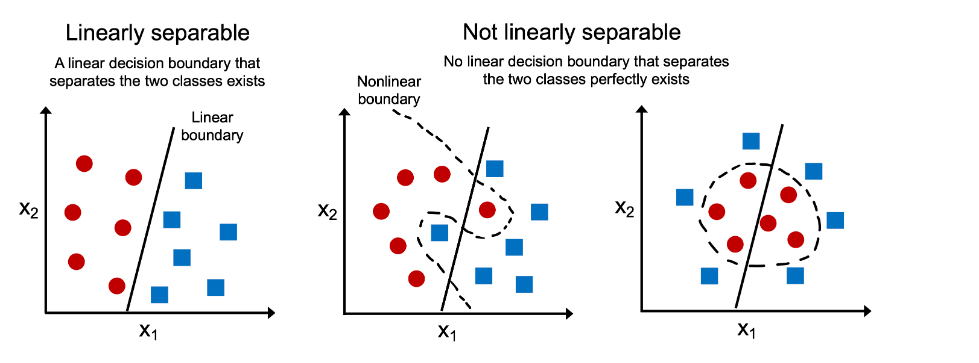
Linear vs Non-Linear Relationships
- Linear: Straight-line relationships
- Non-linear: Curves, thresholds, interactions
- Why linear models miss complex patterns
![]()
Linear vs non-linear data relationships
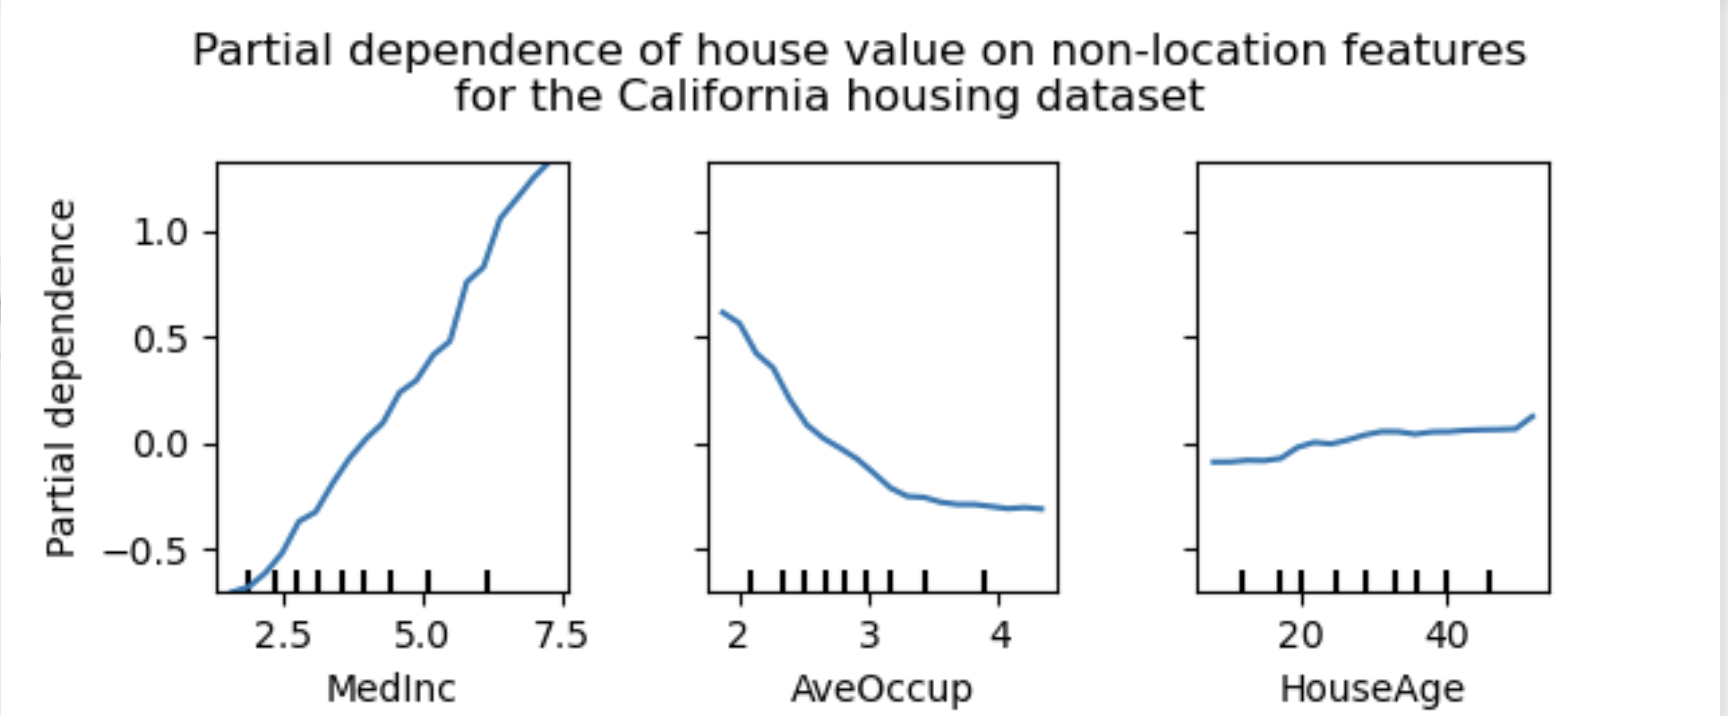
Partial Dependence Plots (PDPs)
- Show isolated effect of one feature
- “What happens when I change X, holding everything else constant?”
- Reveals feature’s contribution to predictions
![]()
Example partial dependence plot
Decision Trees - How They Work
- Series of yes/no questions
- Split data based on feature values
- Each path = decision rule
                        Age > 25?
                       /         \
                   Yes/           \No
                     /             \
            Income > 50K?       Approved: No
               /       \
           Yes/         \No
             /           \
      Approved: Yes   Approved: Maybe
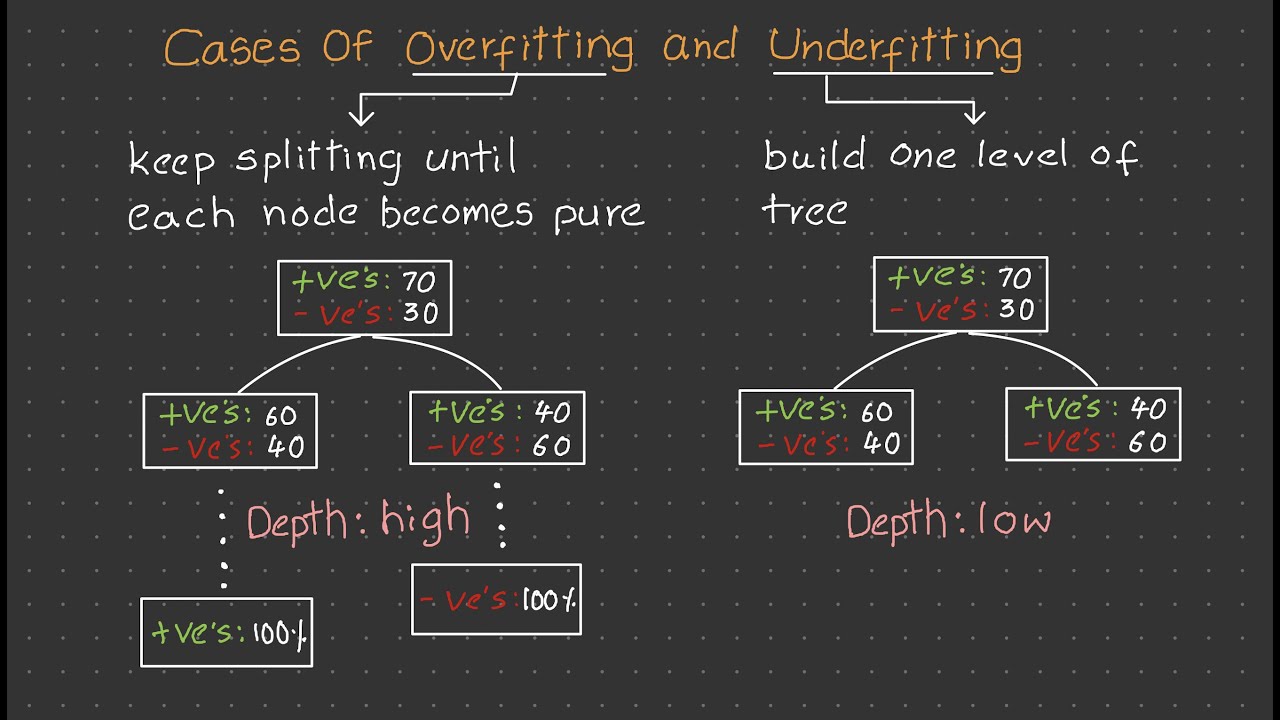
Tree Depth & Overfitting
- Shallow trees: Simple rules, may underfit
- Deep trees: Complex rules, may overfit
- Pruning: Remove unnecessary branches
![]()
Decision trees showing underfitting and overfitting
Comparing Approaches
- GAMs: Smooth curves, feature interactions
- Trees: Hierarchical splits, exact decision paths
- Both provide different types of visual interpretability
| Visual style |
Smooth curves |
Branching diagrams |
| Rule format |
Mathematical relationships |
Logical if-then paths |
| Individual predictions |
Harder to trace |
Easier to follow path |
| Interactions |
Complex interaction plots |
Nested decision splits |
Let’s Start the Lab!
Practice 1: GAMs & Partial Dependence
- Explore non-linear relationships
- Create PDP visualizations
- Compare with linear regression
Practice 2: Decision Trees
- Build and visualize trees
- Extract decision rules
- Experiment with tree depth
Notebook Links: