What we’re given: Test scores (0%-100%) of students plotted against hours studied.
Goal: Determine the correlation between study time and performance.
Answer:
Data domains:
Test scores (Q)
hours studied (Q)
Graph: Scatter Plot
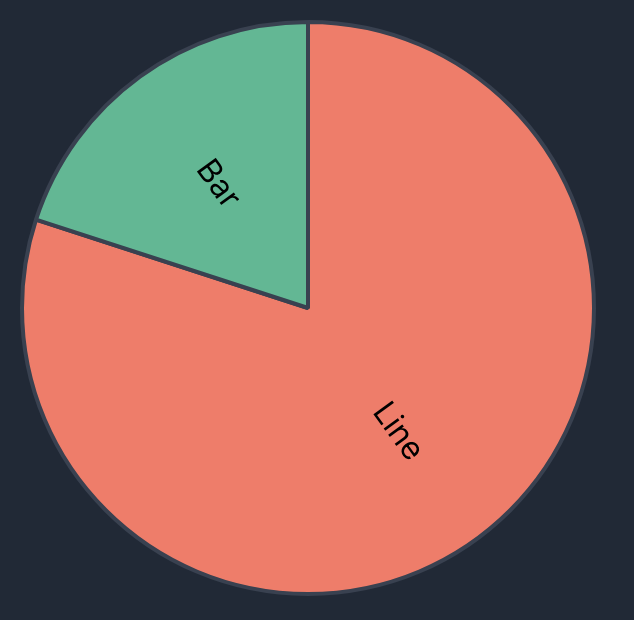
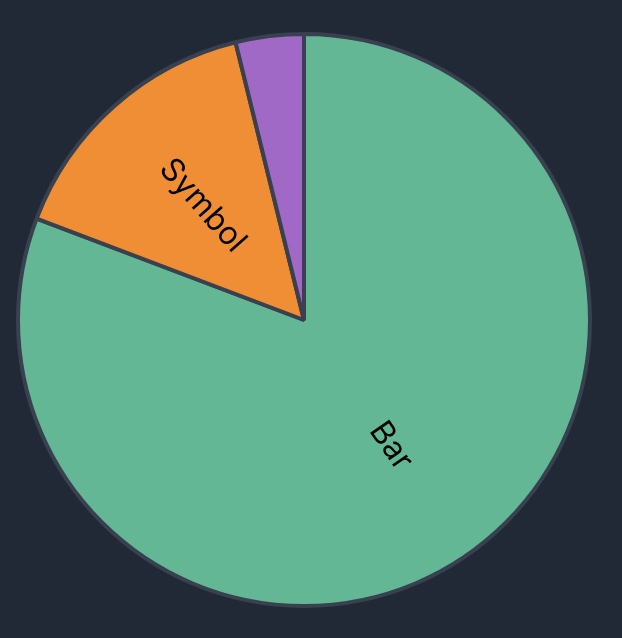
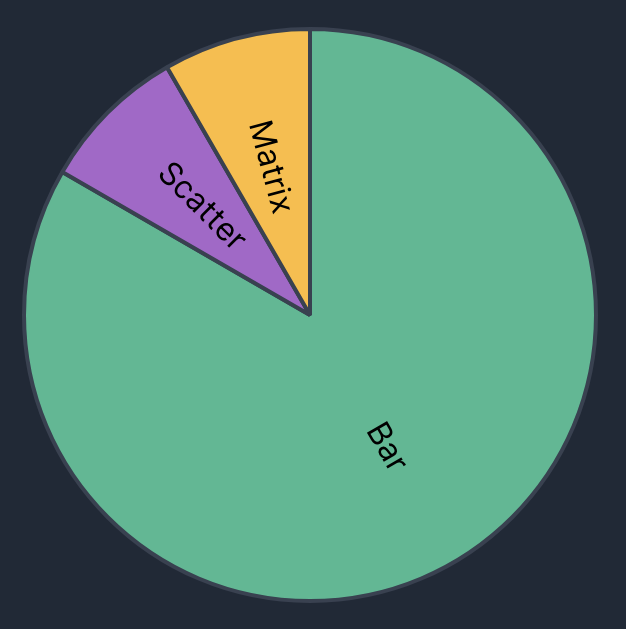
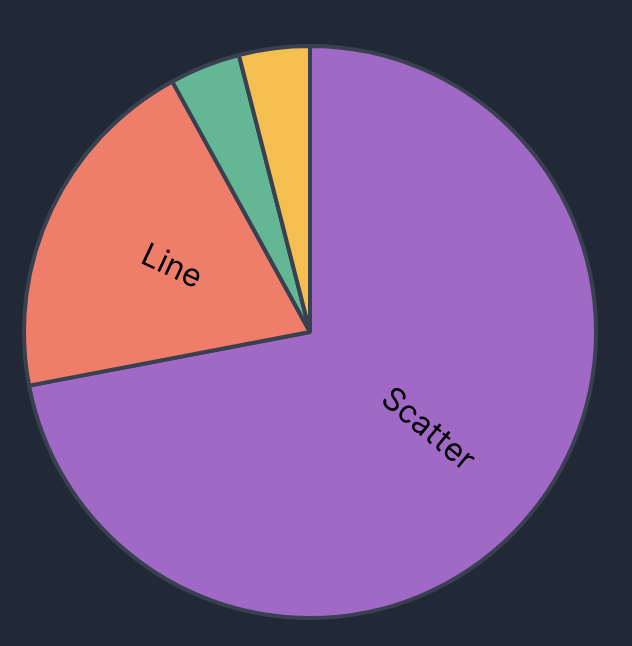
Poll Results from Last Year’s Class (Sep. 19, 2025)
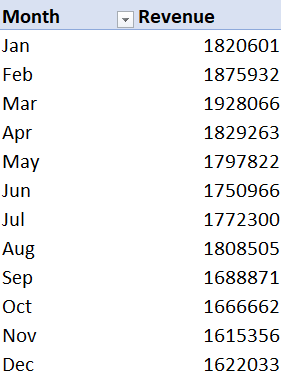
Exercise #1:
Exercise #2:
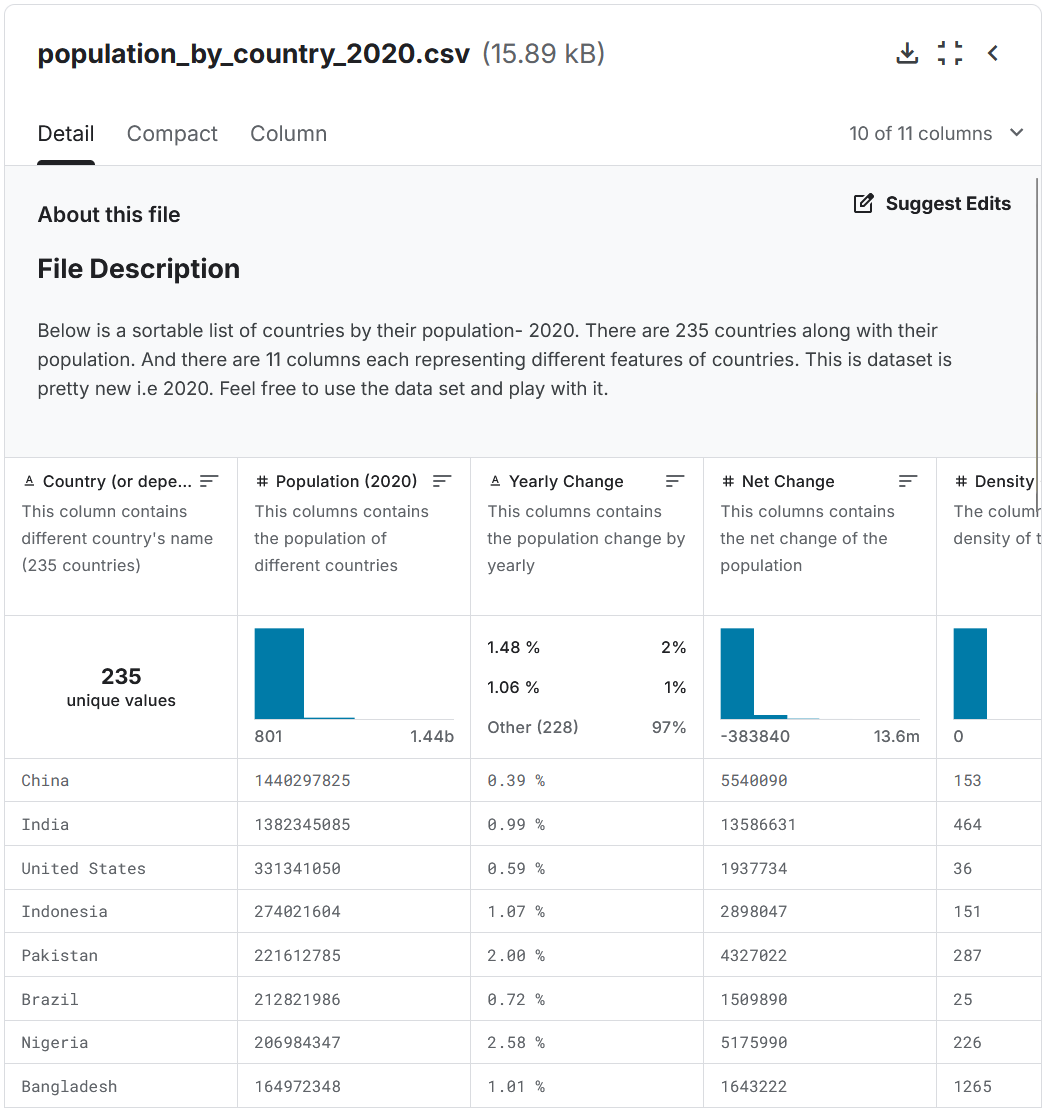
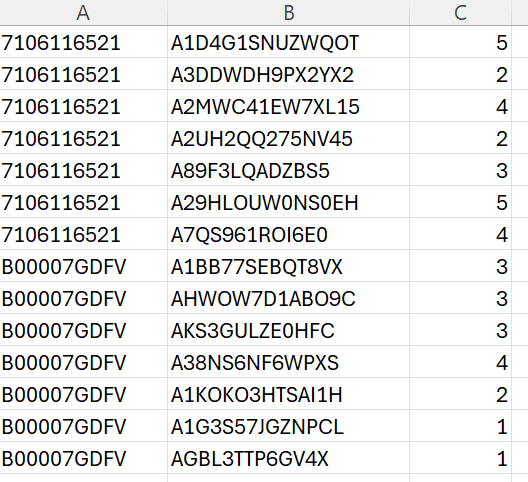
Exercise #3:
Exercise #4:
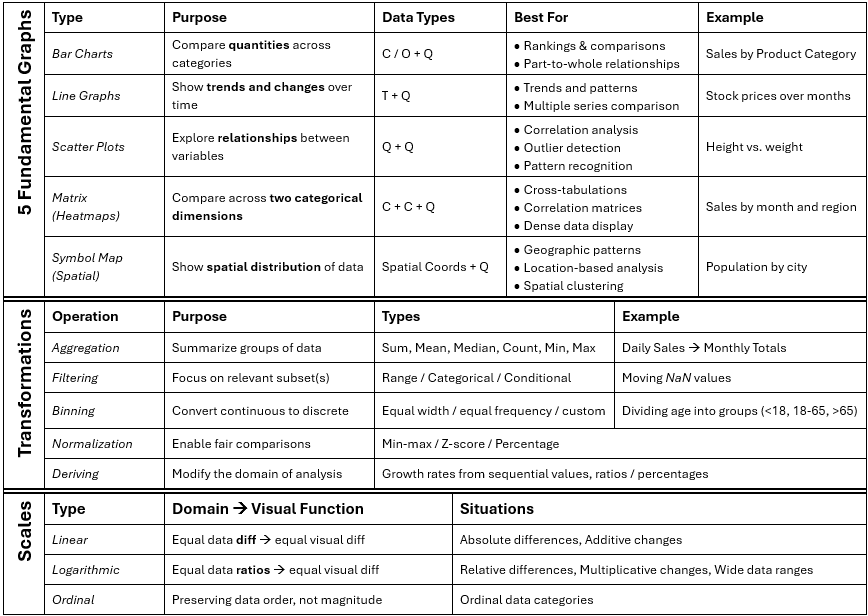
Core Idea: Meaning-Making: Data -> Information
As engineers, designers, and researchers, we must do the work to find meaning within the raw data and interpret them for the benefit of others.
There are many ways to generate viable alternatives charts!
Part 2: Question-Forming Practice
Question-forming?
Rather than generate charts as per usual, we will instead stretch our minds and form our own questions. This is an invaluable skill in most circumstances.
Try to derive as many questions about the data you can form from the data alone.
Feel free to use the question taxonomy table for inspiration.
Consider:
What was this dataset originally used for?
From where and how was the data collected?
Which data types are continuous or discrete? Categorical or quantitative?
Data Features & Their Types
yield: Continuous, Quantitative
variety: Nominal
year: Temporal
site: Nominal
Example questions
Average or median yield per variety
Popularity of barley variety per site
Changes in barley distribution between 1931 and 1932
Question-Laddering as a Strategy
When you are struggling with question-forming, then a useful strategy is to implement question-laddering.
Question-Laddering: Generating complex inquiries by starting with a simpler question and then forming even more simple or more complex questions.
This is an incremental process; rather than attempting to jump the gun, you must start simple and then progressively reach complicated inquiries.
Example using Gapminder Geodata
Take a look at our Gapminder geodata. It’s rather easy to have a simple question like:
Which countries have the highest life expectancy?
Now, let’s consider the next rung of the ladder: How can we make this question more interesting and/or complex?
Which countries have the highest life expectancy?
↓
How does life expectancy differ across regions?
↓
How has life expectancy changed over time across regions?
↓
Is increasing GDP associated with increasing life expectancy?
↓
Does the relationship between GDP and life expectancy differ between regions?
↓
Which countries have unusually high or low life expectancy given their GDP?
Paired Exercise: Question-Laddering with Gapminder (5-10 min.)
IN PAIRS OF TWO OR THREE, take a look at the gapminder data and attempt to form a question ladder.
Form 1-2 questions you have about the data, like we did in the previous paired exercise.
Attempt to form a question ladder that increases in complexity the further down you go.
If you’re struggling, consider the following:
Is the question too simple, or not simple enough?
Can we involve more dimension to our question? (i.e. include one or more features into the question)?
Can we form a hypothesis or prediction of the answer to our question? If a hypothesis can be immediately thought of, then maybe the question is too simple.
Persona-Forming as a Strategy
Another crucial way to help form questions is to adopt personas with motivations.
Let’s take a look at the Paris Airbnb Data, which aggregates data about Airbnb rentals. If we had to form questions, then we might want to think:
This kind of person (Persona):
Might ask (Motivation):
Tourist
Where might I find affordable accommodation?
An Airbnb Code Developer
What characteristics distinguish frequently reviewed listings?
A Paris Resident
Are Airbnb listings concentrated in particular parts of the city?
An Airbnb Host
What appears to distinguish higher-priced listings?
A City-Planner
Are some neighborhoods affected by short-term rentals more than others?
Paired Exercise: Personas and Paris Airbnbs
IN PAIRS OF TWO OR THREE, take on the Personas related to Airbnb above and form 2-3 questions you might be motivated to ask, given the data. Debate about the importance of each question and come to a conclusion about which you’d finally select as your primary dataset question.
End of Lab
Exercise #3 will be posted tonight and will be due on September 24th, 2026 @ 11:59pm!