Week 6 Lab: Intro to Interactions and Deceptive Visualizations
Published:
## Week 6 Lab Overview |User Interface|Graphics Library|Notebook| |:--|:--|:--| |[observablehq.com](https://observablehq.com)|[D3](https://d3js.org/)|[Week 6 Lab Notebook](https://observablehq.com/@rk2546/2025-infovis-cse_week-6-lab)| ### Today's Lab Activities Today we will be a exploring the following topics: 1. Review: HTML DOM and Event Handling 2. Basic Example: Buttons and Observable 3. New Chart: Pie Chart 4. Mouse Interactions 5. Group Activity 6. Wrap up & Sharing ## Resources for You [Notebook Gallery](https://observablehq.com/@rk2546/2025-infovis-cse_notebook-gallery) 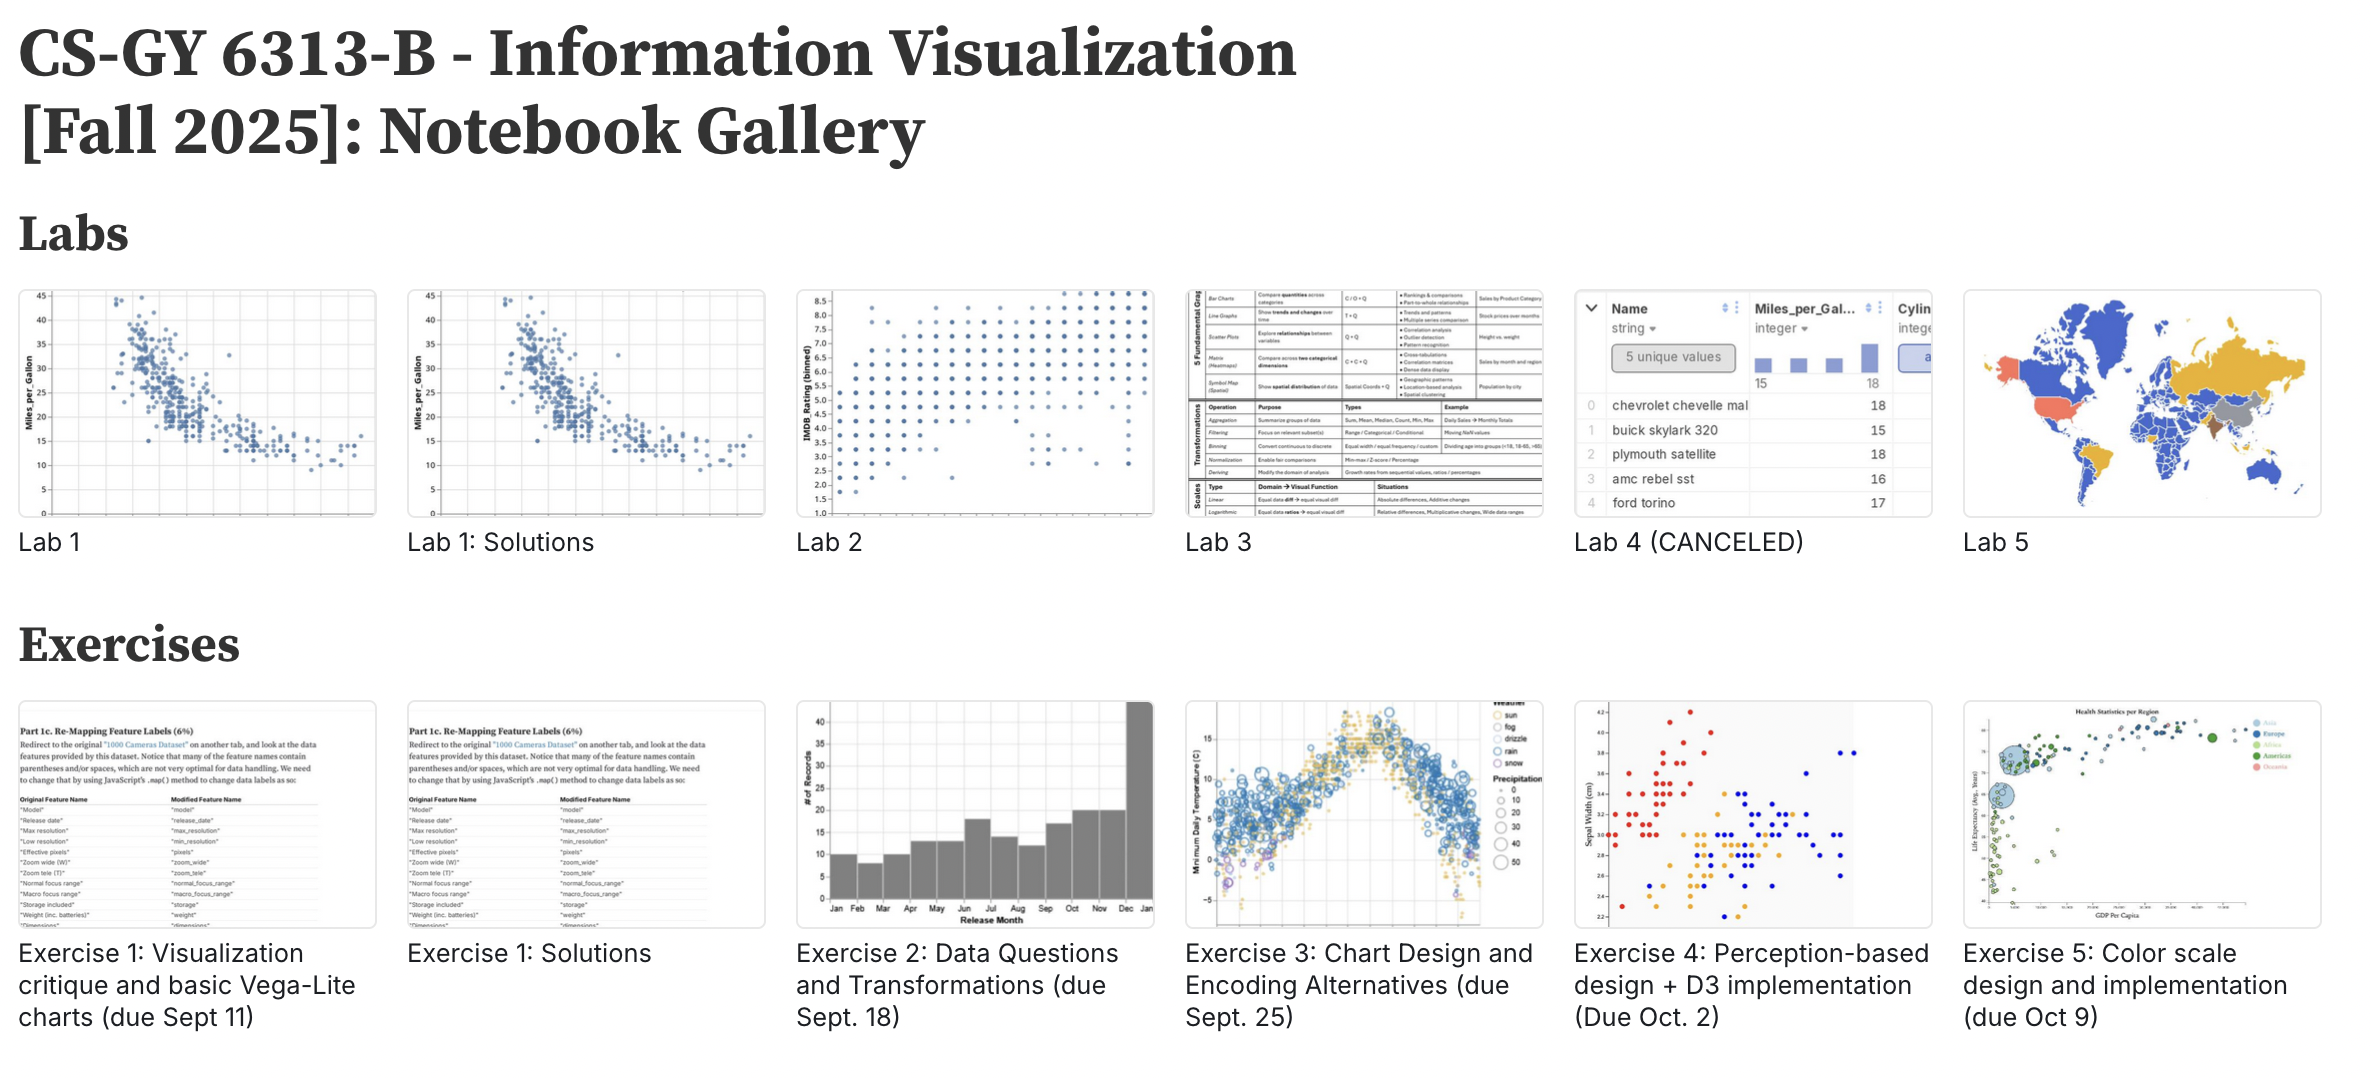{width="100%"} ## Review: DOM and Event Handling 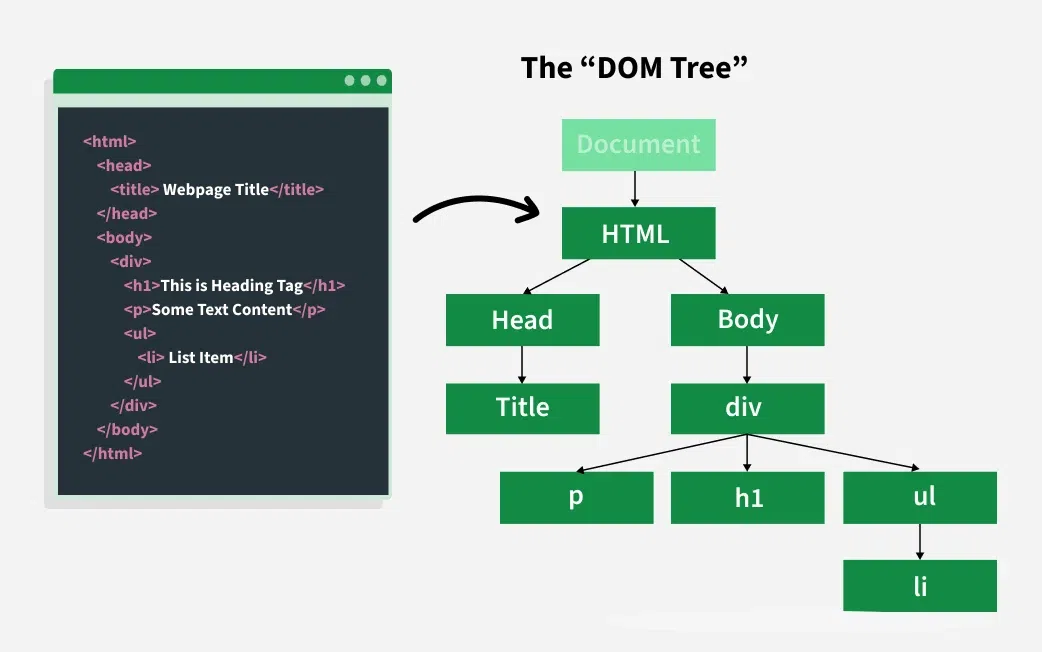{width="1000px"} _Image souce:_ [GeekForGeeks](https://www.geeksforgeeks.org/javascript/dom-document-object-model/) ## Manipulating the DOM :::{.incremental width="75%"} - **Direct manipulation**: Users interact directly with the data in the visualizations (e.g., by clicking the bar or item). This must be implemented as part of the visualization itself and requires JS event handling. - **Indirect manipulation**: Users interact with a separate, but linked interactive element (e.g., search field to filter). In Observable we can use the Input library for the input forms; in normal HTML5 websites, we need use form elements such as `
