
Week 8 Lab: Plotting and Troubleshooting GeoJSON with D3
Published:
### Example GeoJSON ```json Object { type: "FeatureCollection" features: Array(51) [ 0: Object {type: "Feature", geometry: Object, properties: Object} 1: Object {type: "Feature", geometry: Object, properties: Object} 2: Object {type: "Feature", geometry: Object, properties: Object} /// ... ] } ``` ## GeoJSON Markup ```json { "type": "Feature", "geometry": { "type": "Point", "coordinates": [125.6, 10.1] }, "properties": { "name": "Dinagat Islands" } } ```
### One way to think about it: - [GeoJSON Markup Guide](https://geojson.org/) - Your map is a the GeoJSON object, comprising of **Segments** - Each Segment is a **Feature**. - Each Feature has **geometry** and **properties**. - Geometry can be a `Point`, `Polygon`, `MultiPolygon`, etc. - `Properties hold additional info about the Feature (e.g. name, ID, code, zip code). ## Where can we Find Geodata? - Older guides will commonly refer you to [https://data.census.gov/](https://data.census.gov/). But... 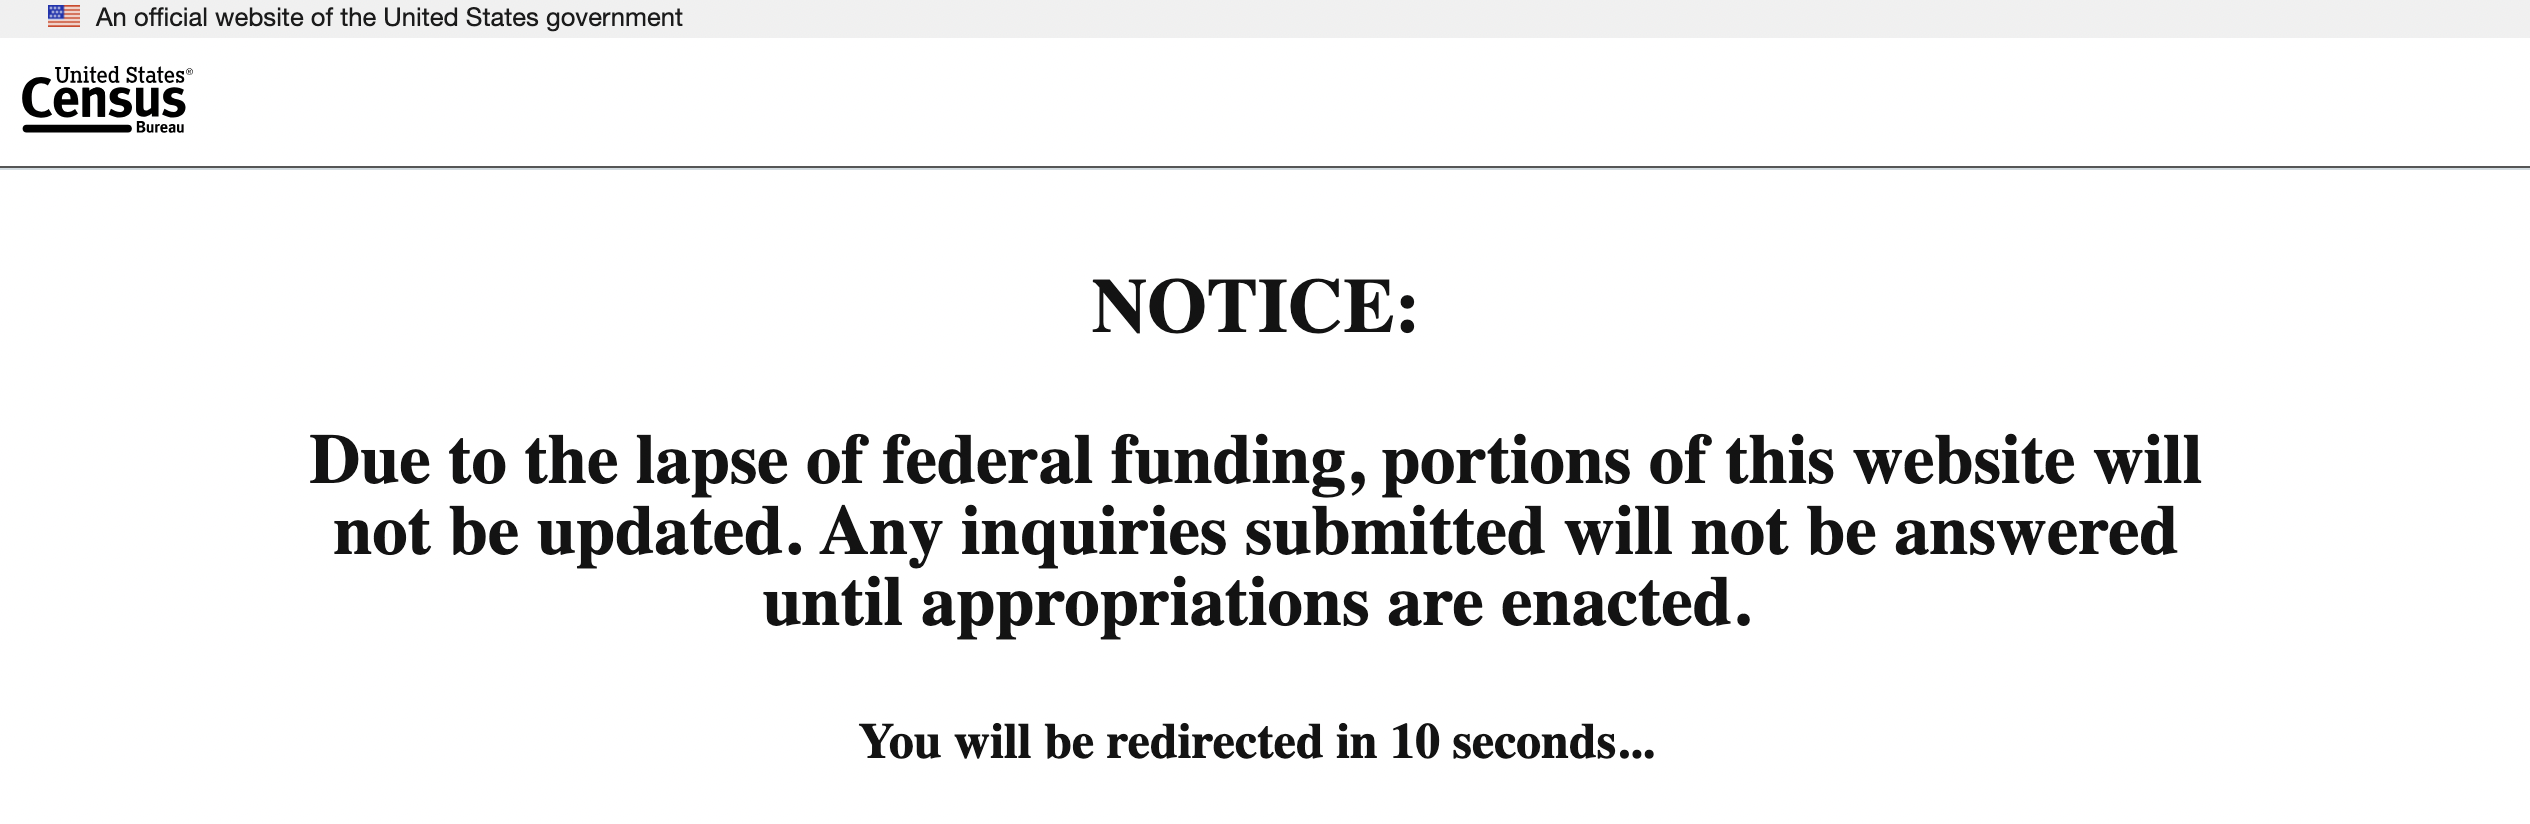{fig-align="center"} - You can also likely find existing GeoJSON files in the wild, such as in [Vega-Lite's pre-existing US-Atlas GeoJSON](https://cdn.jsdelivr.net/npm/us-atlas@3/states-10m.json), but **you don't really have much control over the fidelity and properties of the GeoJSON itself.** --- ### Step 1: Find an appropriate ShapeFile - [https://gadm.org/data.html](https://gadm.org/data.html): An open-source solution that's freely accessible for academic and non-commercial usage. Recommended to download by country. - [https://www.naturalearthdata.com/](https://www.naturalearthdata.com/downloads/): A sizeable repository of ShapeFiles for world regions. ### Step 2: Simplify and convert from ShapeFile to GeoJSON - [https://mapshaper.org/](https://mapshaper.org/) - [https://www.qgis.org/](https://www.qgis.org/) ### Step 3: Load, understand, and troubleshoot your GeoJSON - Invert Latitude and Longitude Coordinates - Reverse GeoJSON "Winding Order" ## Let's try Steps 1 and 2 Let's download map data for the US states from [https://gadm.org/data.html](https://gadm.org/data.html), then simplify using [https://mapshaper.org/](https://mapshaper.org/). 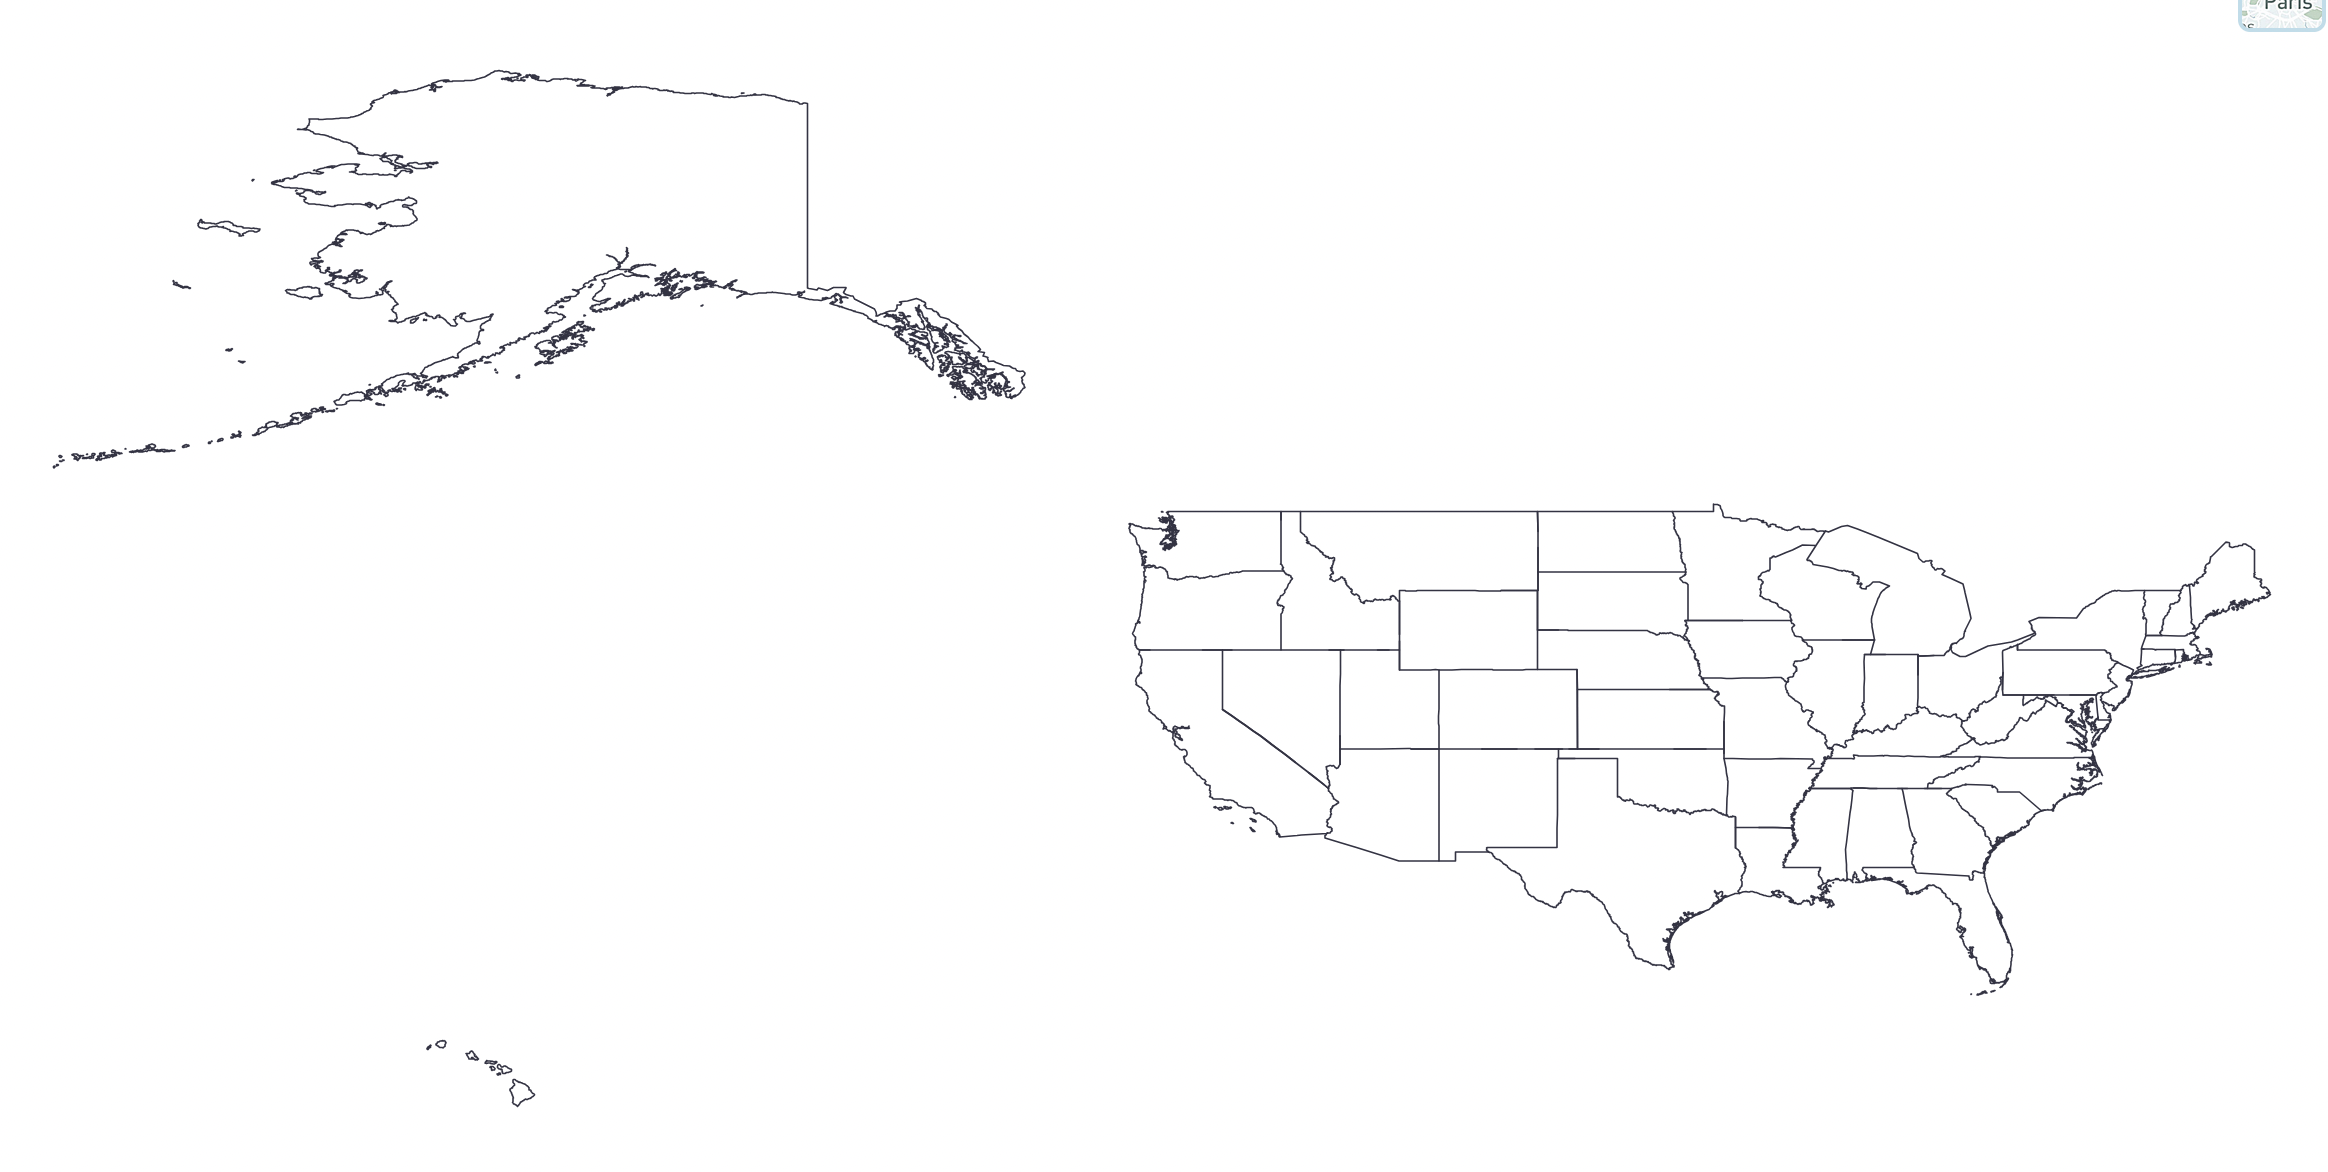{width=100%} ## D3 GeoMaps ```js // Define parameters, svg, and chart (we've covered this by now a lot) const width = 400, height = 250, margins=50; // Create our SVG and Chart // ... // Need a projection, with `.scale()`, `.center()`, and `.translate()` const projection = d3.geoMercator() .scale(200) .center([-98, 39]) // Lat/Lon of the U.S. .translate([width/2, height*0.75]); /* // ALTERNATIVE: Let D3 attempt to fit the data const projection = d3.geoMercator() .fitSize([width, height], usa); */ // `d3.geoPath()` returns a function that can be called later. const path = d3.geoPath().projection(projection); // Render our chart. chart.append("g") .selectAll("path") .data(usa.features) .enter() .append("path") .attr("d", path) // Draw each state .attr('fill','#ccc') // Stylize our states .style("stroke", "#000"); ``` ## D3 GeoMaps... Wait, What? :::{.columns} ::::{.column width=50%} ```js // Define parameters, svg, and chart (we've covered this by now a lot) const width = 400, height = 250, margins=50; // Create our SVG and Chart // ... // Need a projection, with `.scale()`, `.center()`, and `.translate()` const projection = d3.geoMercator() .scale(200) .center([-98, 39]) // Lat/Lon of the U.S. .translate([width/2, height*0.75]); /* // ALTERNATIVE: Let D3 attempt to fit the data const projection = d3.geoMercator() .fitSize([width, height], usa); */ // `d3.geoPath()` returns a function that can be called later. const path = d3.geoPath().projection(projection); // Render our chart. chart.append("g") .selectAll("path") .data(usa.features) .enter() .append("path") .attr("d", path) // Draw each state .attr('fill','#ccc') // Stylize our states .style("stroke", "#000"); ``` :::: ::::{.column width=50%} {fig-align="center"} :::: ::: ## Troubleshooting GeoJSON ### Inverted Latitude and Longitude Coordinates Sometimes, your GeoJSON will have inverted coordinates. **D3 expects coordinates to be `[longitude, latitude]`: > Point coordinates are in x, y order (easting, northing for projected coordinates, longitude, and latitude for geographic coordinates) - [specs](https://www.rfc-editor.org/rfc/rfc7946#section-1.3)
### Incorrect "Winding Order" GeoJSON has an unspoken property called the "winding order". Basically: - Outer rings (the main polygon) should be **counterclockwise** (CCW). - Inner rings (holes) should be **clockwise** (CW). You may produce weird bugs if the winding order is reversed. ## Projection Types in D3 :::{.columns} ::::{.column width="33%"} ### Azumithal Projections ([documentation](https://d3js.org/d3-geo/azimuthal)) - `d3.geoAzimuthalEqualArea()` - `d3.geoAzimuthalEquidistant()` - `d3.geoOrthographic()` :::: ::::{.column width="33%"} ### Conic Projections ([documentation](https://d3js.org/d3-geo/conic)) - `d3.geoConicConformal()` - `d3.geoConicEqualArea()` - `d3.geoAlbers()` - US-centric! :::: ::::{.column width="33%"} ### Cylindrical Projections )([documentation](https://d3js.org/d3-geo/cylindrical)) - `d3.geoMercator()` - `d3.geoEquirectangular()` - `d3.geoEqualEarth()` :::: ::: ## Practice: Produce 3 Graphs (15mins) Attempt to generate the geodata of 3 separate countries other than the USA. You can use any of the references mentioned before for getting your ShapeFiles, converting them into GeoJSON, and troubleshooting their issues upon importing them. - Try playing around with different geometries, ouside of just country borders. - Try different projection types provided by D3 ## Final Reminders & Checks - [**Lab Feedback Form**](https://forms.gle/ddJ4tXX2bBbooARJ6) - Due Anytime (optional) - **Data Analysis & Sketches** - Due Nov 3 @ 11:59pm - Data tables and visualization sketches. - **Mini-Project #1**: Due on Nov 6 @ 11:59pm