Urban Visualization II

Form, Design & Simulation (3D + Impact) - CS-GY 6313 - Fall 2026

Claudio Silva

2026-11-06

Welcome to the Third Dimension

Our Journey Through Geovisualization

Week 8: 2D Static Maps
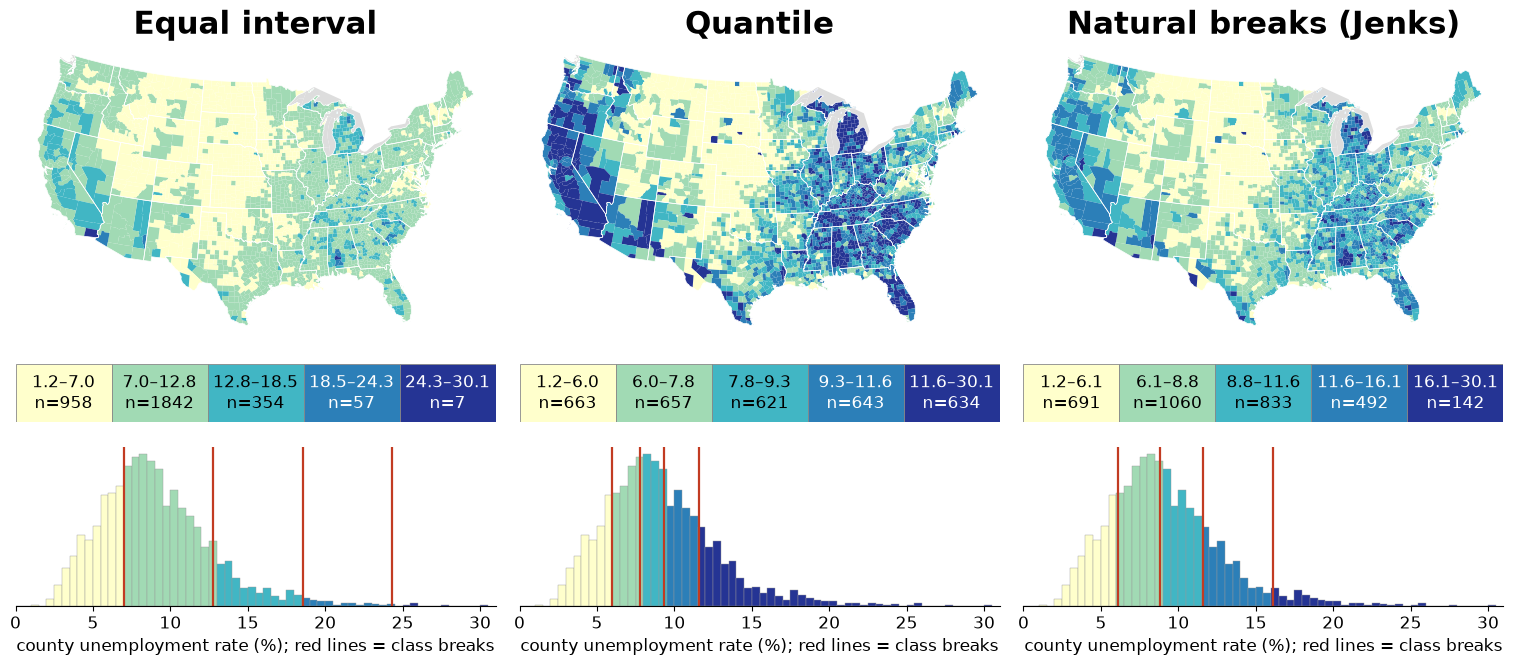
Equal-interval, quantile and natural-breaks choropleths of the same data

Projection, normalization, classing

Week 9: 2D + Time

TaxiVis: linked map and chart views

Urban flows, interactivity, linked views

Week 10: 3D + Simulation
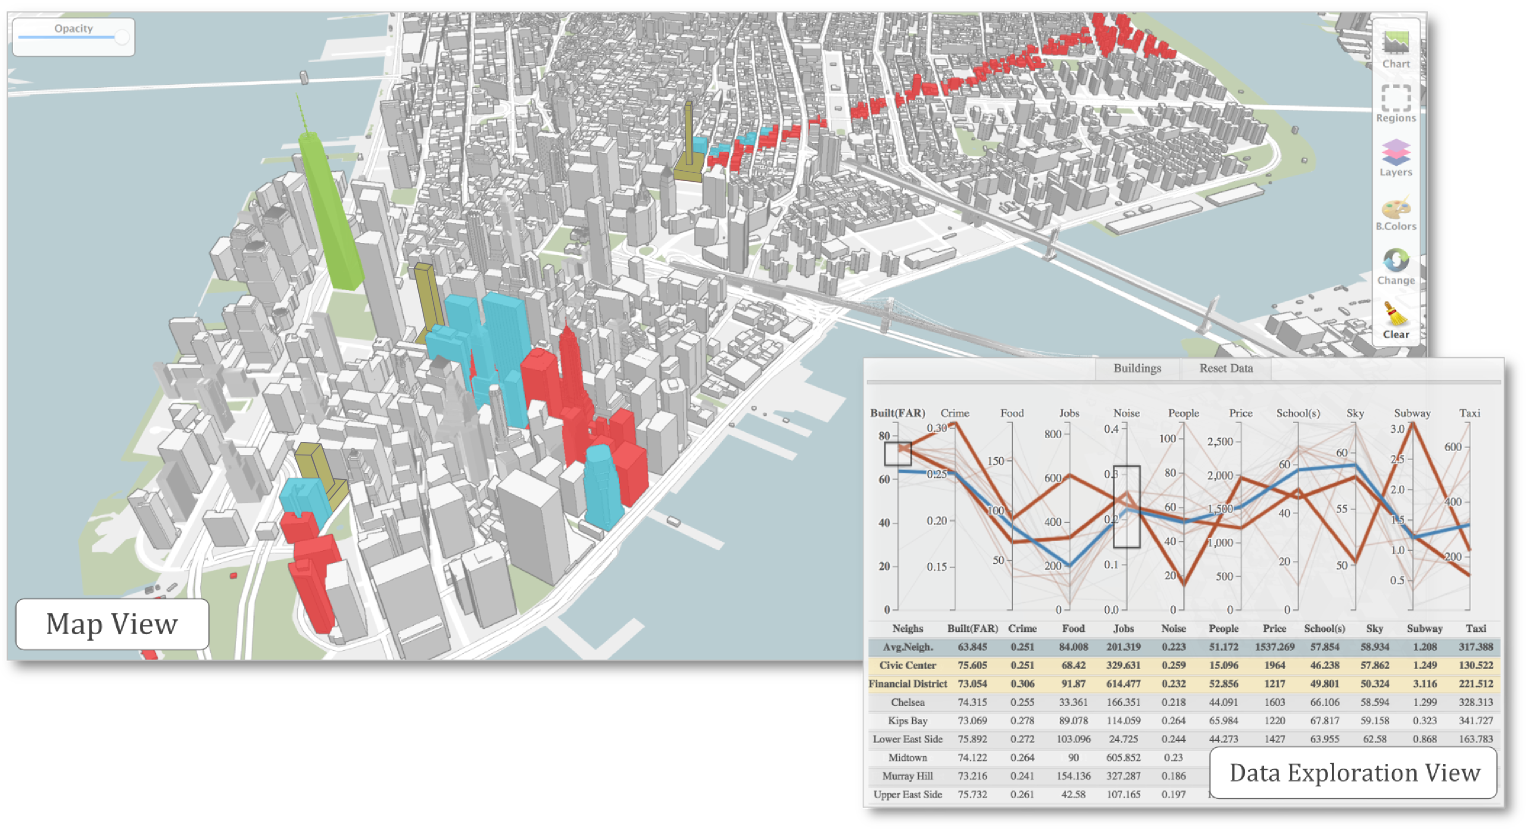
Urbane: 3D city model linked to a data exploration view

Built environment, form, impact analysis

Today’s Focus: The Built Environment

From flat maps to the three-dimensional form of the city

  • Week 8: Geography as abstract areas and boundaries
  • Week 9: Movement and flows across 2D space
  • Week 10: Physical structures: buildings, streets, skylines

Today’s Goal:

Explore how 3D visualization supports urban planning, architectural design, and impact simulation.

Part 1: Why 3D? The Human Experience

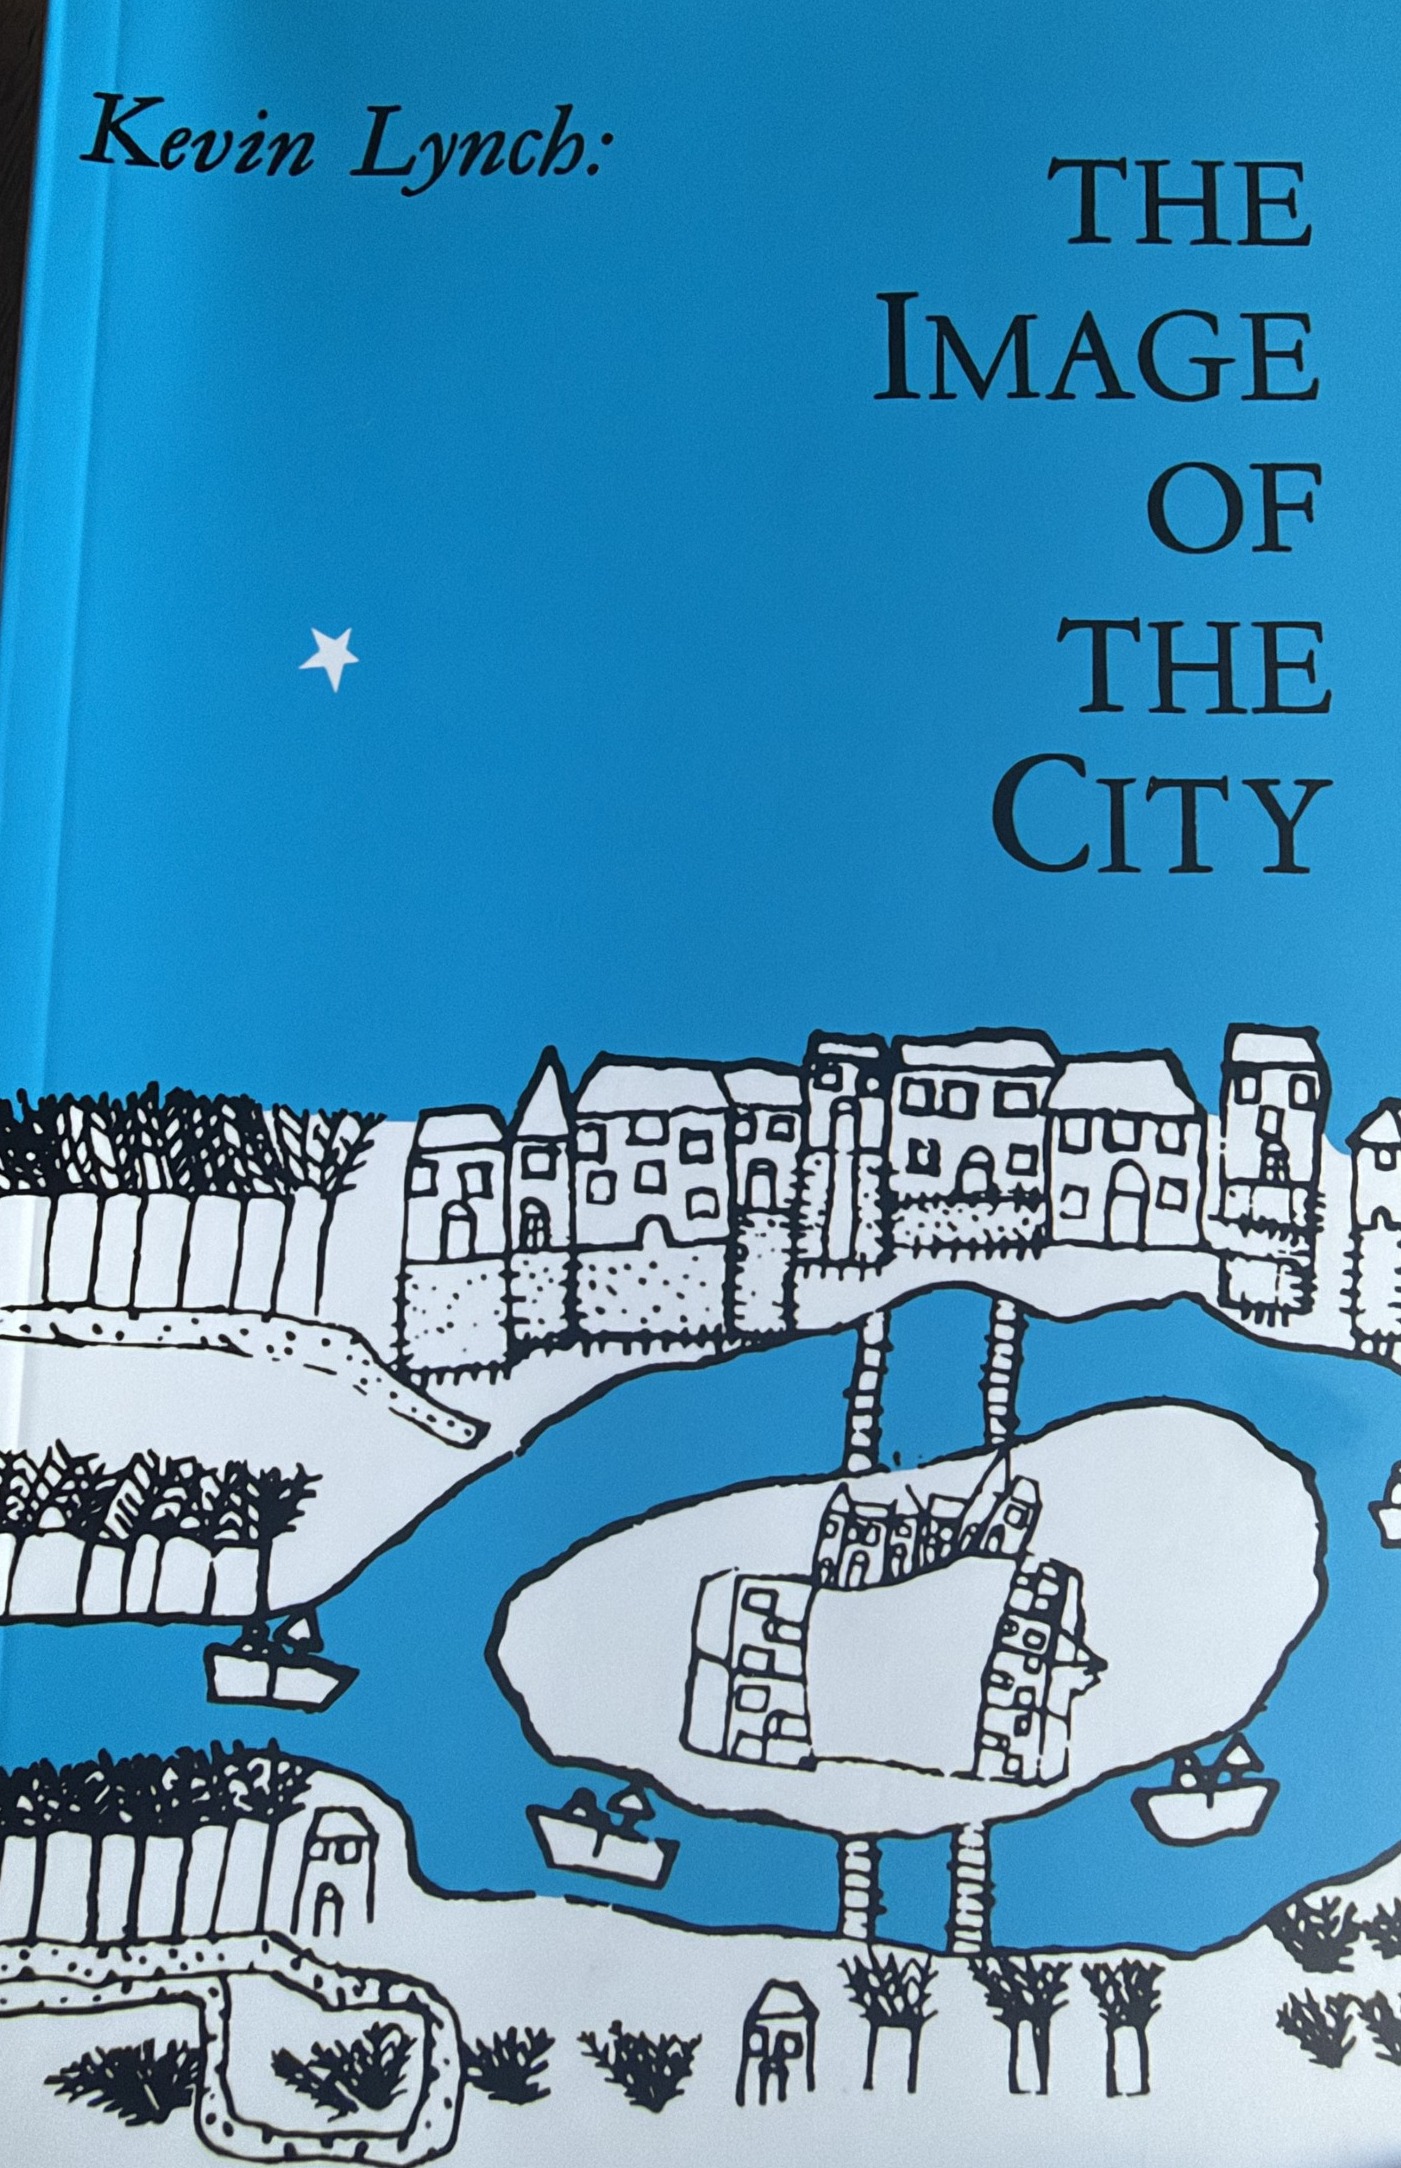
Kevin Lynch’s “Image of the City” (1960)

The Fundamental Question:

How do people mentally map a city?

Lynch’s Answer:

Not through abstract 2D maps, but through five types of elements that we experience in 3D.

A city is legible when those elements are easy to identify and connect.
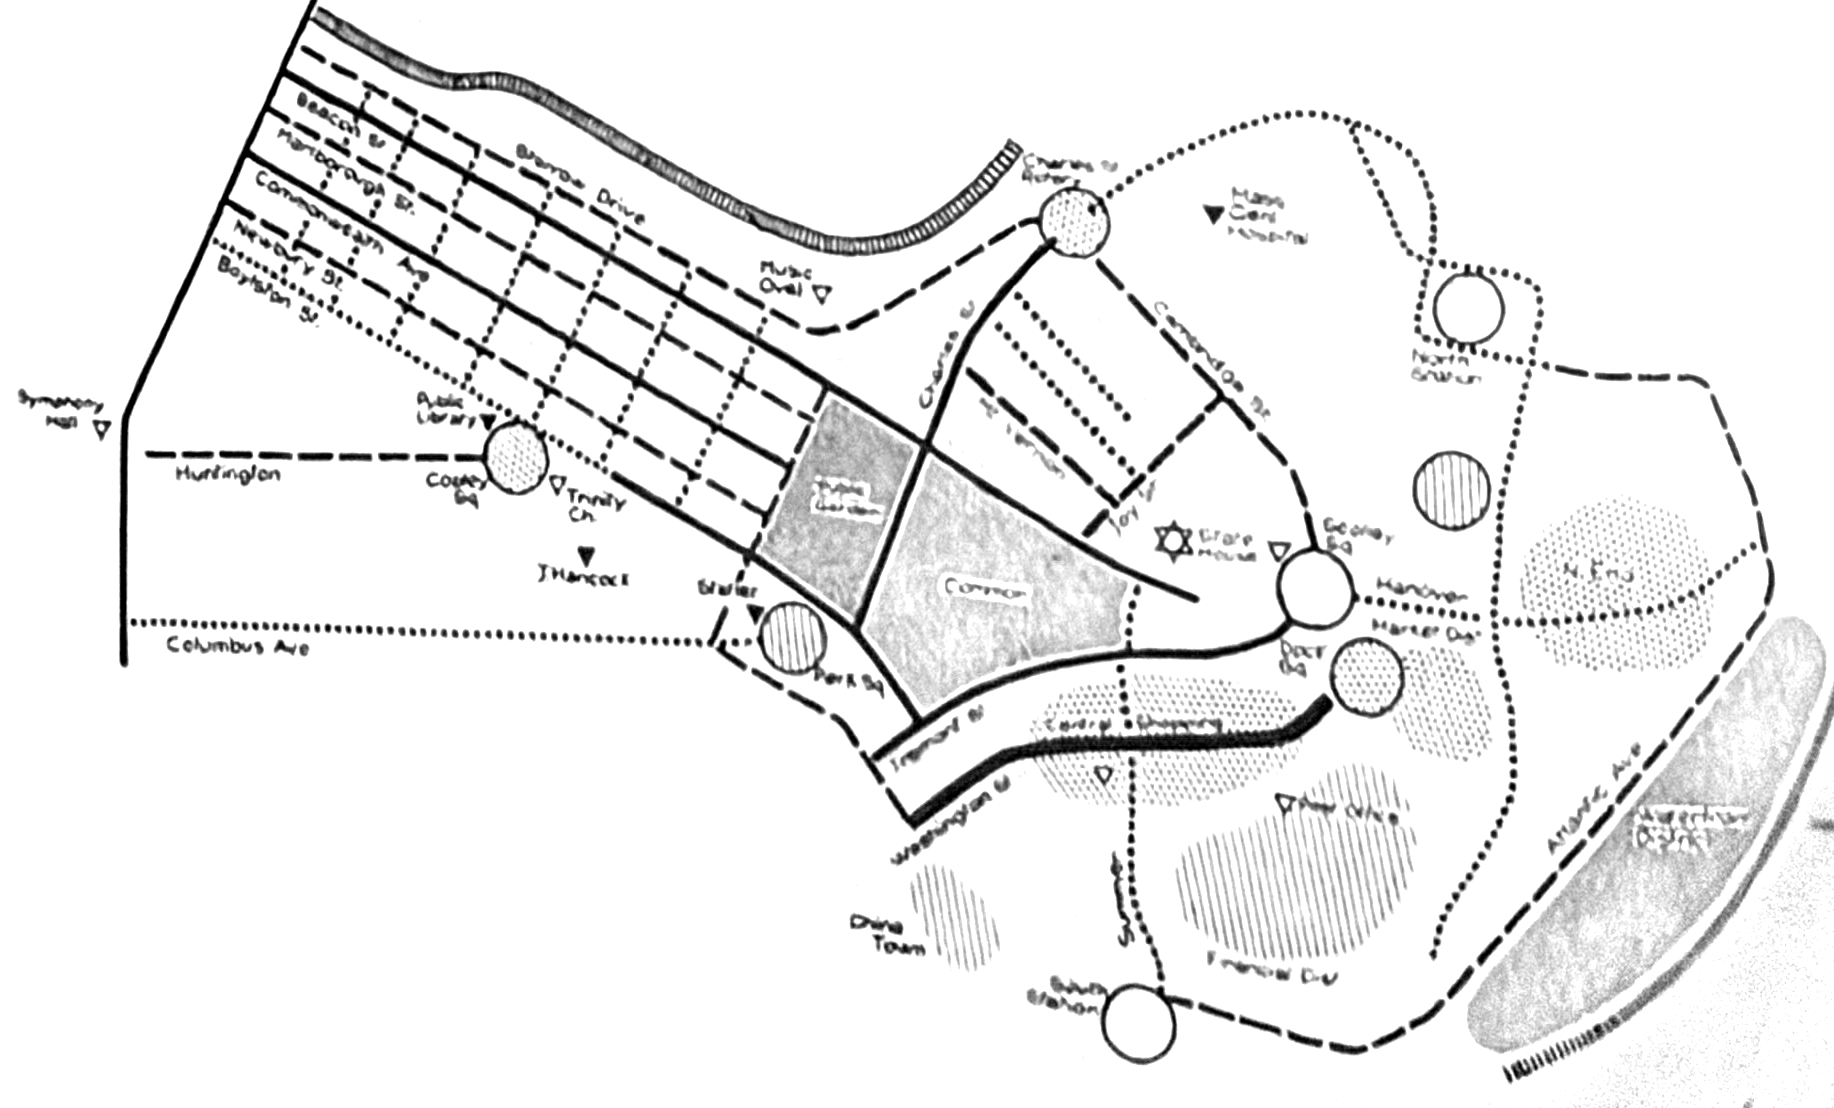
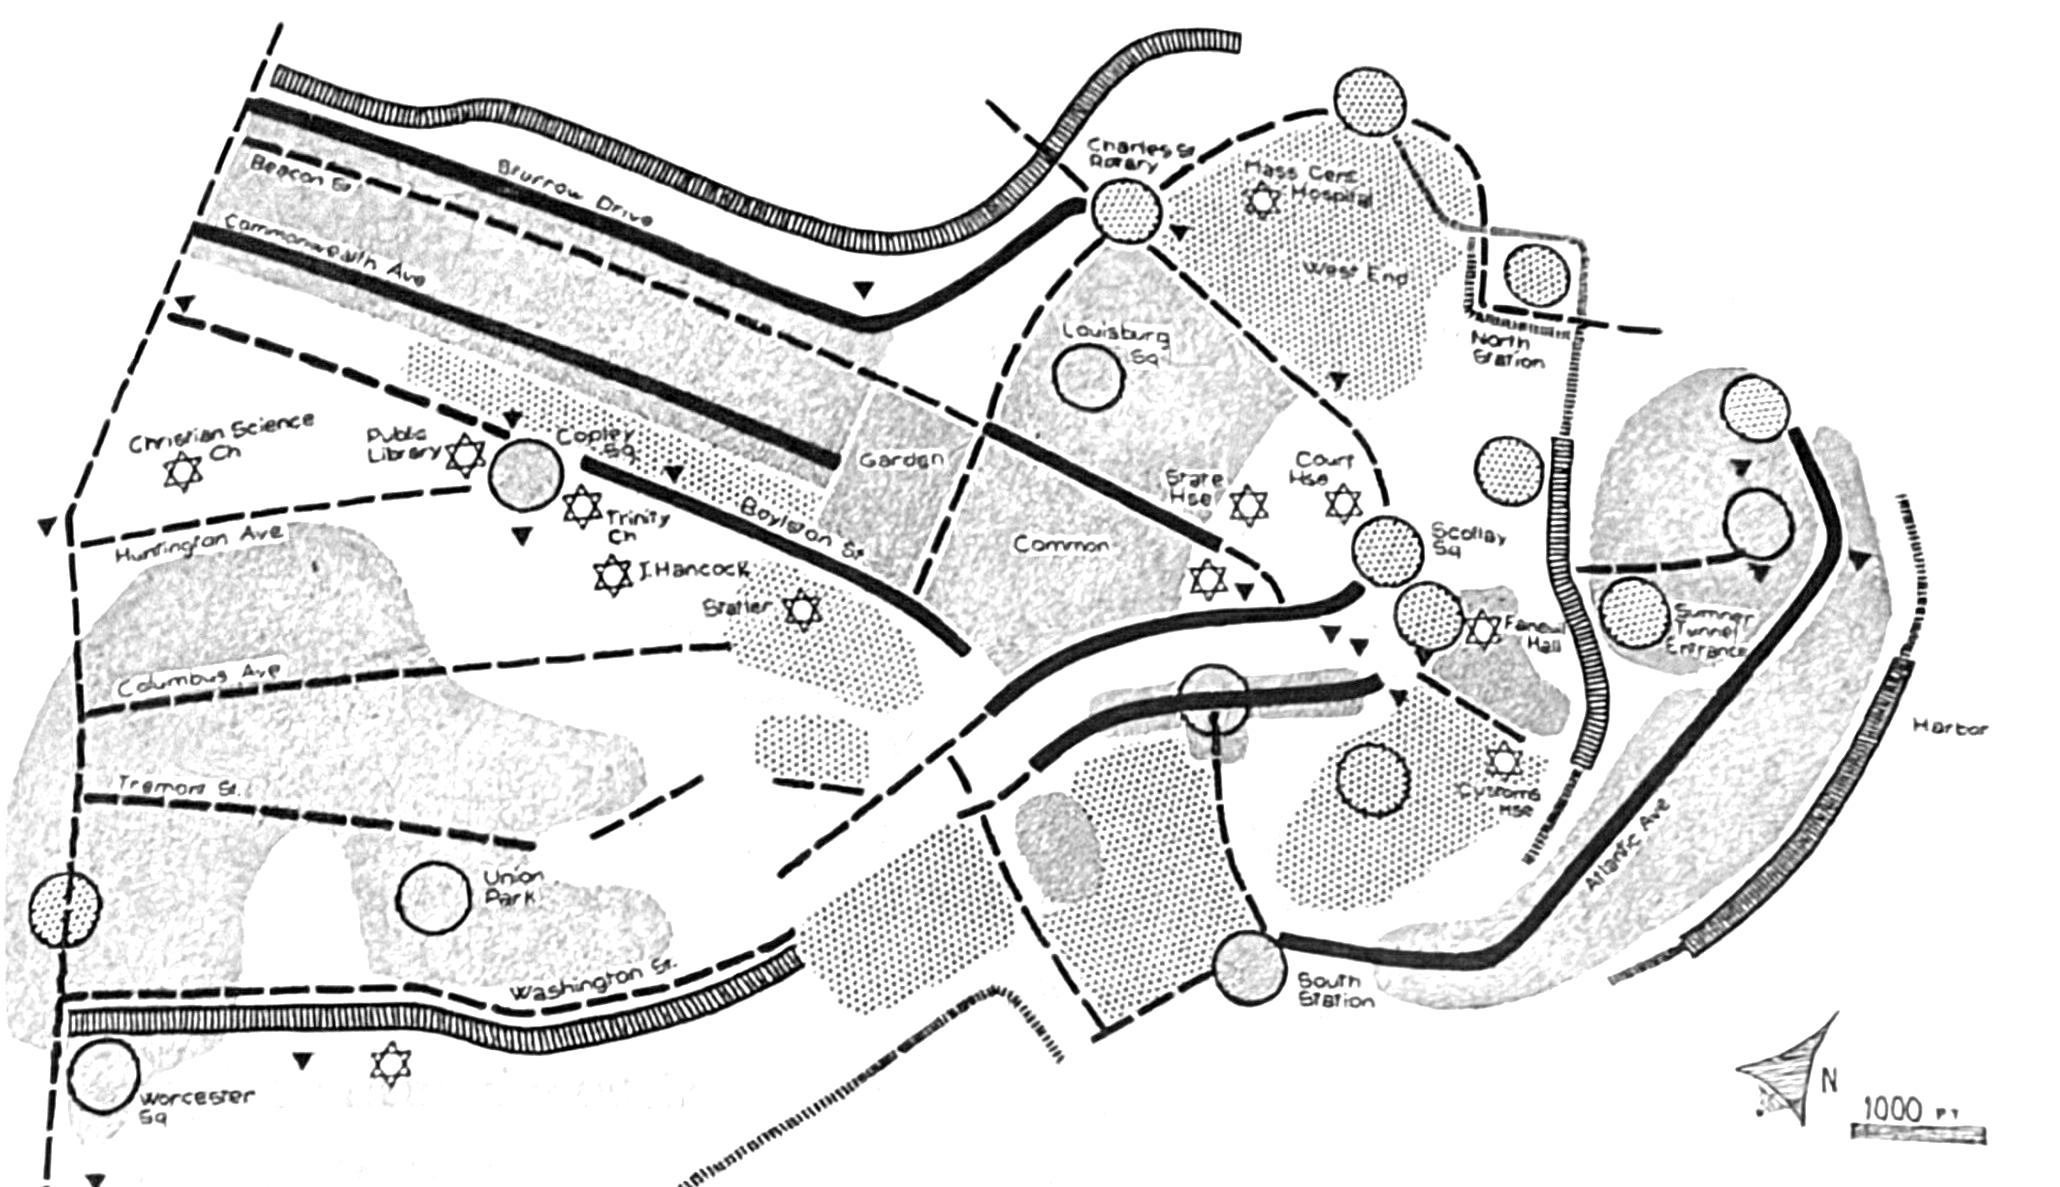
Boston, Two Ways
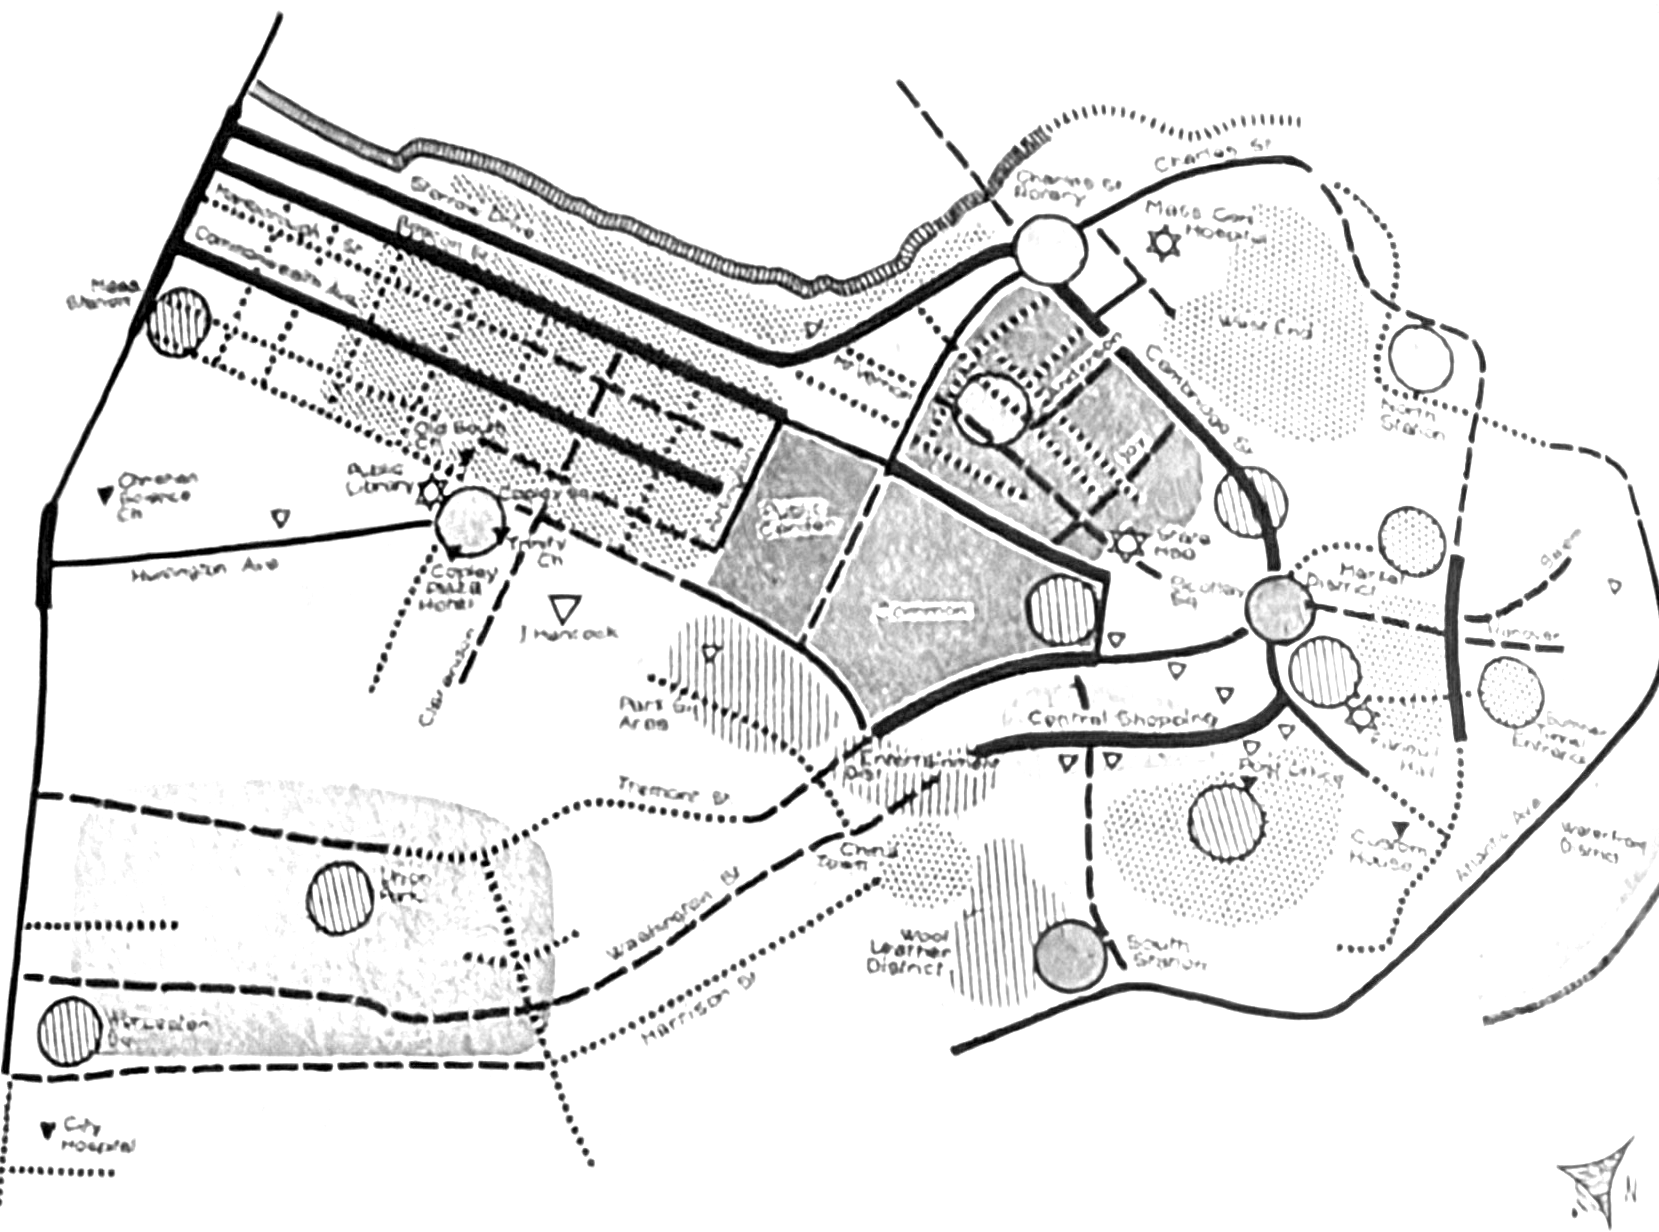
Same city, two methods: what residents said (left) and what they drew (right).

Lynch’s Five Elements

1. Paths: channels of movement (dashed and solid lines)

2. Edges: linear breaks, such as the river and waterfront (hatched strips)

3. Districts: areas with common character (shaded and dotted areas)

4. Nodes: focal points and junctions (circles)

5. Landmarks: unique reference points (stars and triangles)

Most of these depend on height, mass or visibility, so they are fundamentally 3D concepts.
The Experiential Dimension

2D maps show:

  • Location
  • Proximity
  • Area
  • Connectivity (topology)

But they miss:

  • Height and mass
  • Shadows and light
  • Visual prominence
  • Sense of enclosure

3D visualization reveals:

  • Building heights and skylines
  • Shadow patterns throughout the day
  • Sight lines and viewsheds
  • Spatial enclosure and openness

These are essential for understanding how a city feels to inhabit.

Part 2: The Urban Planning Challenge

Rapid Global Urbanization

By 2050: about 68% of the world’s population will live in cities

The Challenge:

Making decisions about massive new developments:

  • 80-story residential towers
  • Transit mega-projects
  • Urban renewal districts

The Question:

How do we know the impact of these developments on neighborhoods, residents, and the urban fabric?

Current Scenario: Limited Tools

  • Decisions based on: experience, precedent, negotiation
  • Analysis tools: off-the-shelf design software; limited, not interactive
  • Visualization: a few static, pre-rendered images
  • Data: exists (city open data) but is not integrated into the design process
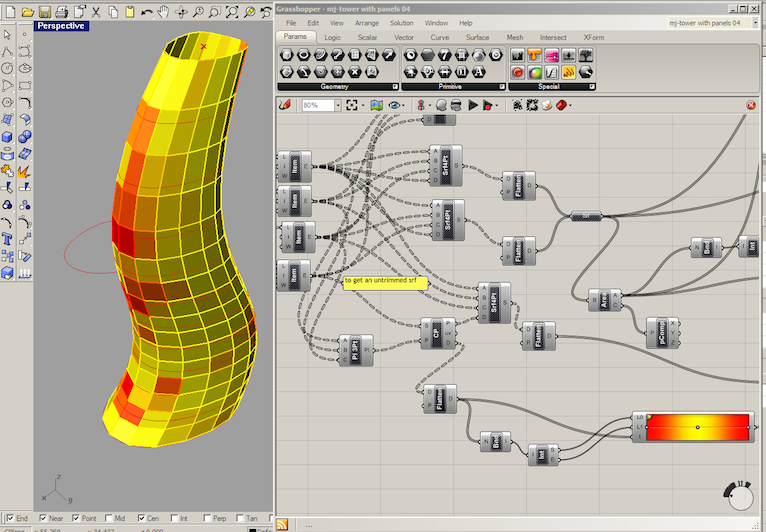
Off-the-shelf parametric design software (Rhino + Grasshopper)

The Gap: What’s Missing

What planners and architects need:

  1. Integrated data access: building characteristics, environmental metrics, social and economic data
  2. Interactive exploration: query and filter dynamically, with linked views

And what they need to do with it:

  1. Impact simulation: “what-if” scenarios with real-time feedback
  2. Decision support: compare options and trade-offs, across several scales

Part 3: Case Study - Urbane

Urbane: A 3D Framework for Urban Planning

A 3D framework to support data-driven decision making in urban development

Urbane: Three Components
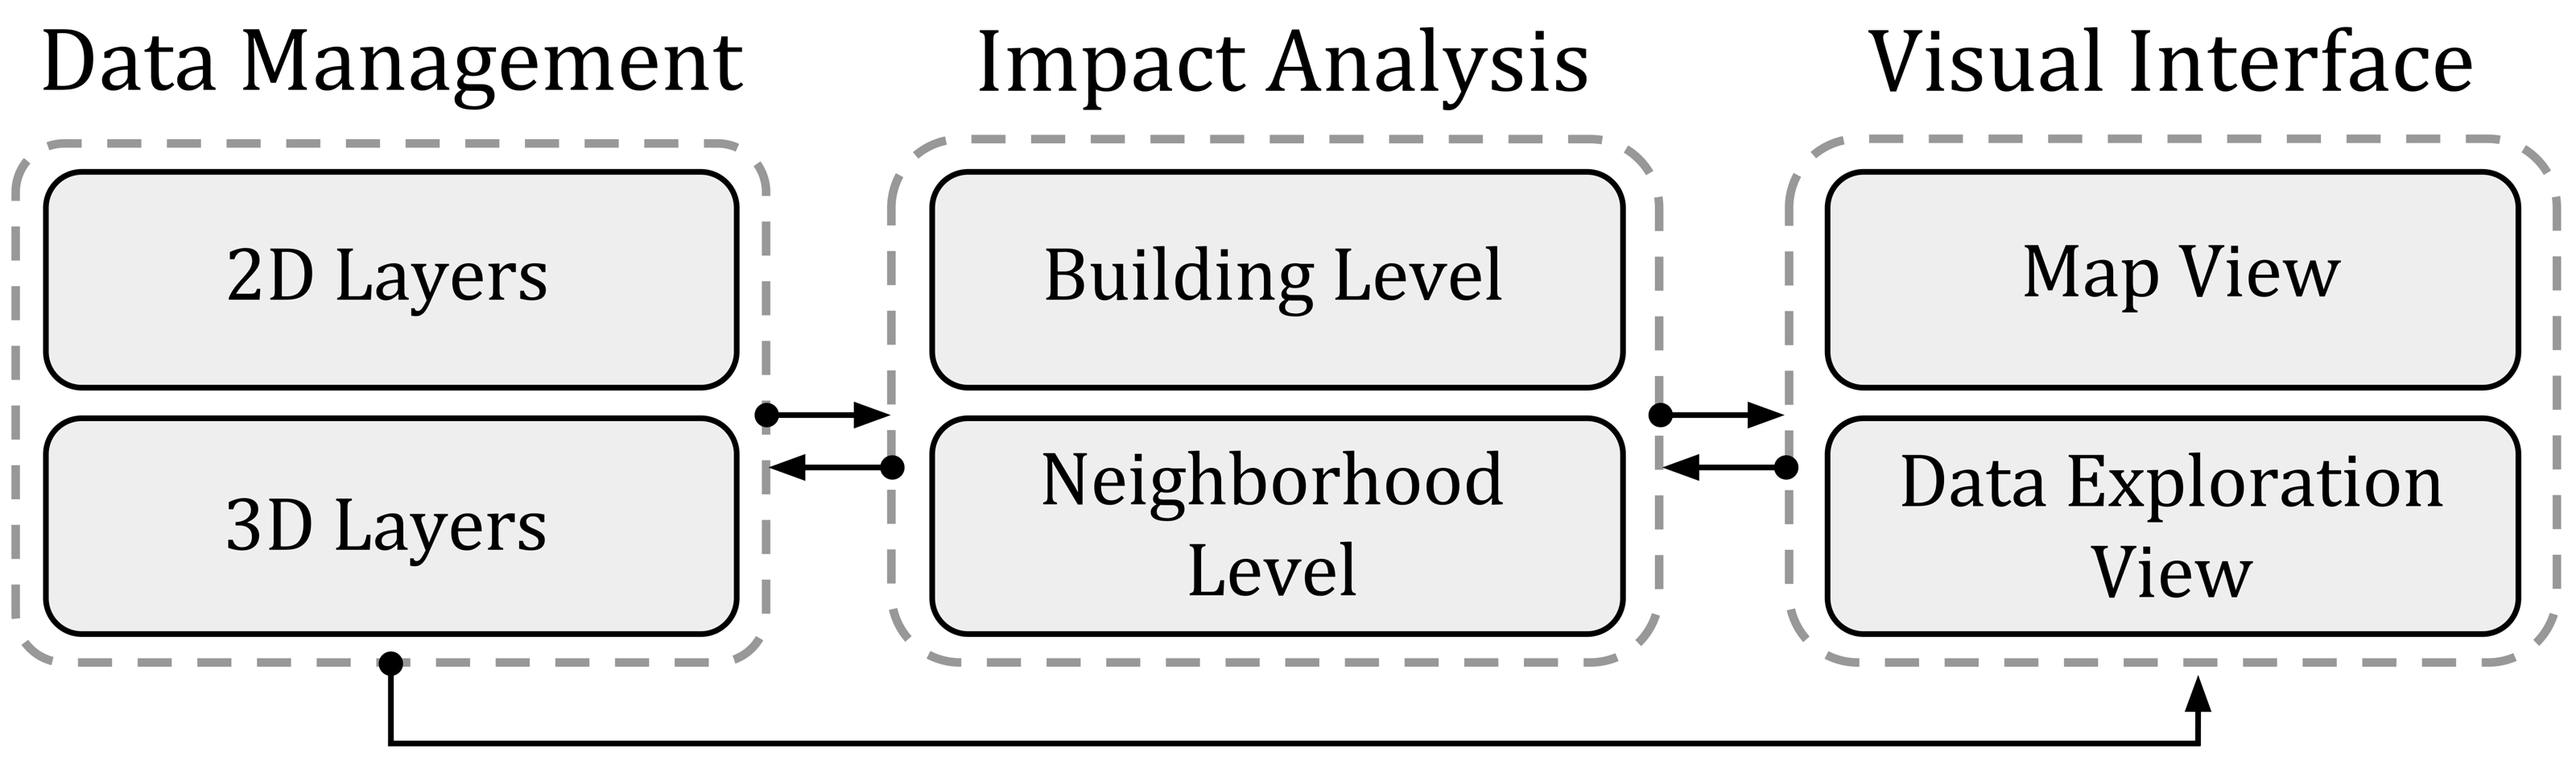
The data management, impact analysis, and visual interface components of Urbane

Data Layers: 2D and 3D Together
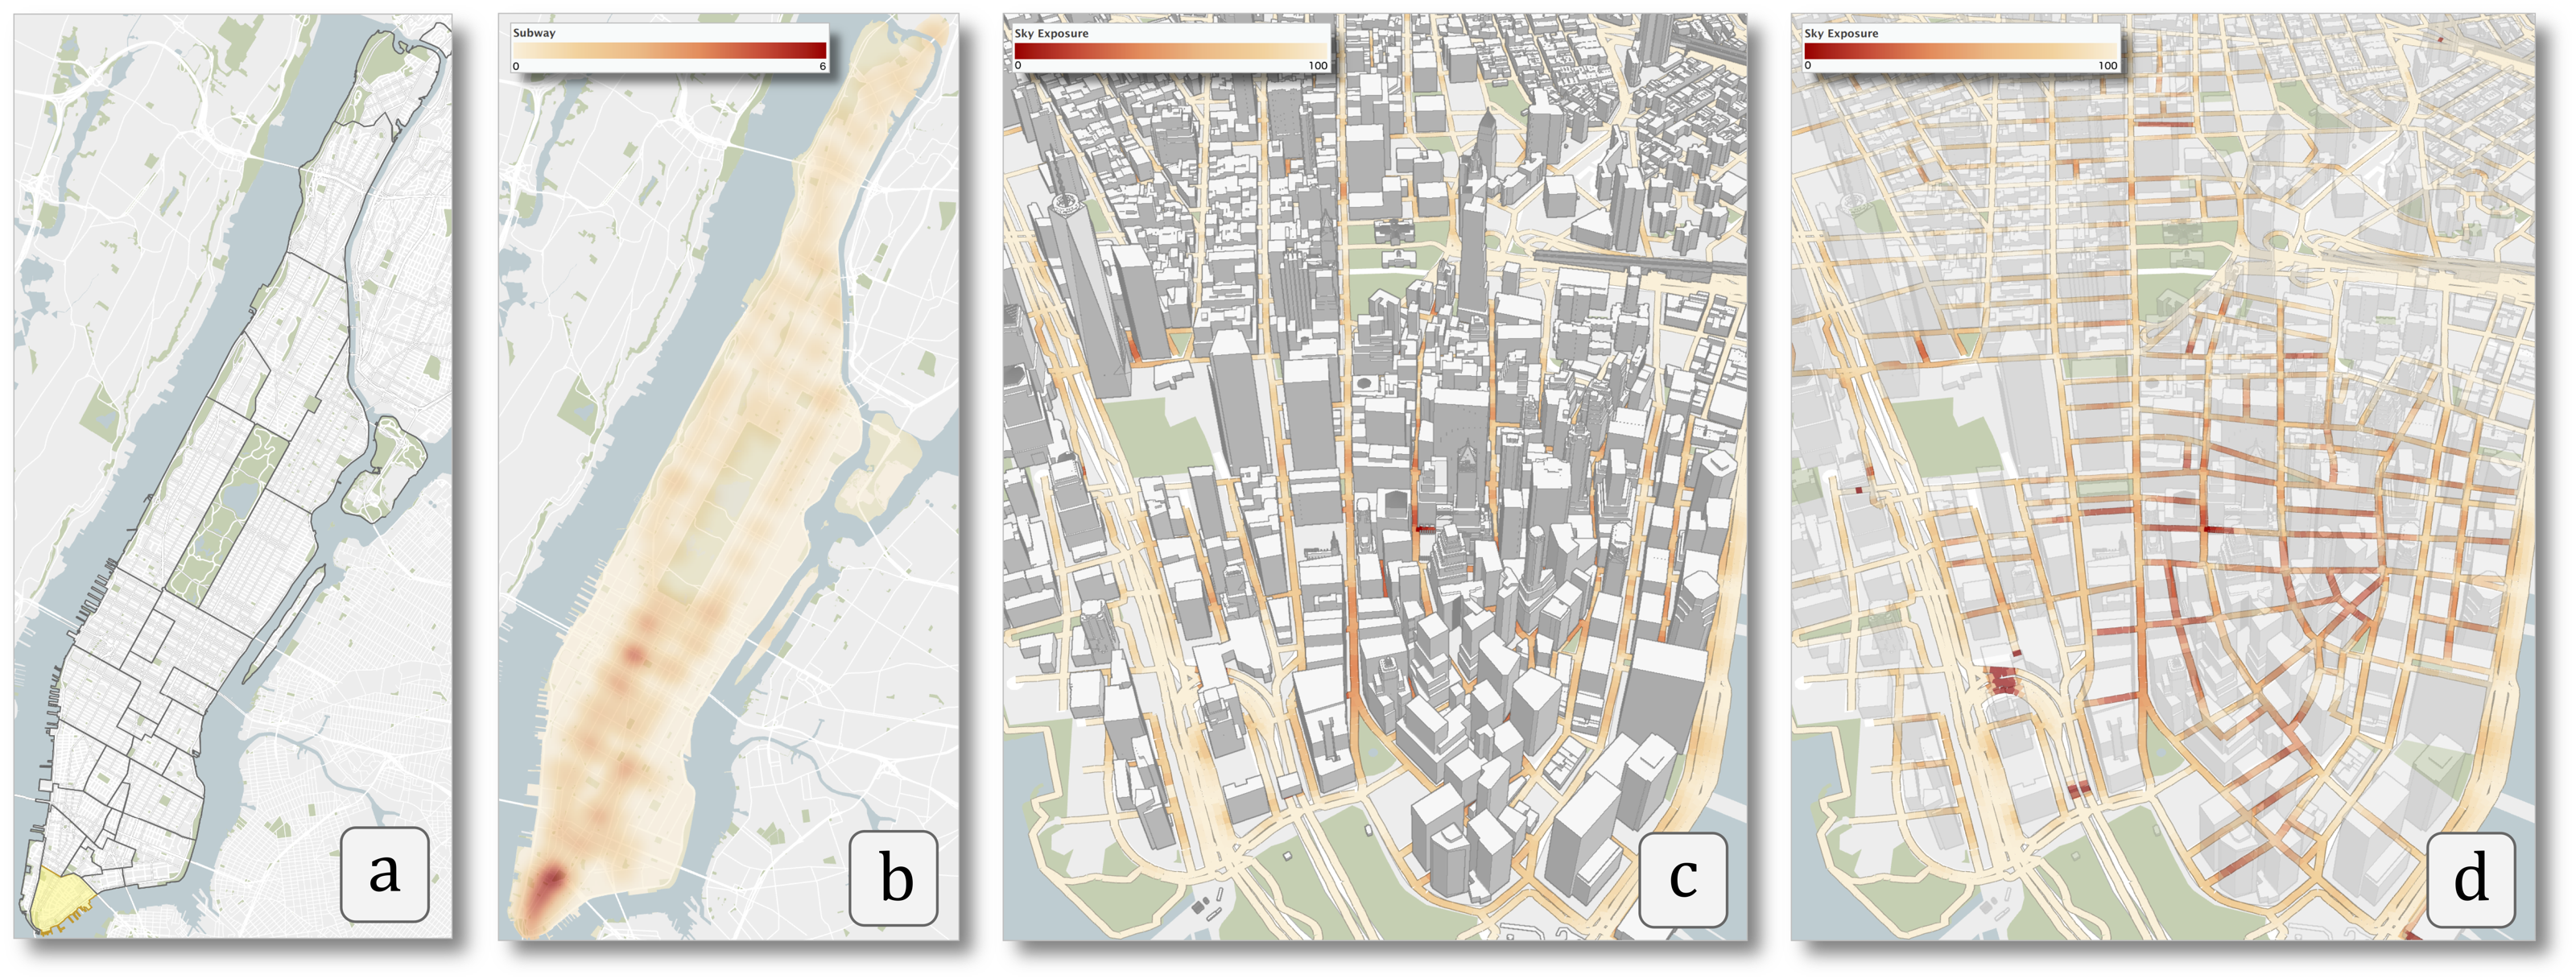
Polygon, grid, combined 2D+3D and road-network heat map layers over Manhattan

The Power of Linked Views in 3D

Brushing and linking works in 3D, too!

3D → 2D

Select buildings or a neighborhood in the map

↓

See their attributes in the data exploration view

Use case: “What are the characteristics of this neighborhood?”

2D → 3D

Brush ranges on the parallel coordinates axes

↓

See matching buildings highlighted in the 3D map

Use case: “Show me buildings near a park with good subway access”

Part 4: Linking 3D and 2D in Practice

Query in Data Space, See the Result in the City

Each filter on the parallel coordinates plot updates which buildings are highlighted in the map.
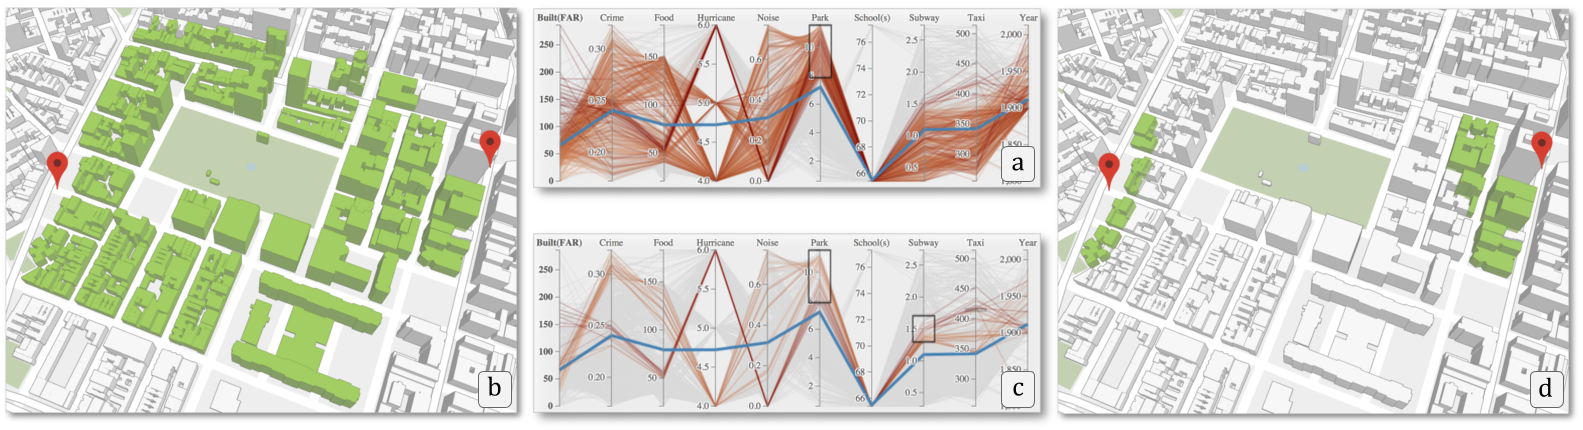
Brushing a parallel coordinates plot (a, c) and the resulting buildings in the map (b, d)

Use Case: Finding Development Sites in the Financial District

Compare the neighborhood to the rest of Manhattan, then filter down to candidate sites.
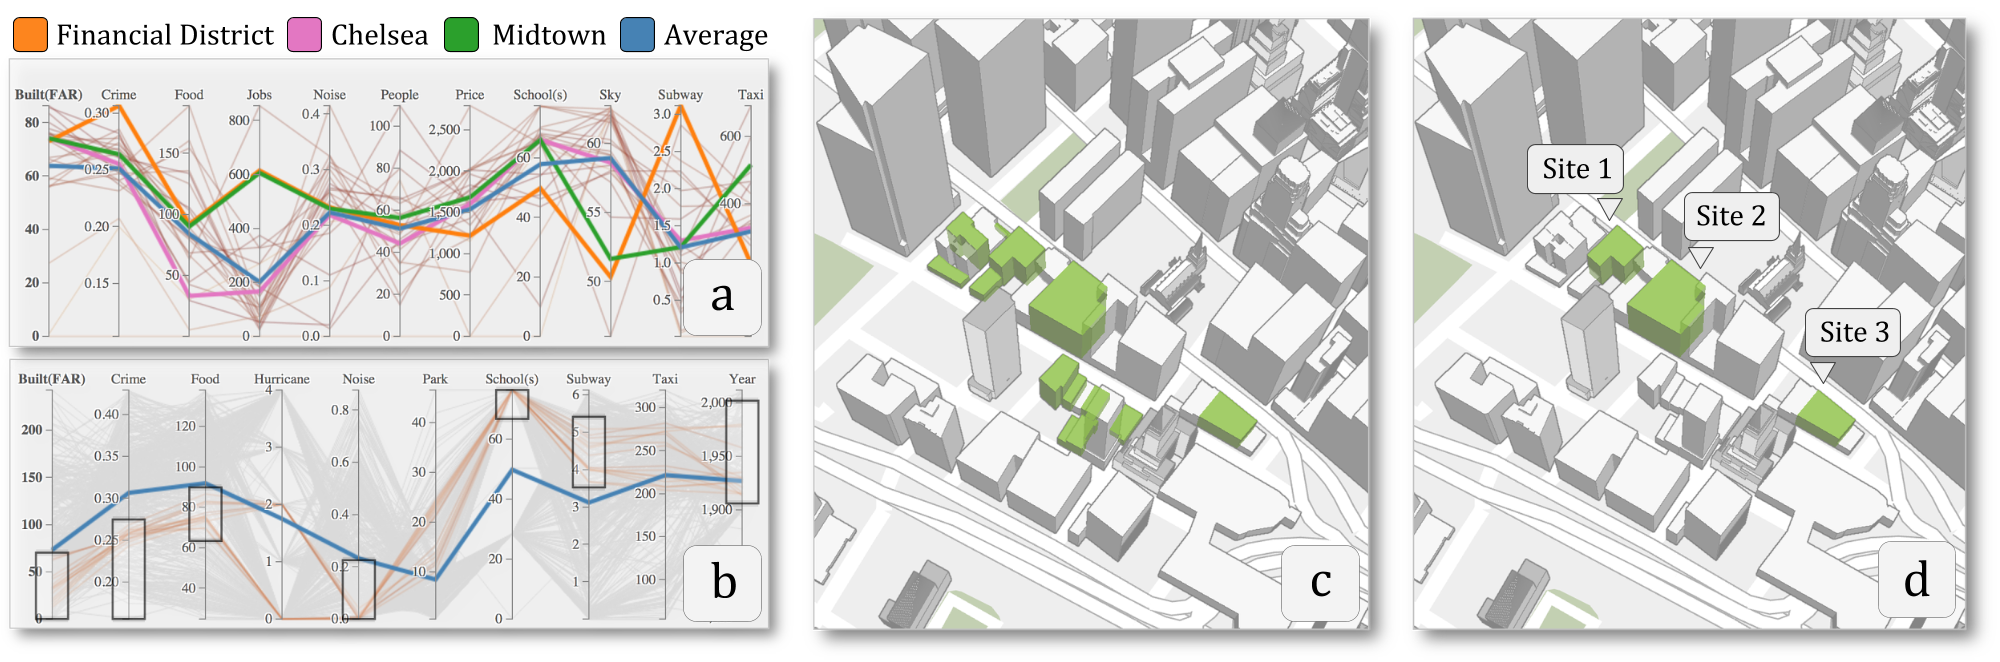
Parallel coordinates comparing neighborhoods (a), a filter on site properties (b), and the resulting candidate sites in 3D (c, d)

Part 5: Interactive Impact Analysis

From Visualization to Simulation

The most powerful feature: “What-if” analysis

  • Not just viewing data
  • But simulating the impact of proposed changes
  • Interactively, in real time

The Question:

“How will a new building change its surroundings?”

Two Impact Measures: Landmark Visibility and Sky Exposure

  • Landmark visibility: can a building still see a landmark, such as the Statue of Liberty or the Freedom Tower?
  • Sky exposure: what fraction of the sky is visible from a point on the street?
  • Impact = the difference between the “before” and “after” values
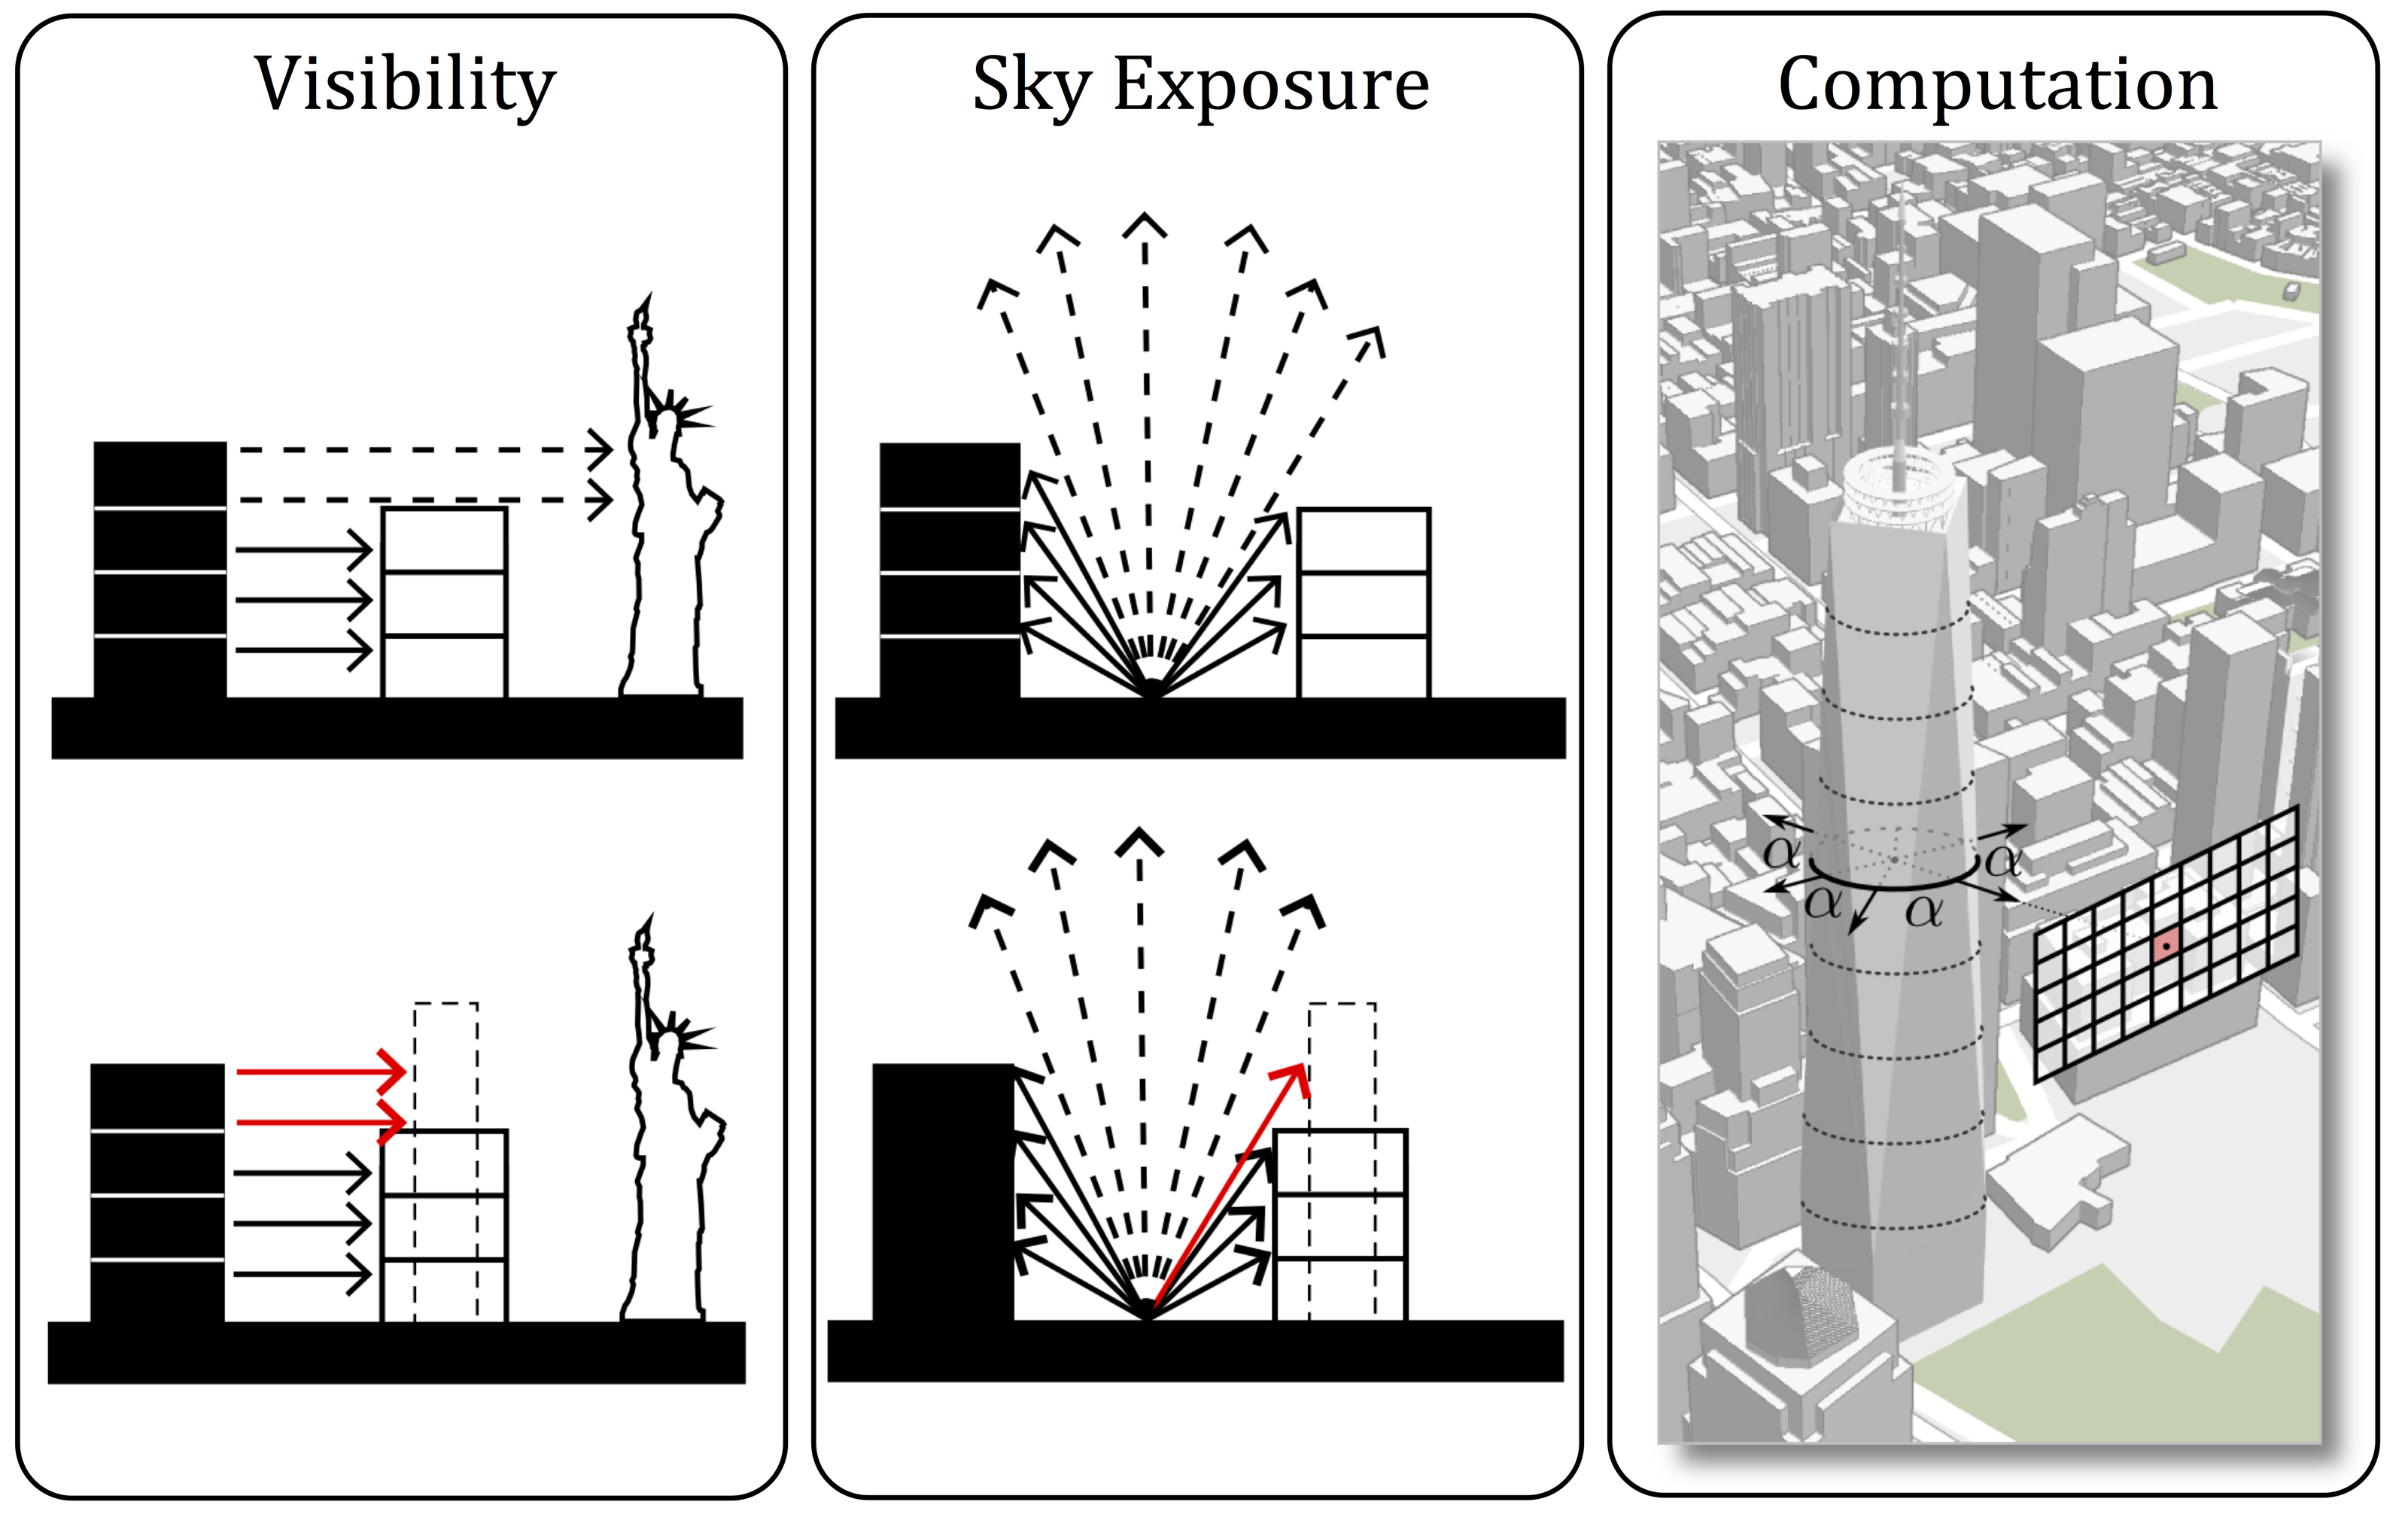
Visibility, sky exposure, and how they are computed

Computing Impact in Real Time

Rasterization, not ray tracing

  • Render the scene from a viewpoint into a 256 × 256 image
  • Give every building a unique color
  • Count pixels: how many show each building, how many show sky
  • Impact = change in the counts when the geometry is replaced

Why it is fast

  • The GPU does the rendering; a compute shader does the counting
  • Sky exposure at 650 locations: 8.4 s on a CPU, 75 ms on a GPU (about two orders of magnitude)
  • Sky exposure computed every 10 m along every street

Urbane: Testing a Proposed Building

  • The olive building is the proposed construction; green is the landmark (Freedom Tower)
  • Landmark visibility: buildings in red lose view, blue gain view
  • Street segments show the change in sky exposure
  • The architect can swap the design and see both update
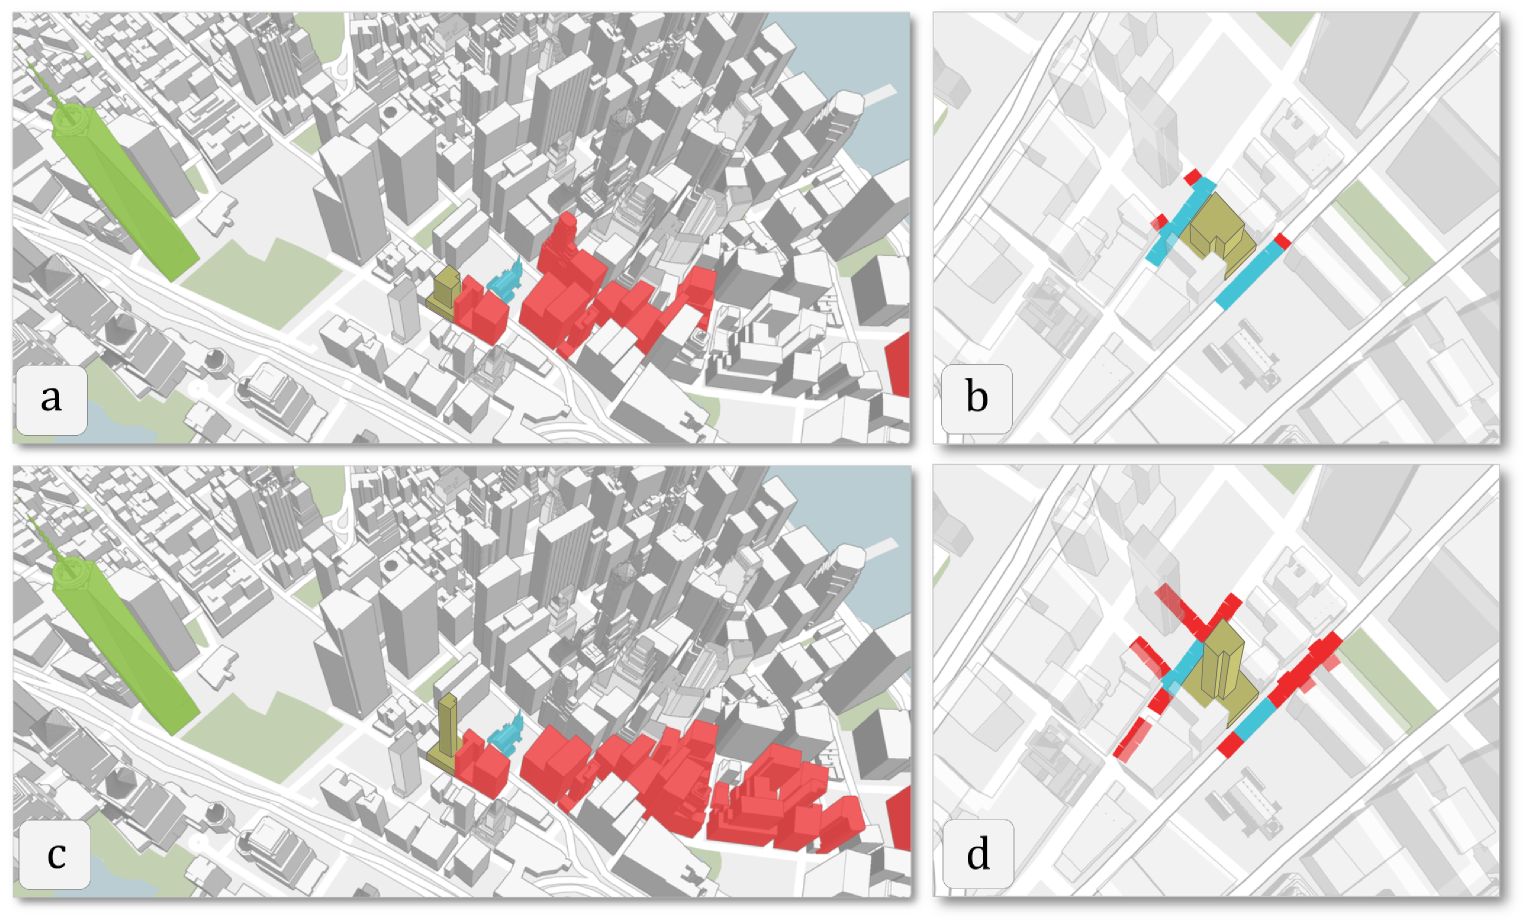
Landmark visibility (a, c) and sky exposure (b, d) impact for two floor plates

The Value of Interactive Simulation

Traditional approach:

  1. Developer provides a few static renderings
  2. Planner reviews documents
  3. Public hearing with limited visuals
  4. Decision with incomplete information

Iterations: one or two

With Urbane:

  1. Load the proposed design into the 3D model
  2. Compute the impact instantly
  3. Adjust parameters, such as the floor plate
  4. Compare options, then iterate

Iterations: as many as time allows

More informed decisions, and stakeholders who can see the trade-offs.

Part 6: Performance-Driven Design

Taking It Further: Explore Thousands of Designs

Why test one design? Explore the whole space of designs.
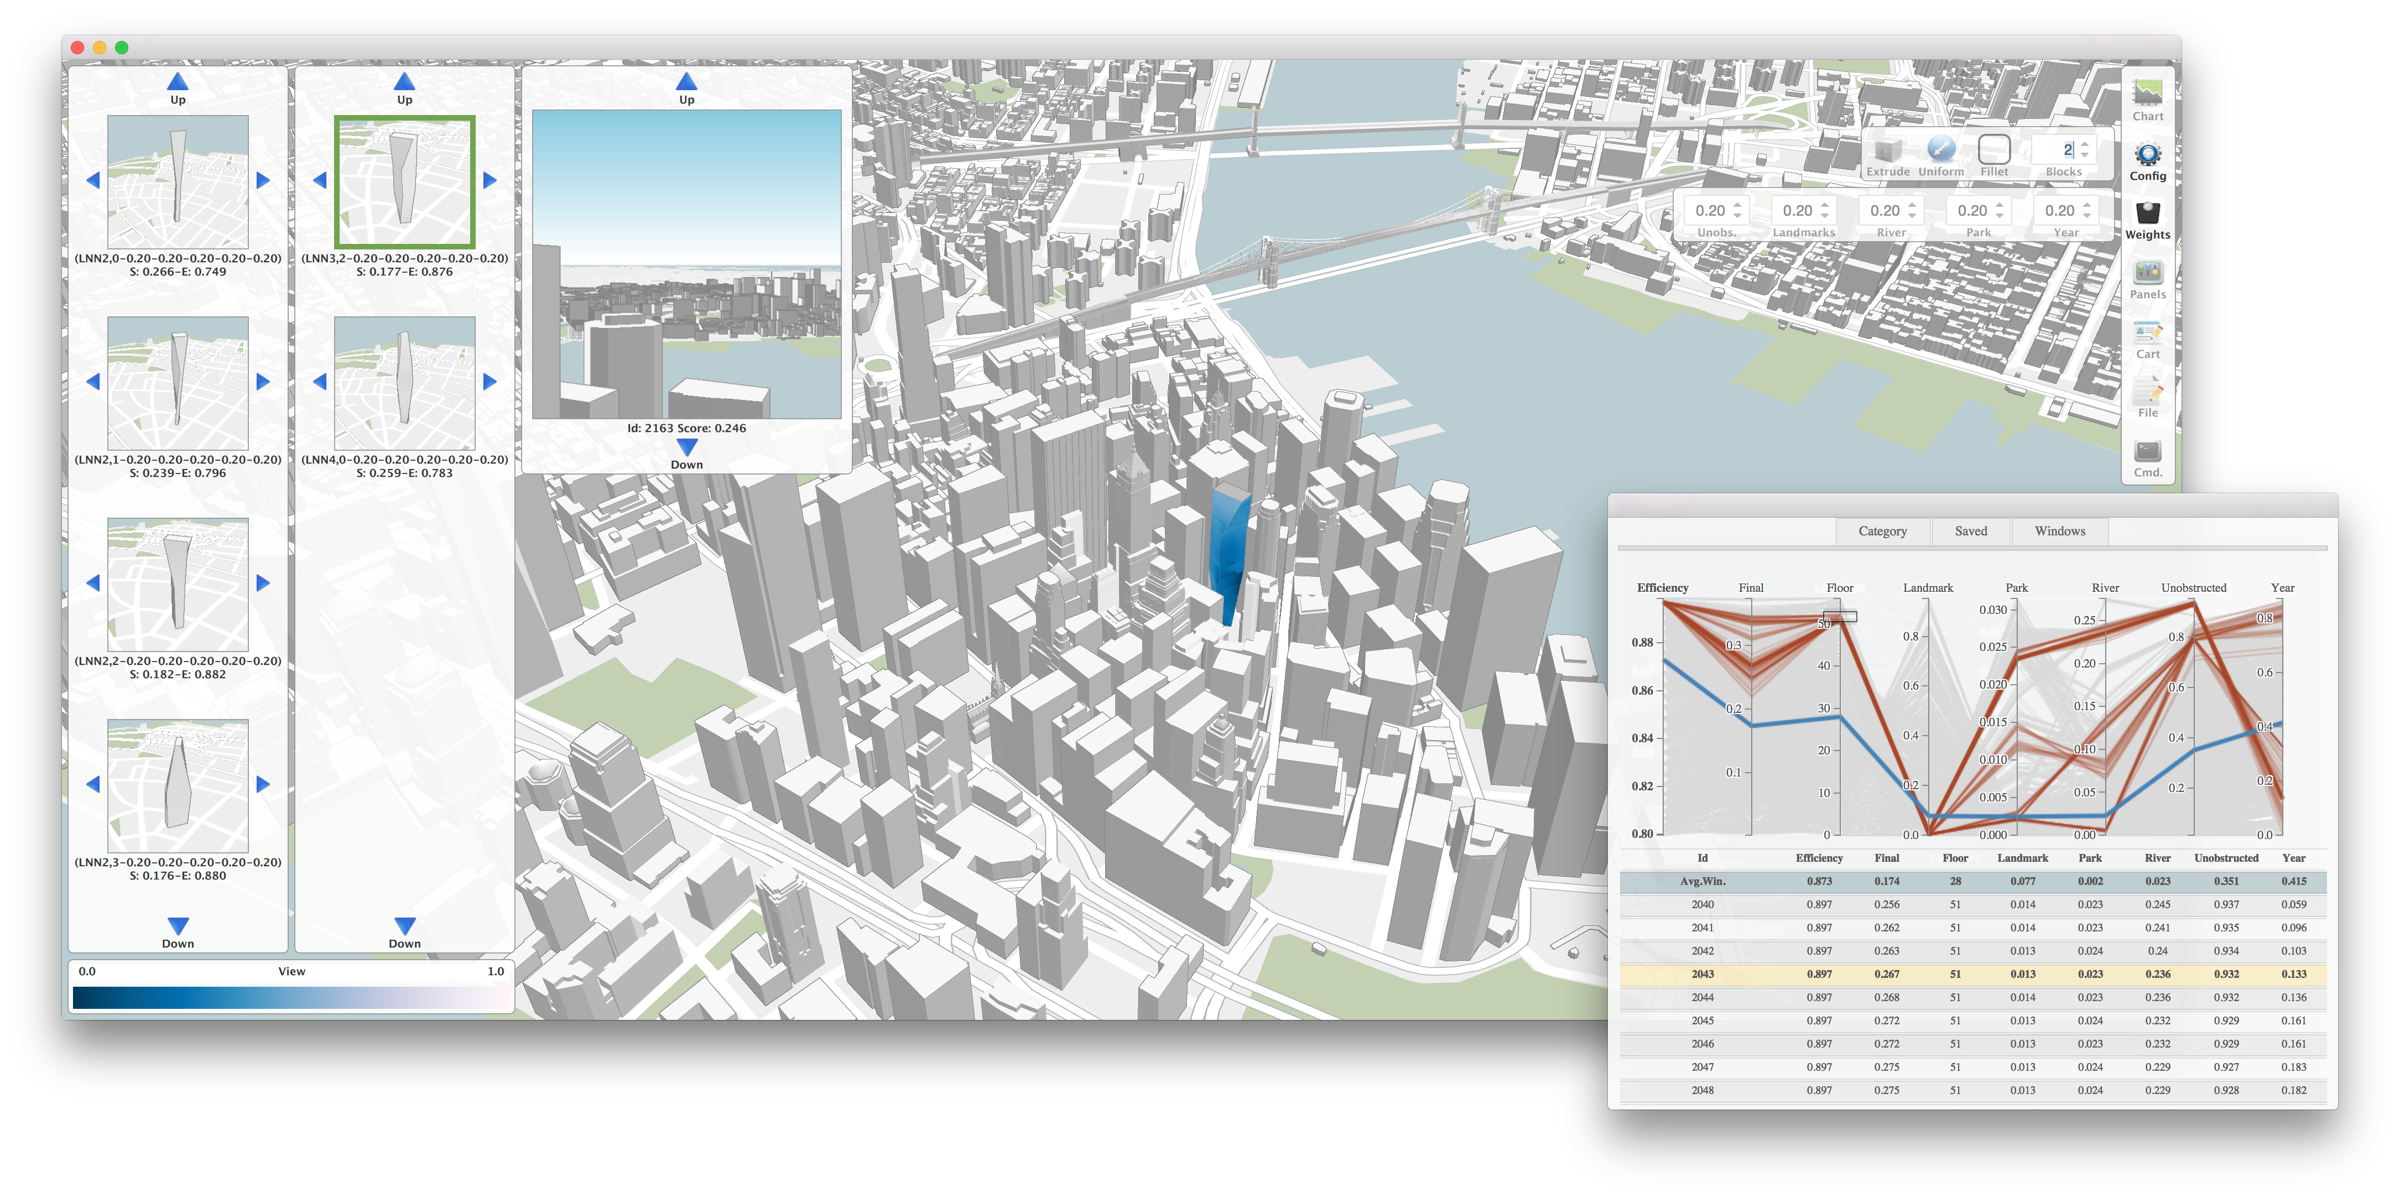
Why Towers, and Why Views?

Why towers?

  • Developable sites are getting smaller
  • Maximize the use of the allowable building area
  • The norm in dense cities

Why views?

  • Views are one of the first things people notice
  • Views are limited in dense regions
  • A good view adds value

The design problem:

Find tower designs that maximize view quality while staying practical:

  • Zoning limits (FAR, maximum height)
  • Minimum building efficiency
  • Overlap between floor profiles

A Design Space of Tower Shapes

A tower is generated from floor profiles and a few operations; the parameters define a design space.
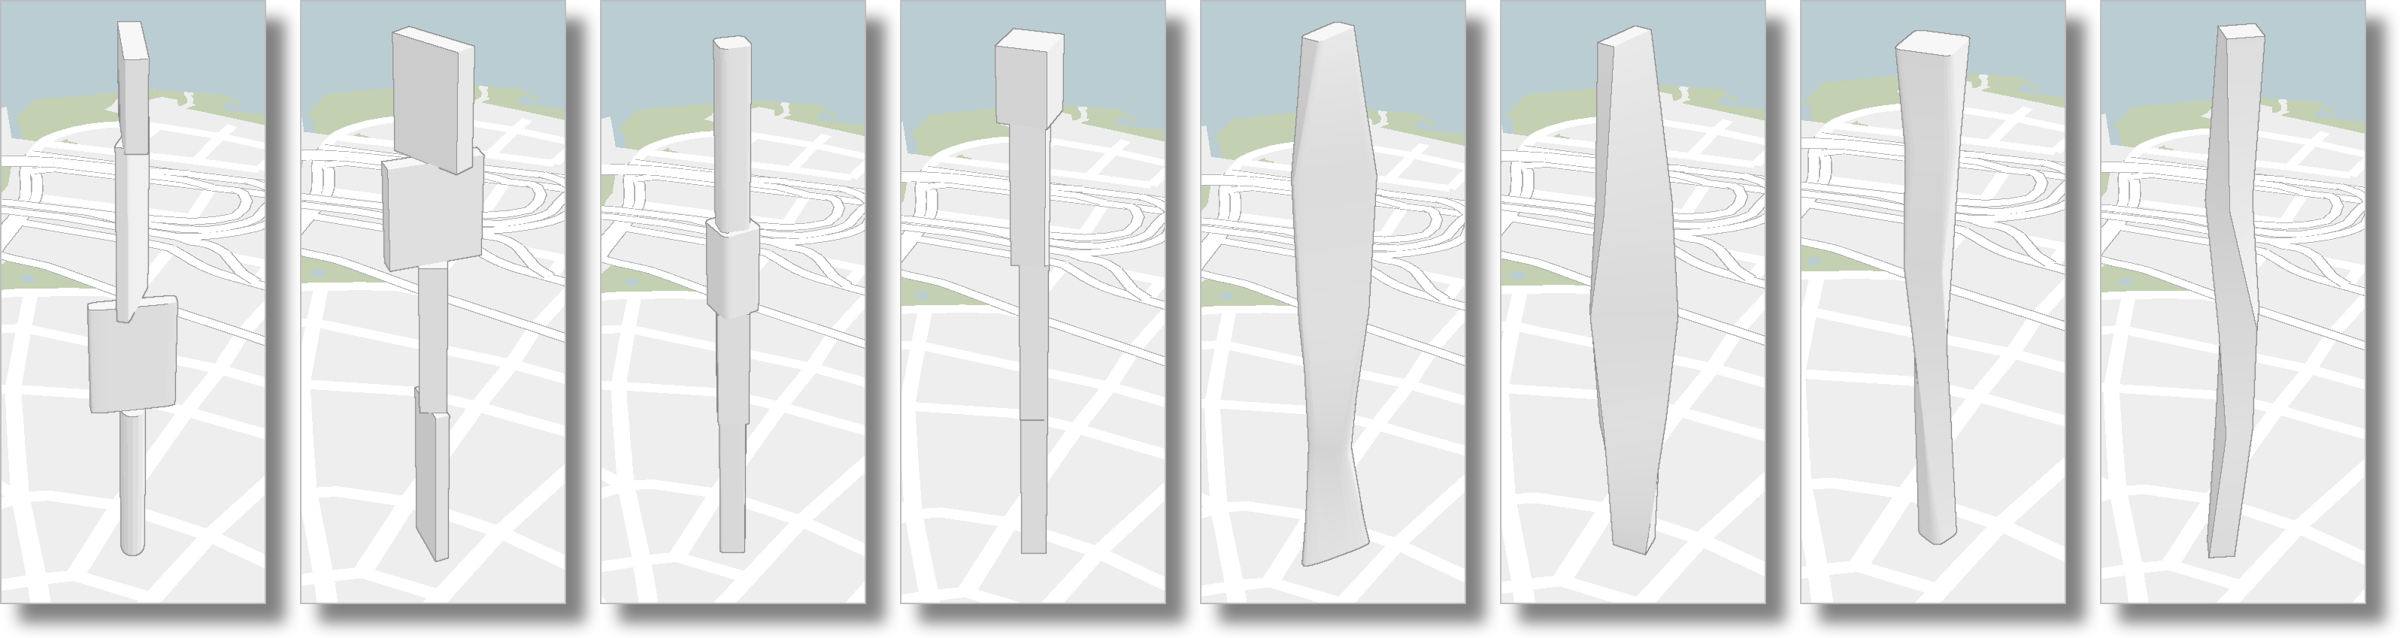
Families of tower designs generated by varying parameters

Quantifying View Quality

  • The view along a window (a point and a direction) is a weighted average of several view metrics
  • The weights are the user’s handle: “good view” is subjective
  • A building view score is the average over its windows
  • One tower has about 10,000 windows

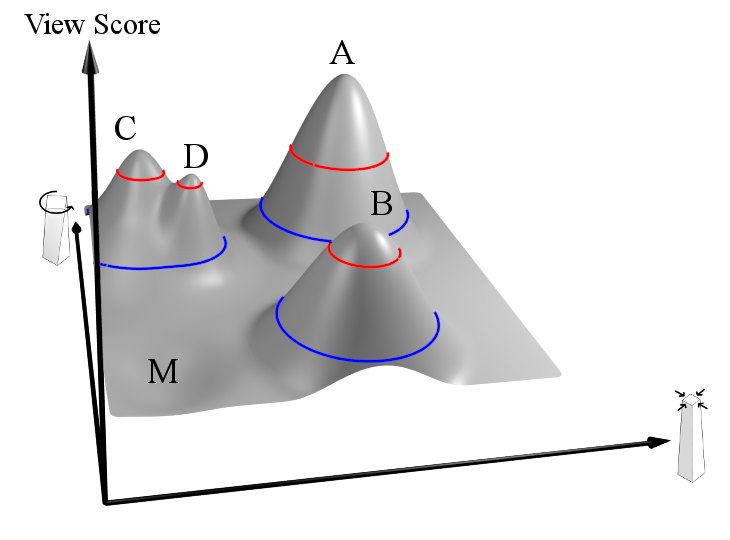
View score over a two-parameter design space: peaks are good designs

Part 7: Precomputation & Exploration

The View Index: A 4D Texture

Precompute once

For each location (x, y, z) and viewing direction θ, store what is visible

  • Grid every 10 ft in the plane, every 12 ft in height
  • One direction every 6° (60 directions)
  • Millions of precomputed views per site

Then look up

A view for any window is a constant-time lookup

  • 33.3K view computations per second on a single CPU
  • Over two orders of magnitude faster than exact computation
  • Approximate scores track the exact ones closely

Which Designs Are Interesting? Use Topology

  • Sample the parameter space; each point is a tower with a view score
  • Connect nearby samples (nearest-neighbor graph)
  • Find the high-persistence maxima of the score function
  • Each peak is a distinct, good design family: a catalogue
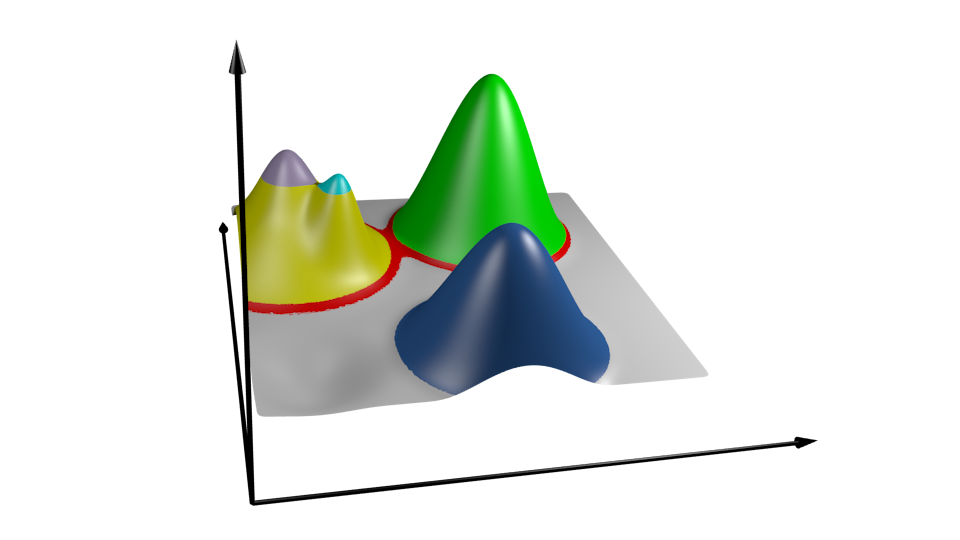
Peaks of the view score function over the design space

Exploring the Catalogue

A parallel coordinates view over design and view metrics lets the architect filter to the designs that matter.
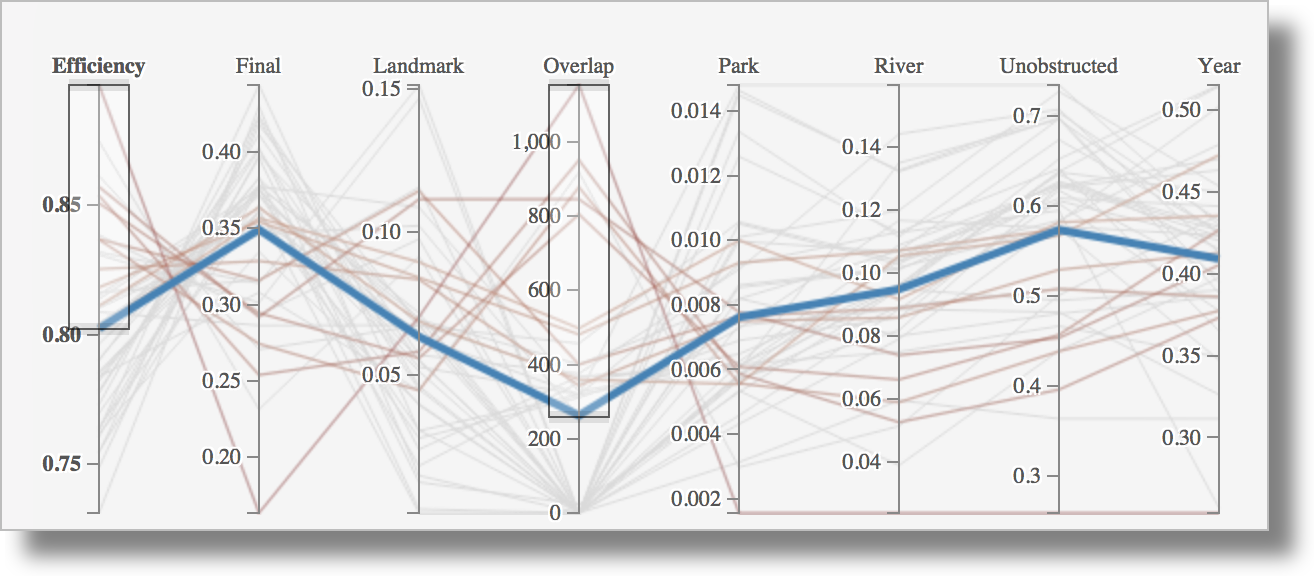
Parallel coordinates for filtering the design catalogue

From Catalogue to a Building
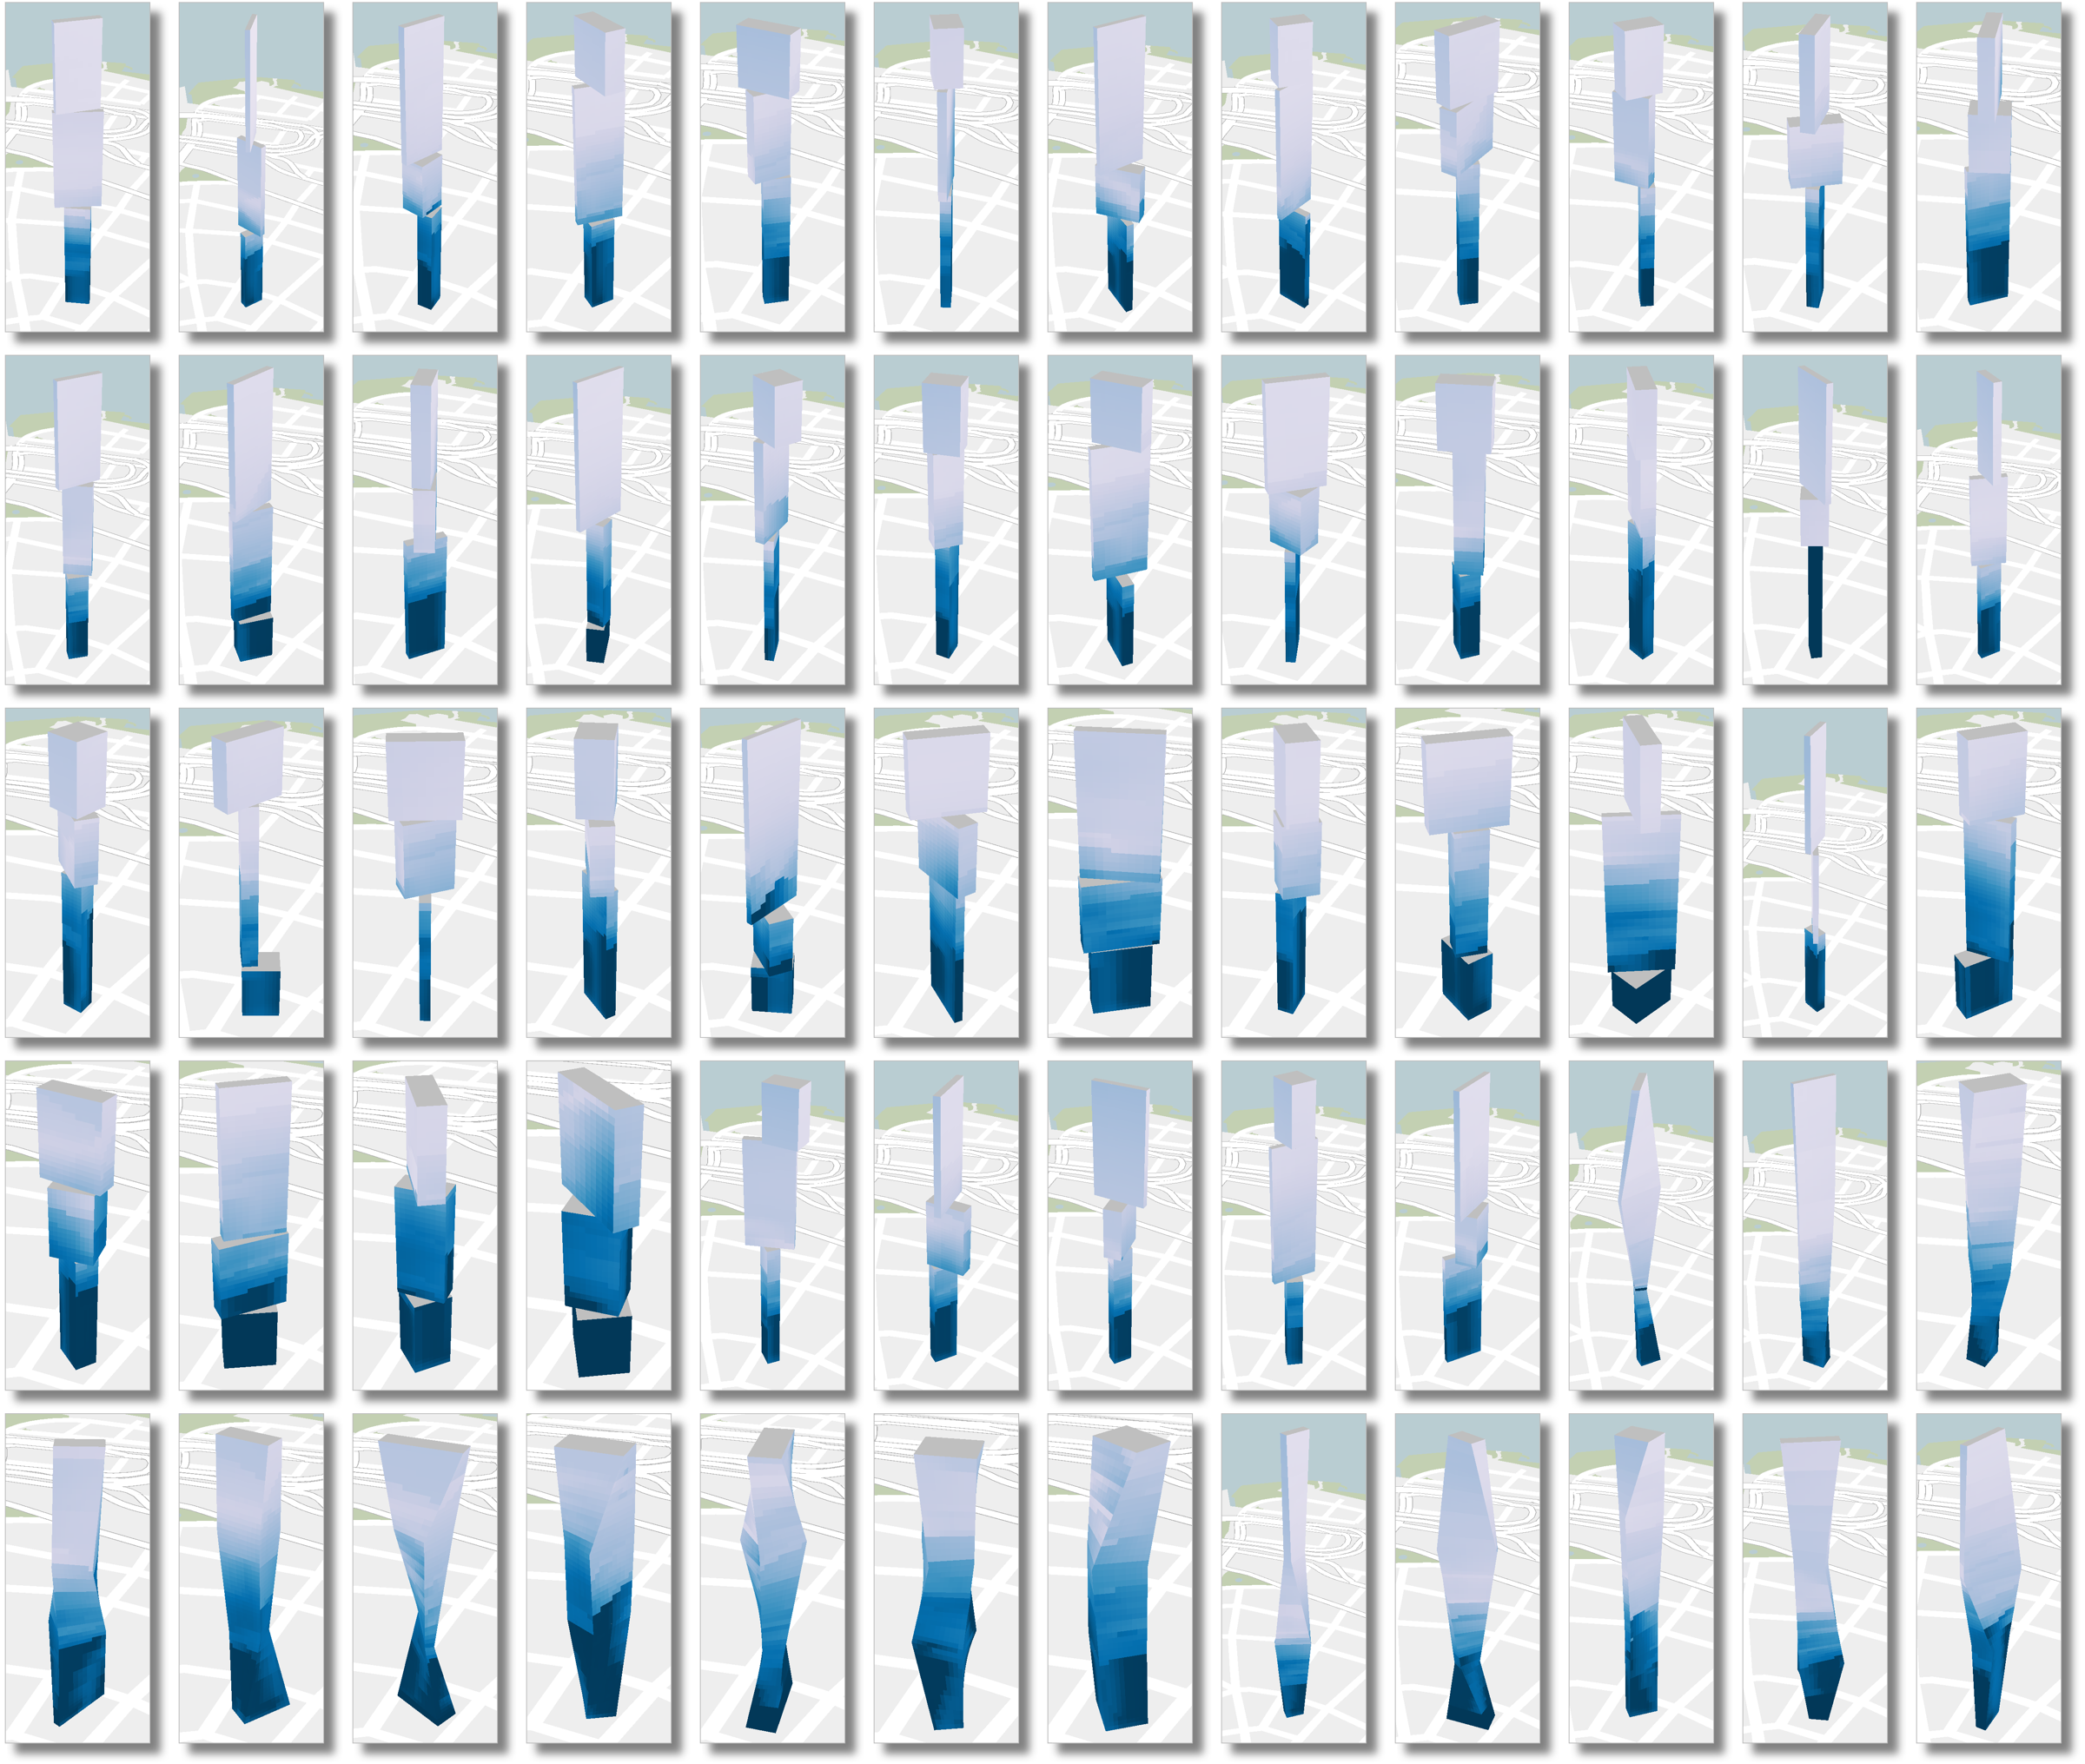
Catalogue of candidate towers, coloured by view quality at each floor

Refining a Design and Assigning Programs
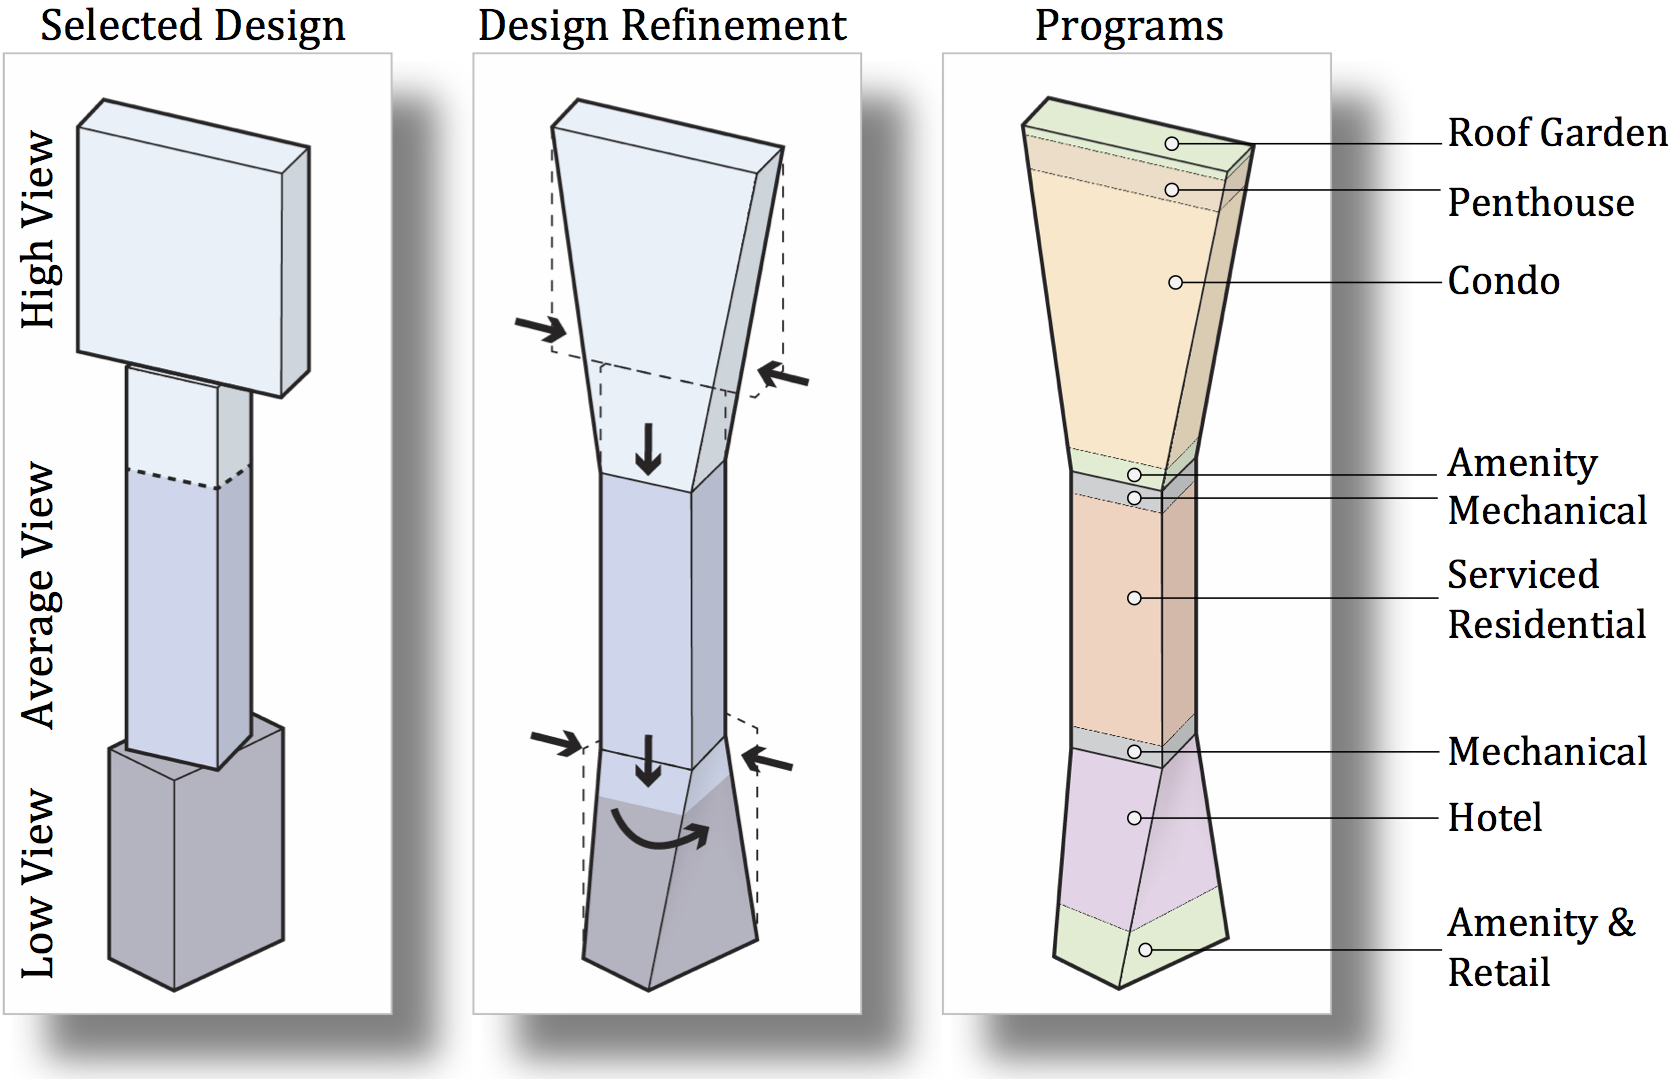
Selected design, refined profile, and program allocation by view quality

Performance-Driven Design: The Paradigm Shift

Traditional design:

  1. Architect sketches two or three options
  2. Each is evaluated by hand
  3. The client picks one
  4. Refinement begins

Exploration: minimal

Performance-driven design:

  1. Define objectives and constraints
  2. Generate a large design space
  3. Evaluate it automatically
  4. Explore trade-offs visually
  5. Select and refine

Exploration: comprehensive

Visualization turns an enormous search into something a person can steer.

Part 8: Critical Reflection - When to Use 3D?

A Question from the Urbane Authors Themselves

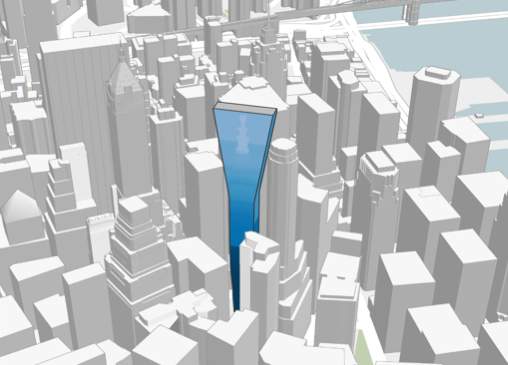
“3D? Is it the right way to go?” Same city, two representations: which question is each one good for?
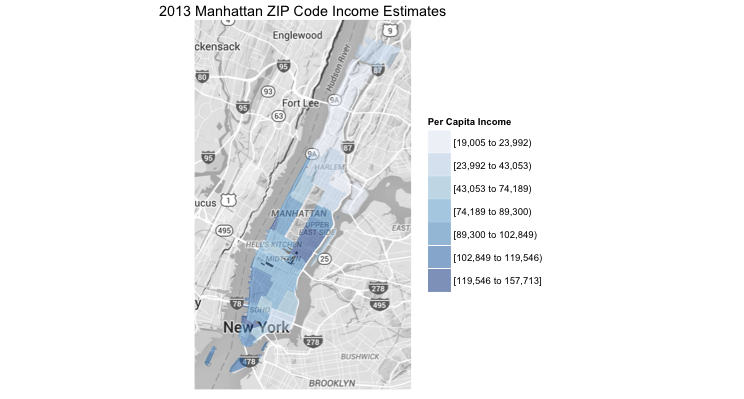
2D choropleth of income by ZIP code

3D view of a building in context

The Case FOR 3D

  1. Matches human experience
    • We experience cities in 3D
    • More intuitive for non-experts
  2. Essential for certain measures
    • Sky exposure, viewsheds, sightlines
    • Sense of enclosure
  1. Public communication
    • Stakeholders can “see” the impact
    • Supports participatory planning
  2. Reveals spatial relationships
    • Height disparities
    • Clustering patterns
    • Neighborhood character

The Case AGAINST 3D

  1. Occlusion
    • Buildings hide other buildings
    • Information loss
  2. Navigation complexity
    • Easy to get disoriented
    • Cognitive overhead
  1. Can be chart junk
    • Adds visual complexity
    • Sometimes 2D is clearer
  2. Computational cost
    • Rendering and interaction lag
    • Needs capable hardware

Guidelines: When to Use 3D

Use 3D when:

  • The question is inherently 3D: views, sky, shadows, height compared to neighbors
  • You are analyzing 3D form: massing, skyline, enclosure
  • You need to communicate with the public

Use 2D when:

  • The question is statistical: highest density, crime patterns
  • You need precise comparison: ranking, exact values
  • You want to avoid occlusion
  • The data is abstract or non-spatial: networks, temporal patterns

Part 9: Synthesis

From Presentation to Exploration to Simulation

Week 8: Static presentation

  • One fixed view
  • The designer’s perspective
  • “Here is the data”

Question: When is spatial encoding the right choice?

Week 9: Interactive exploration

  • User-driven queries
  • Linked views
  • “Ask your own questions”

Question: How do we explore massive, dynamic flows?

Week 10: Interactive simulation

  • Impact prediction
  • Generative design
  • “Create and test scenarios”

Question: When is the third dimension essential?

Your Toolkit: Three Lenses

When approaching any geographic visualization problem, ask:

The 2D lens (Week 8)

  • Is the projection appropriate?
  • Is the data normalized?
  • Are the colors and classes honest?

The temporal lens (Week 9)

  • How does the pattern change over time?
  • What interactions enable exploration?
  • Are spatial and temporal views linked?

The 3D lens (Week 10)

  • Is the question inherently about form?
  • Does 3D add value or complexity?
  • Can I simulate impact interactively?

The Future of Urban Visualization

  1. Real-time urban sensing: live city dashboards
  2. AI-assisted design: generative models, automated optimization
  3. Virtual and augmented reality: on-site impact preview
  4. Participatory planning: public-facing tools

Ongoing challenges:

  1. Scalability: city-scale to planet-scale, in real time
  2. Accessibility: tools for non-experts, equity in representation
  3. Validation: are simulations accurate? uncertainty
  4. Ethics: whose data, whose benefit, privacy

Wrap-up

Today in Three Points

  1. 3D is warranted when the question is about form: views, sky, light, height
  2. Simulation turns visualization into decision support: “what-if” in real time
  3. Link 3D to 2D: context and impact in the city, precision in the abstract views

Next:

  • Lab (today): 3D transformations, the math behind every view in a 3D map
  • Mini-project 2 (temporal visualization) is due Nov 19
  • Next week: visualizing time-oriented data
  • Reading: the Urbane paper (link in the syllabus)

Questions?

Every visualization makes choices.

Make yours deliberately, defensibly, and ethically.