## Visual Perception and D3 Foundations :::: {.columns} ::: {.column width="50%"} ### Visual Perception - Pre-attentive processing - Gestalt principles - Perceptual accuracy - Channel effectiveness ::: ::: {.column width="50%"} ### D3.js Introduction - Core concepts - DOM manipulation - Data binding - Basic charts ::: :::: ## Quick Recap 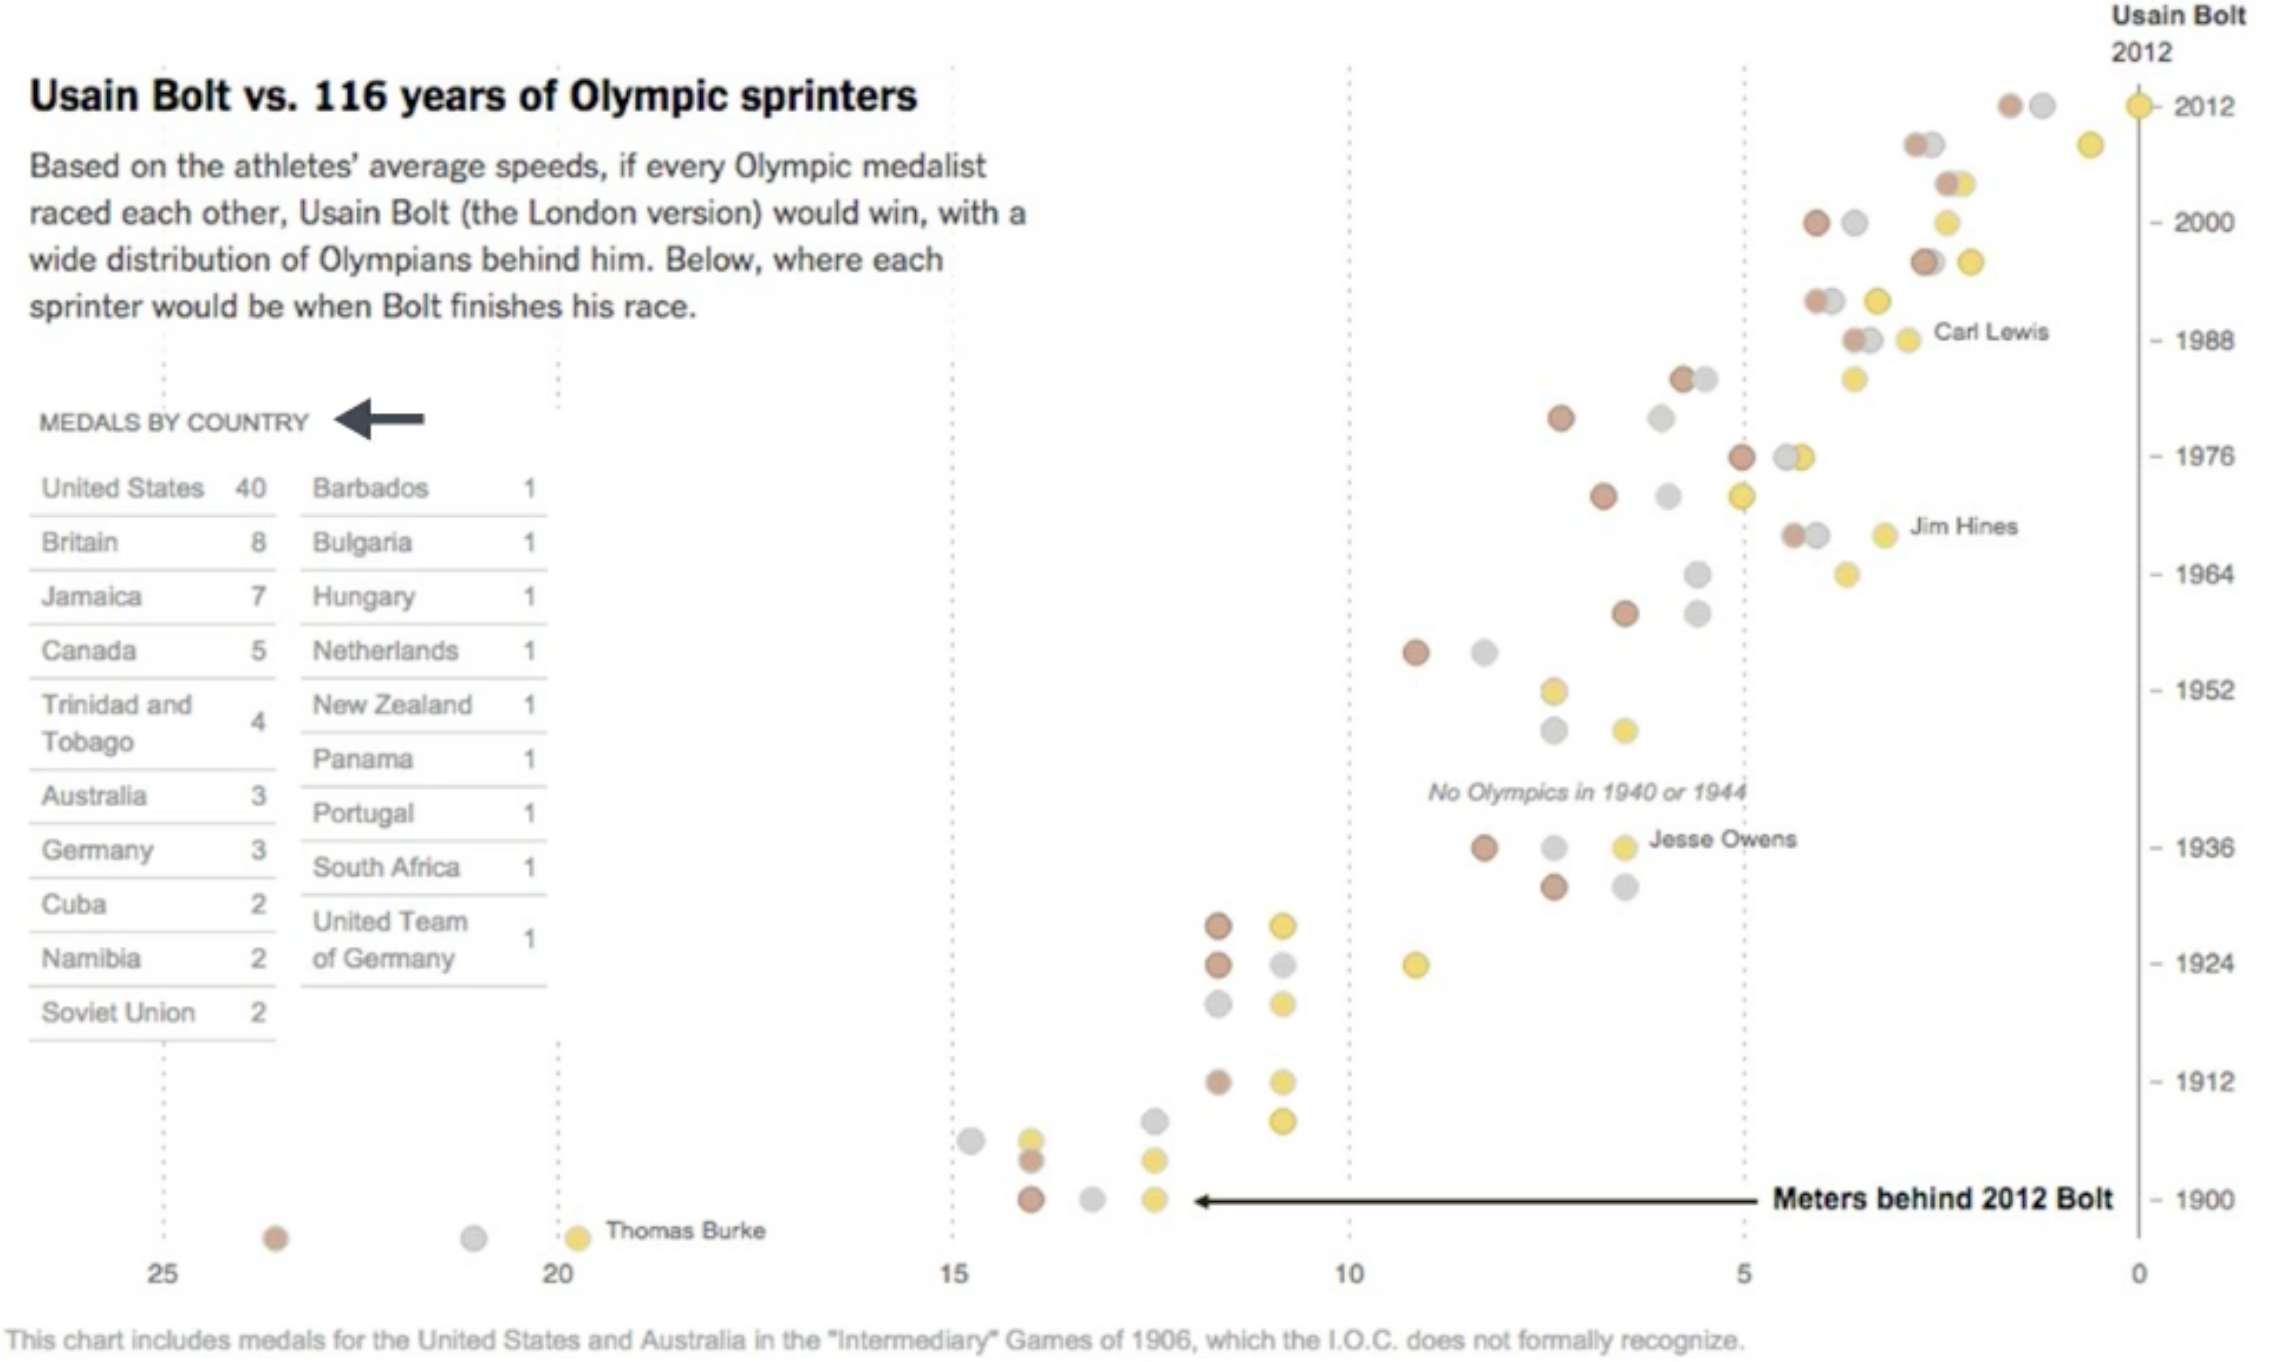{width="60%"} ## Design Principles - **Expressiveness**: A set of facts is expressible in a visual language if the sentences in the language express all the facts in the set of data, and only the facts in the data - **Effectiveness**: A visualization is more effective than another visualization if the information conveyed by one visualization is more readily perceived than the information in the other visualization ::: footer Mackinlay 86 ::: ## Design Principles Translated - **Expressiveness**: Tell the truth and nothing but the truth (don't lie, and don't lie by omission) - **Effectiveness**: Use encodings that people decode better (where better == faster and/or more accurate) ## Effectiveness measures - **Accuracy**: Estimating magnitudes - **Discriminability**: number of values one can distinguish - **Saliency**: attracting attention - **Separability**: interference between channels - **Grouping**: pattern formation ## Perception for Design 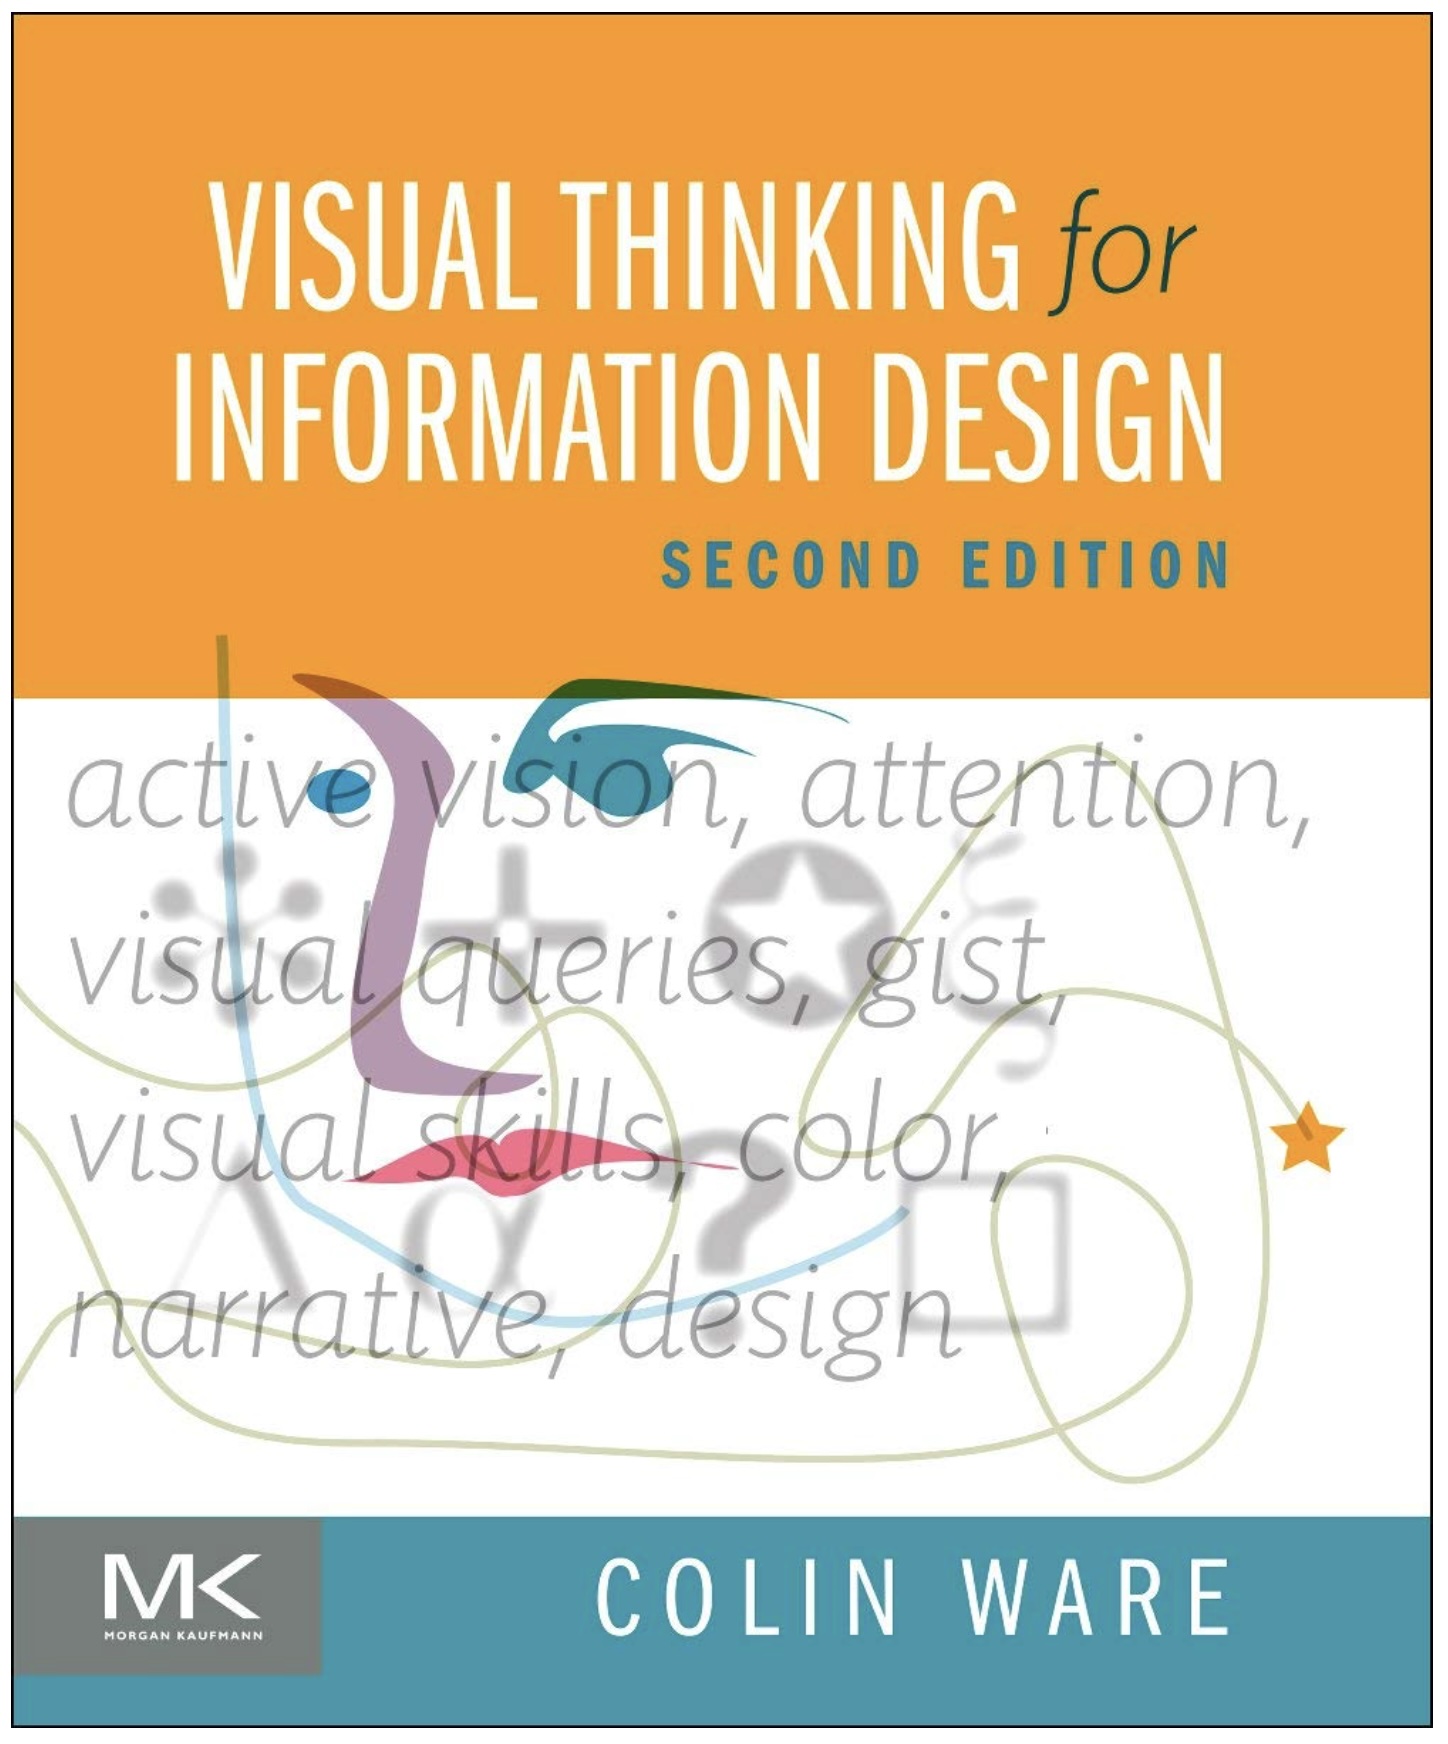{width="60%"} ## The Brain and Vision "Visual thinking consists of a series of acts of attention, driving eye movements, and tuning our pattern finding circuits" - Colin Ware 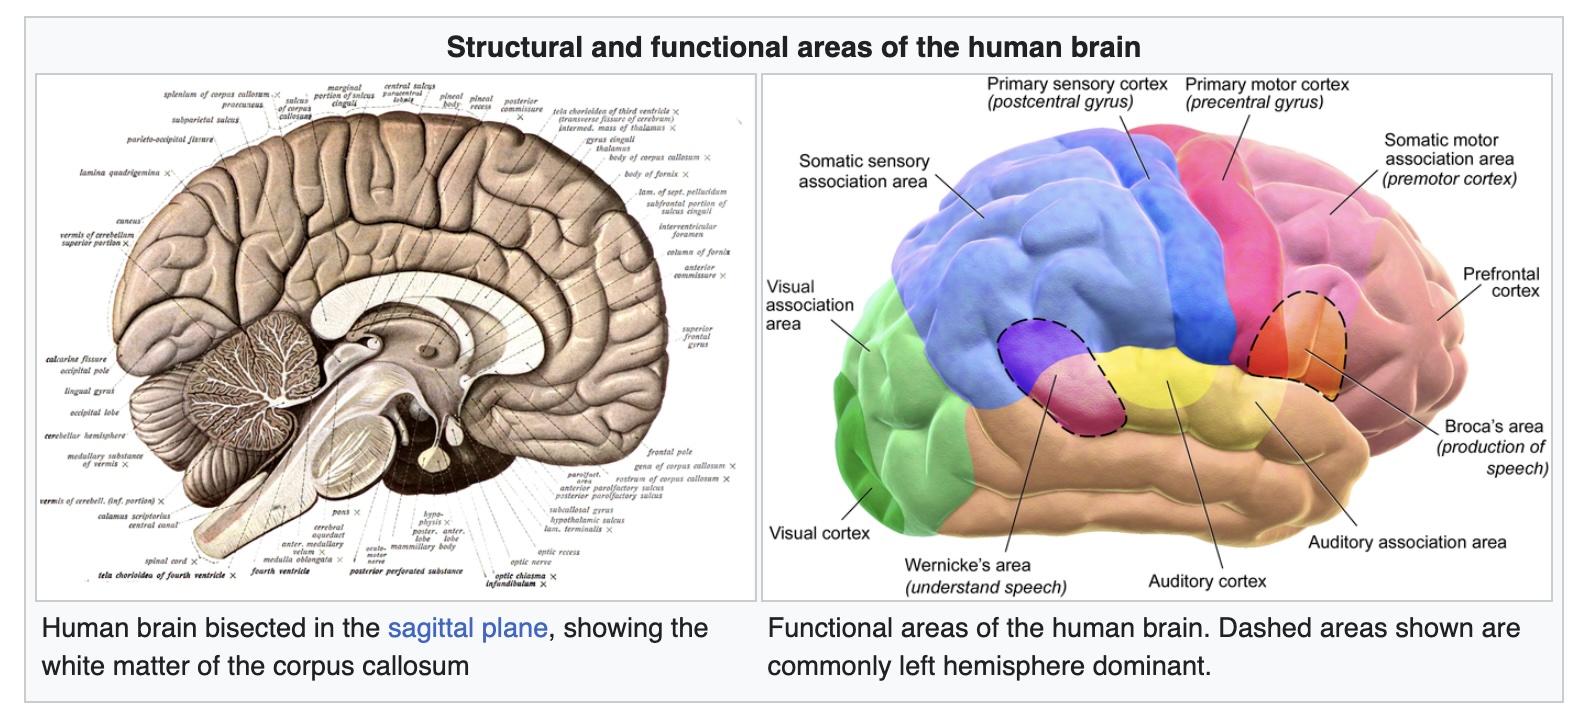{width="70%"} ::: footer Image from Wikipedia: [Human brain](https://en.wikipedia.org/wiki/Human_brain) ::: ## The Visual Brain 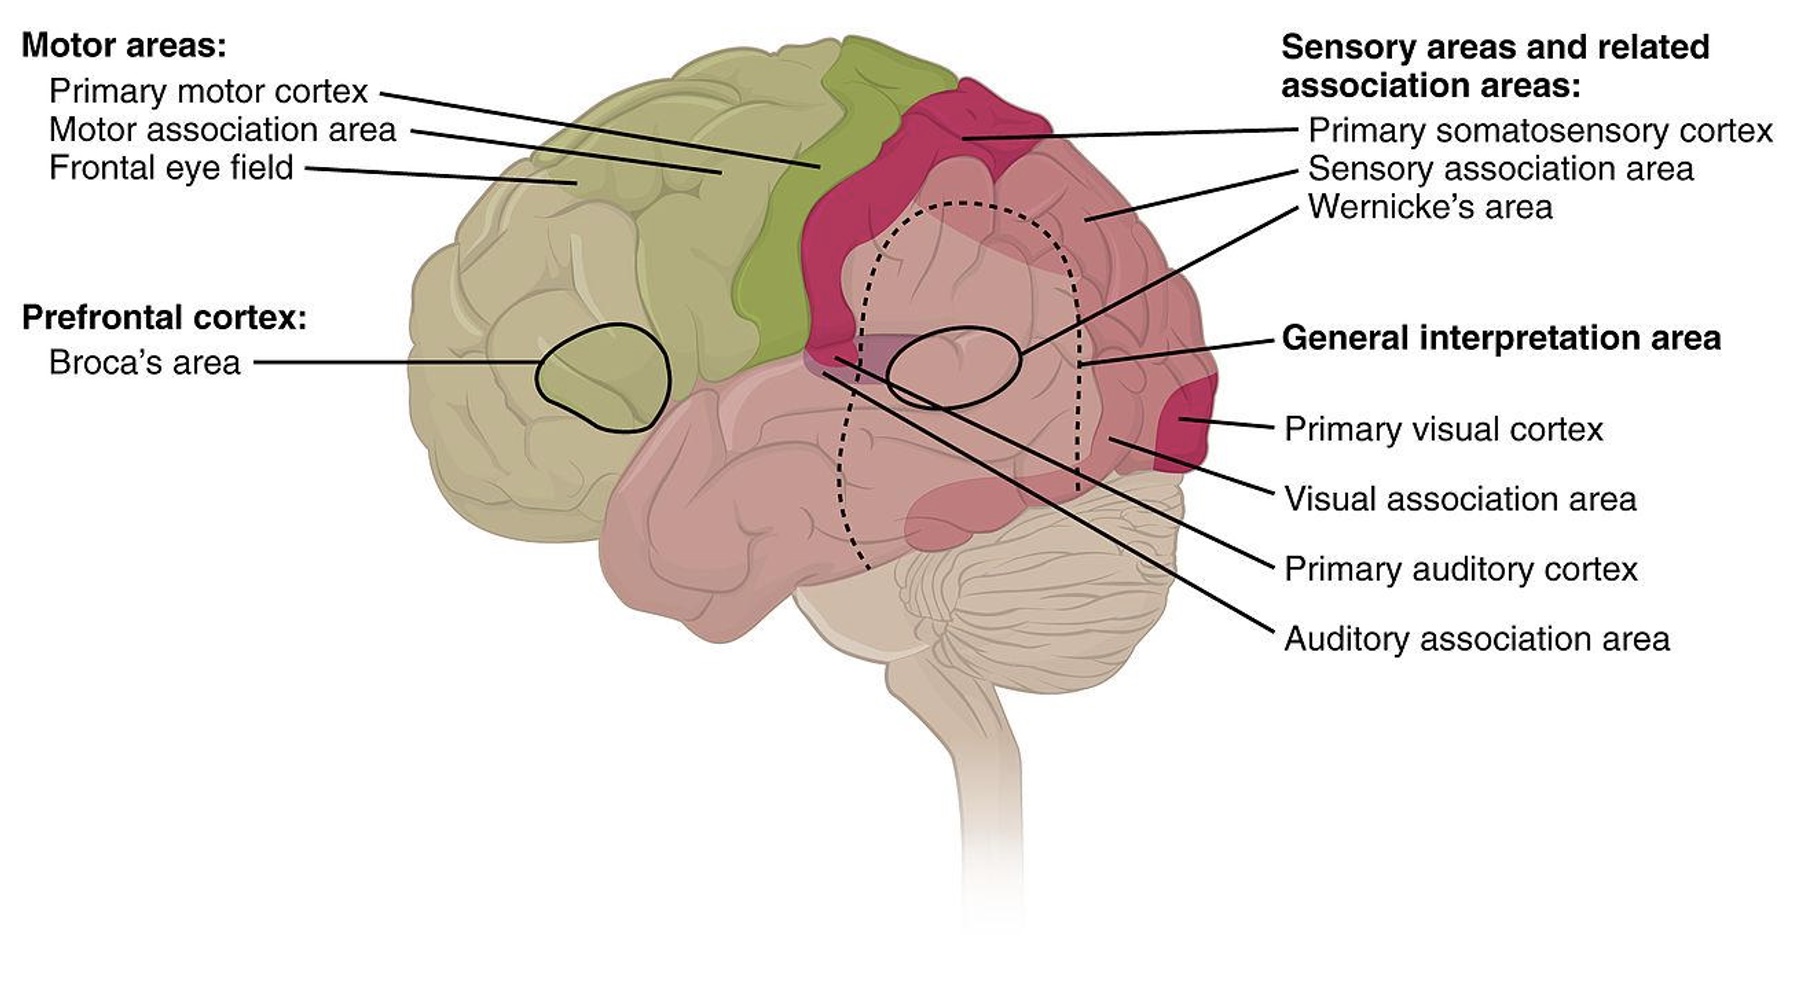{width="80%"} ::: footer Image from Wikipedia: [Human brain](https://en.wikipedia.org/wiki/Human_brain) ::: ## The Act of Perception * Bottom-Up and Top-Down Processes 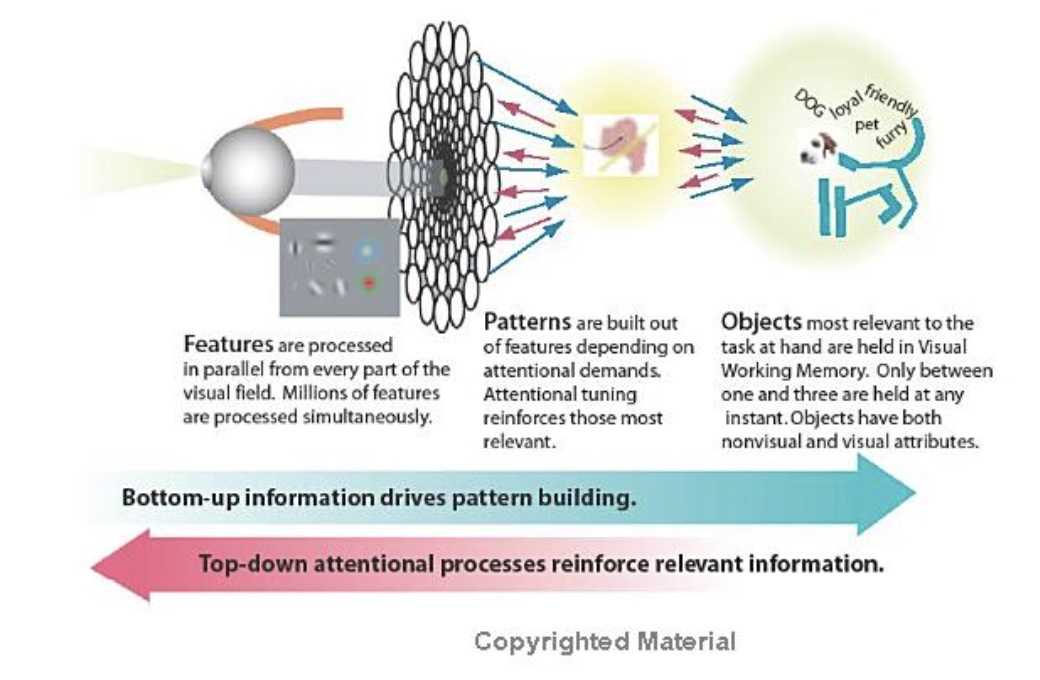{width="60%"} ::: footer Material from Colin Ware's book ::: ## Bottom-up Processing * Information is successively selected and filtered into patterns as it passes through stages: 1. Optical nerve to V1 Cortex 2. Use texture and colors to aggregate *patterns* 3. Visual objects recognized in *visual working memory* 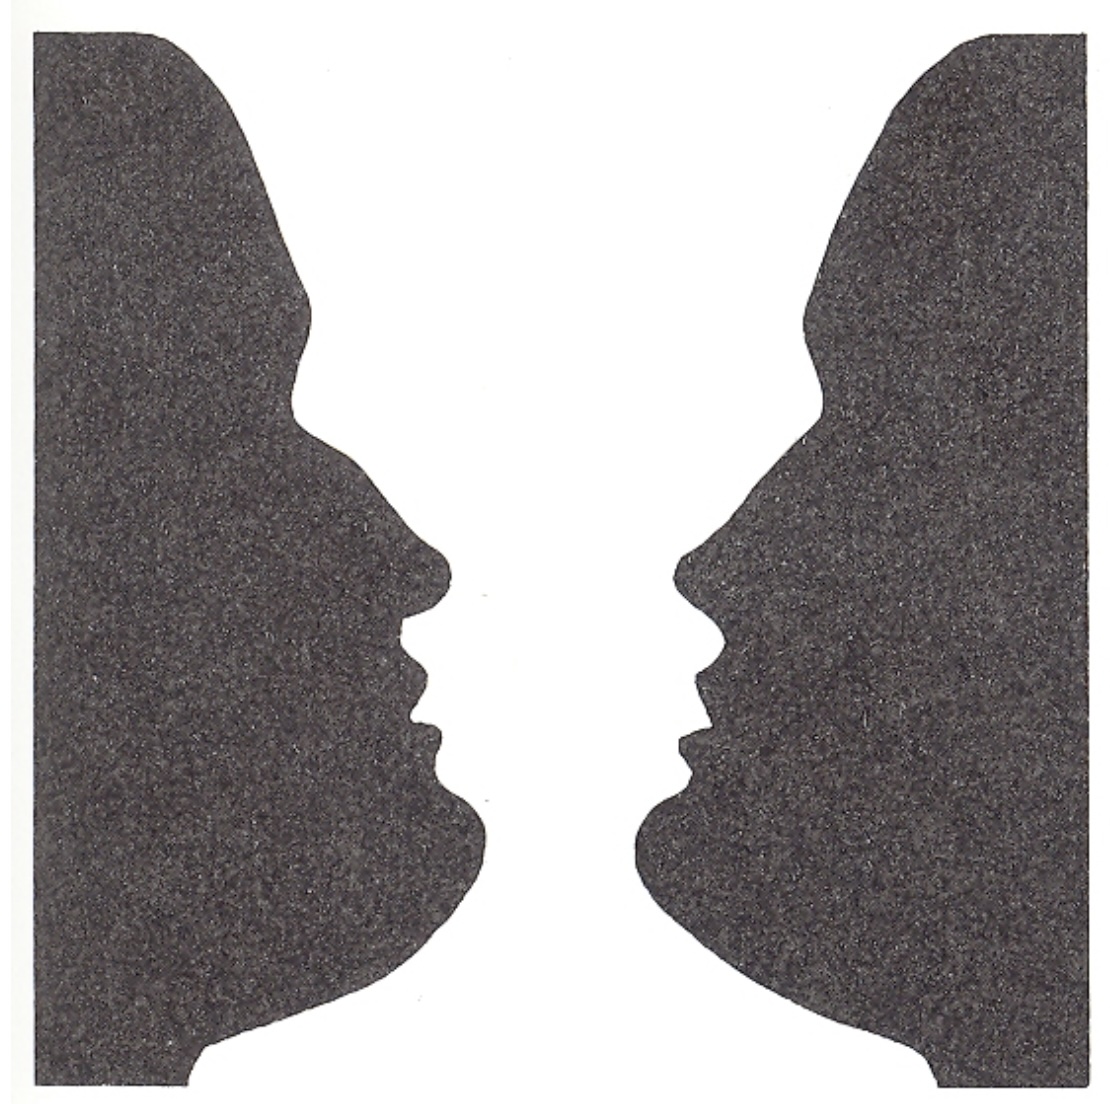{width="40%"} ::: footer Image from "Eye and Brain: The Psychology of Seeing", Gregory ::: ## Top-Down Processing * Every stage of bottom-up processing has a corresponding top-down process * Ware describes this as "attention" * We only get the information we need, when we need it 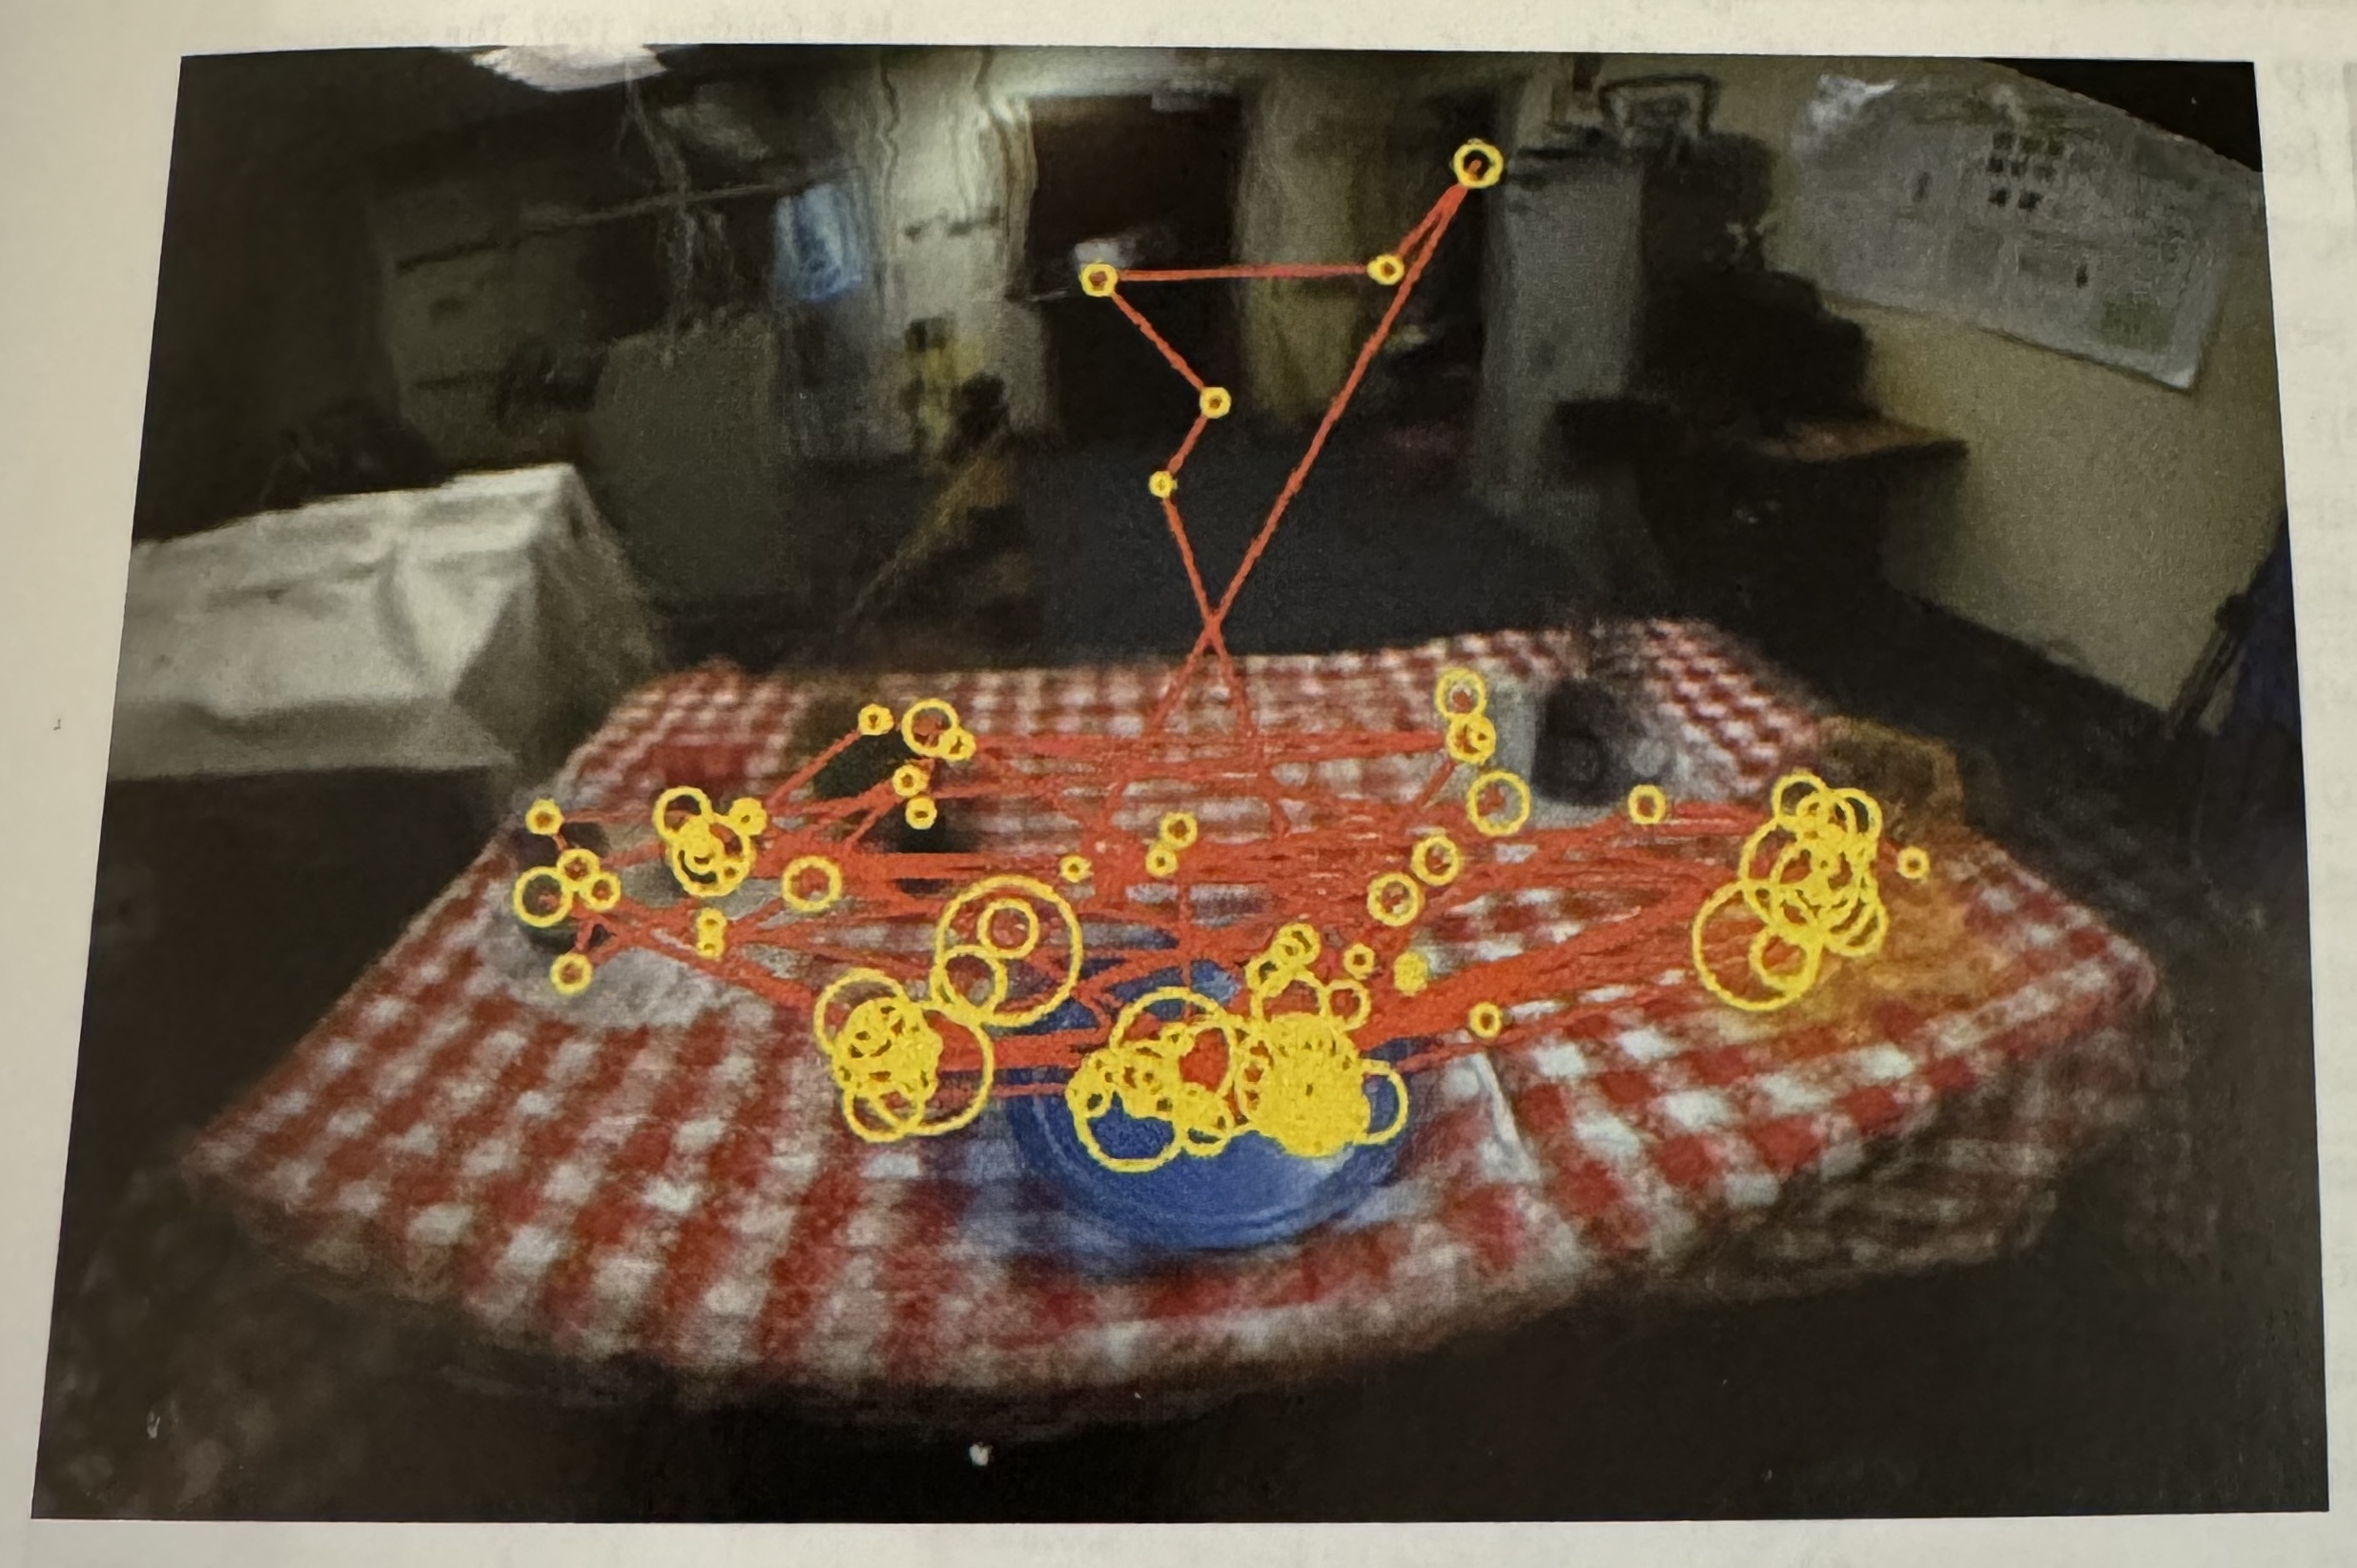{width="60%"} ::: footer Material from Colin Ware's book ::: ## Implications for Design * "Just-in-time visual queries" (Ware) * "The brain operates as a set of nested loops. Outer loops deal with generality while inner loops process detail." (Ware) 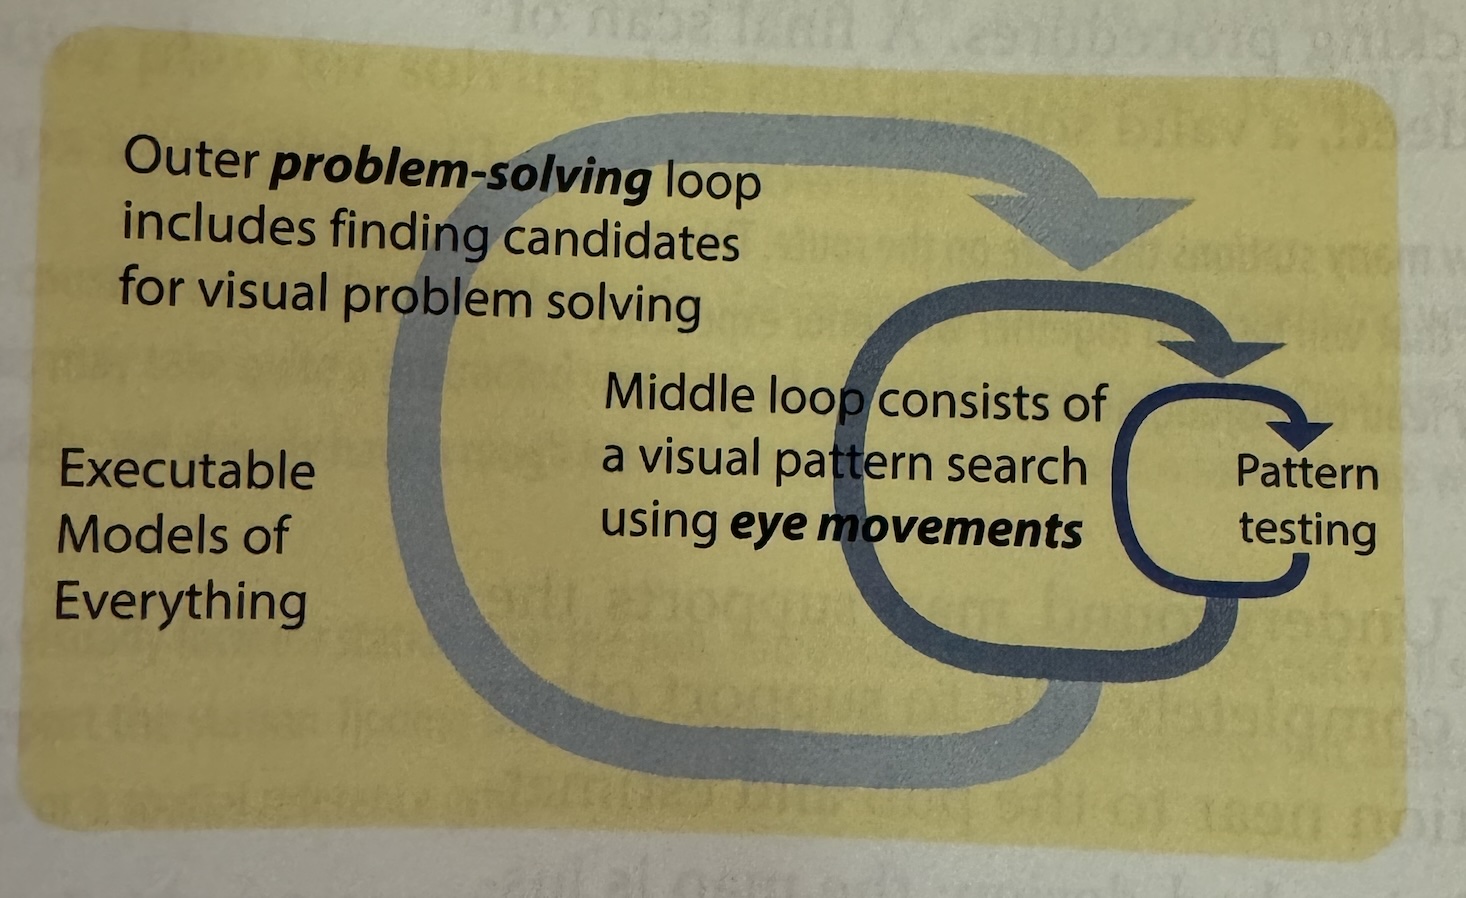{width="60%"} ::: footer Material from Colin Ware's book ::: ## Low-Level Feature Analysis * David Hubel and Torsten Wiesel won Nobel Prize for this discovery * Visual cortex contains specialized cells for detecting edges, orientations, and motion 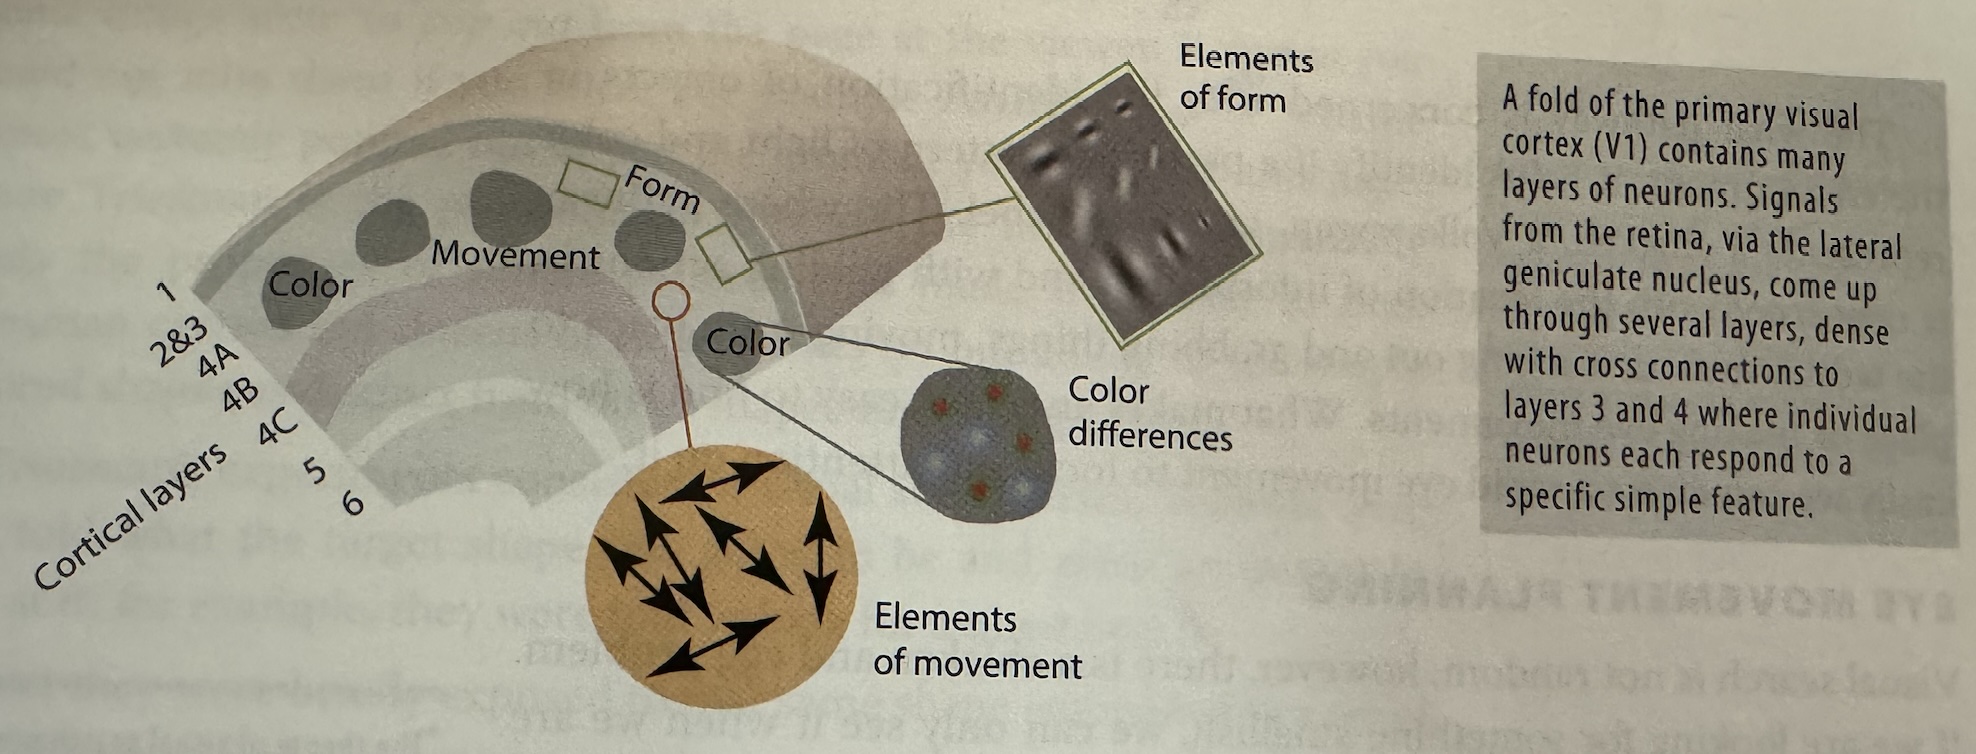{width="70%"} ::: footer Material from Colin Ware's book ::: ## What and Where Pathways :::: {.columns} ::: {.column width="40%"} * **What pathway**: Object identification * **Where pathway**: Object location and eye movement ::: ::: {.column width="60%"} 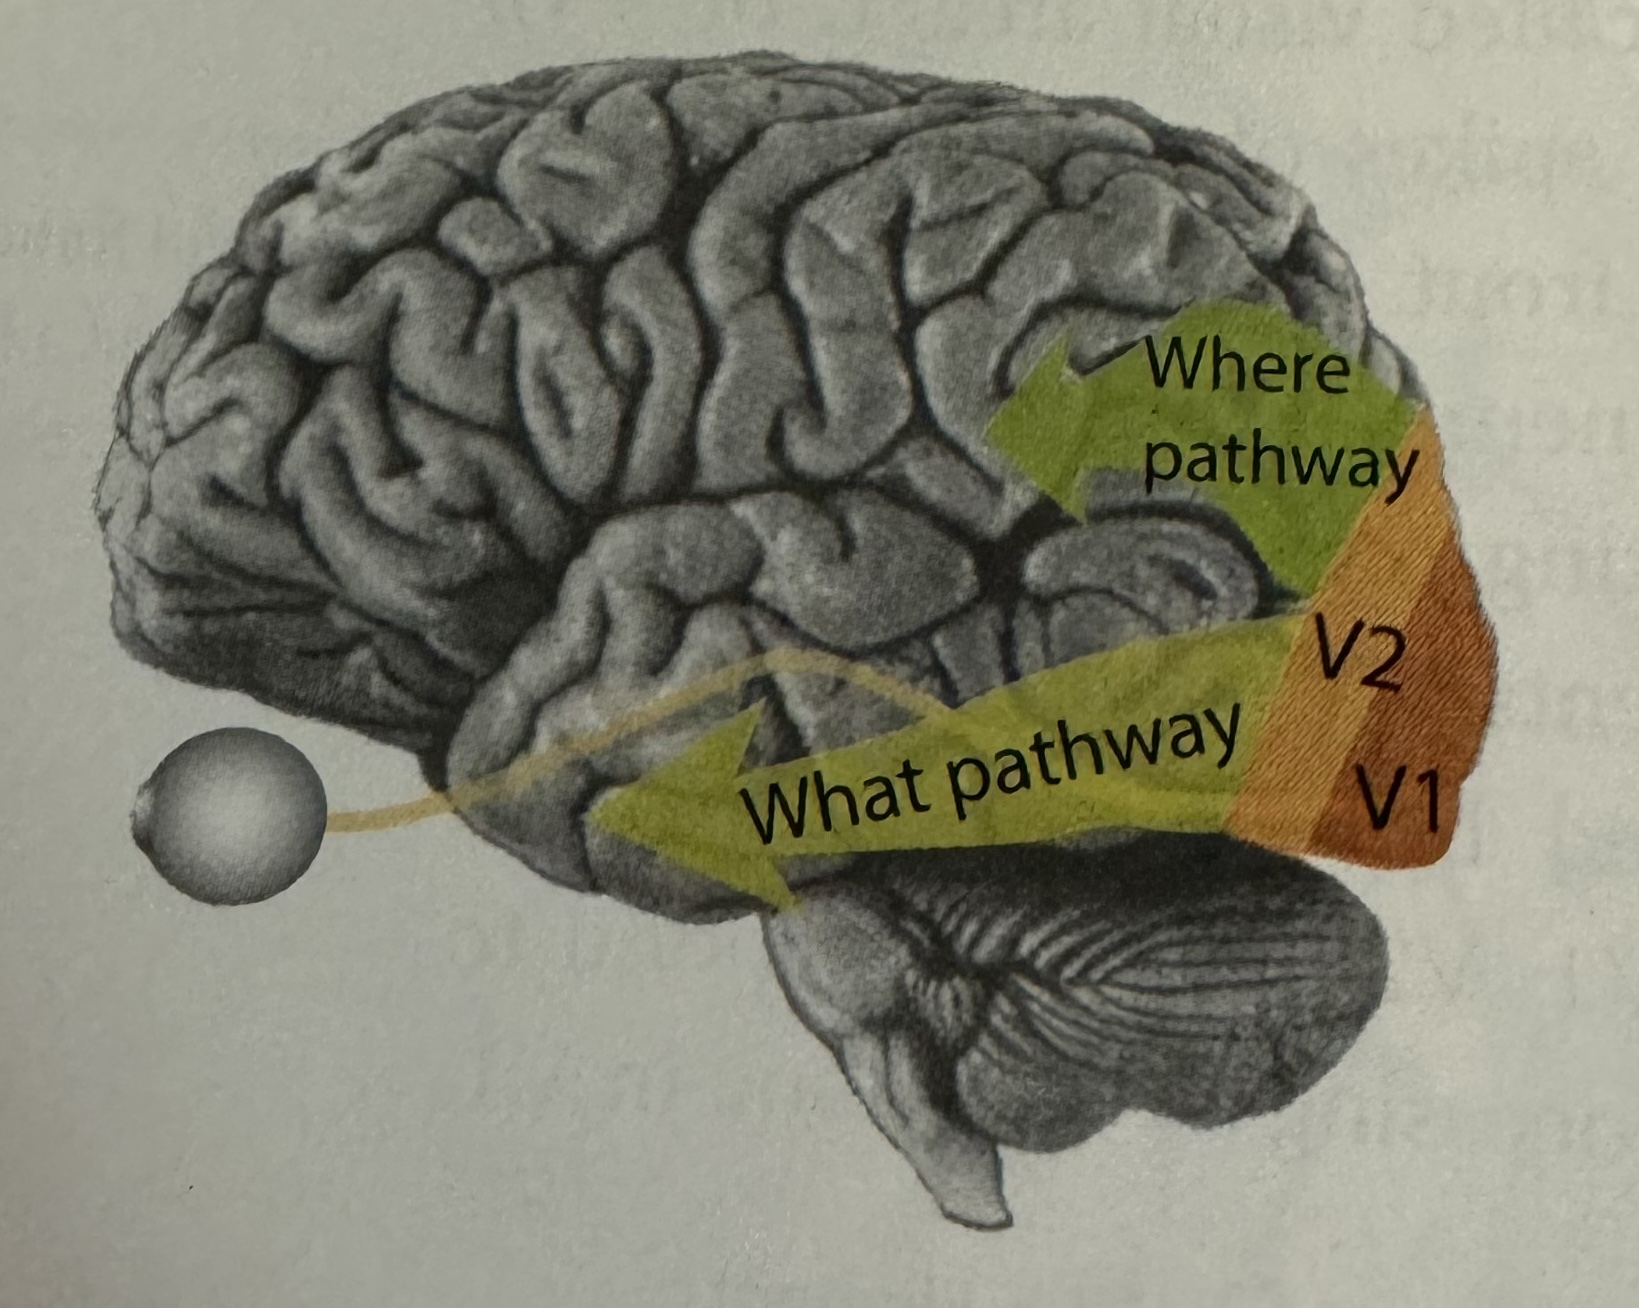 ::: :::: ::: footer Material from Colin Ware's book ::: ## Accuracy Fechner's experiment (1869) 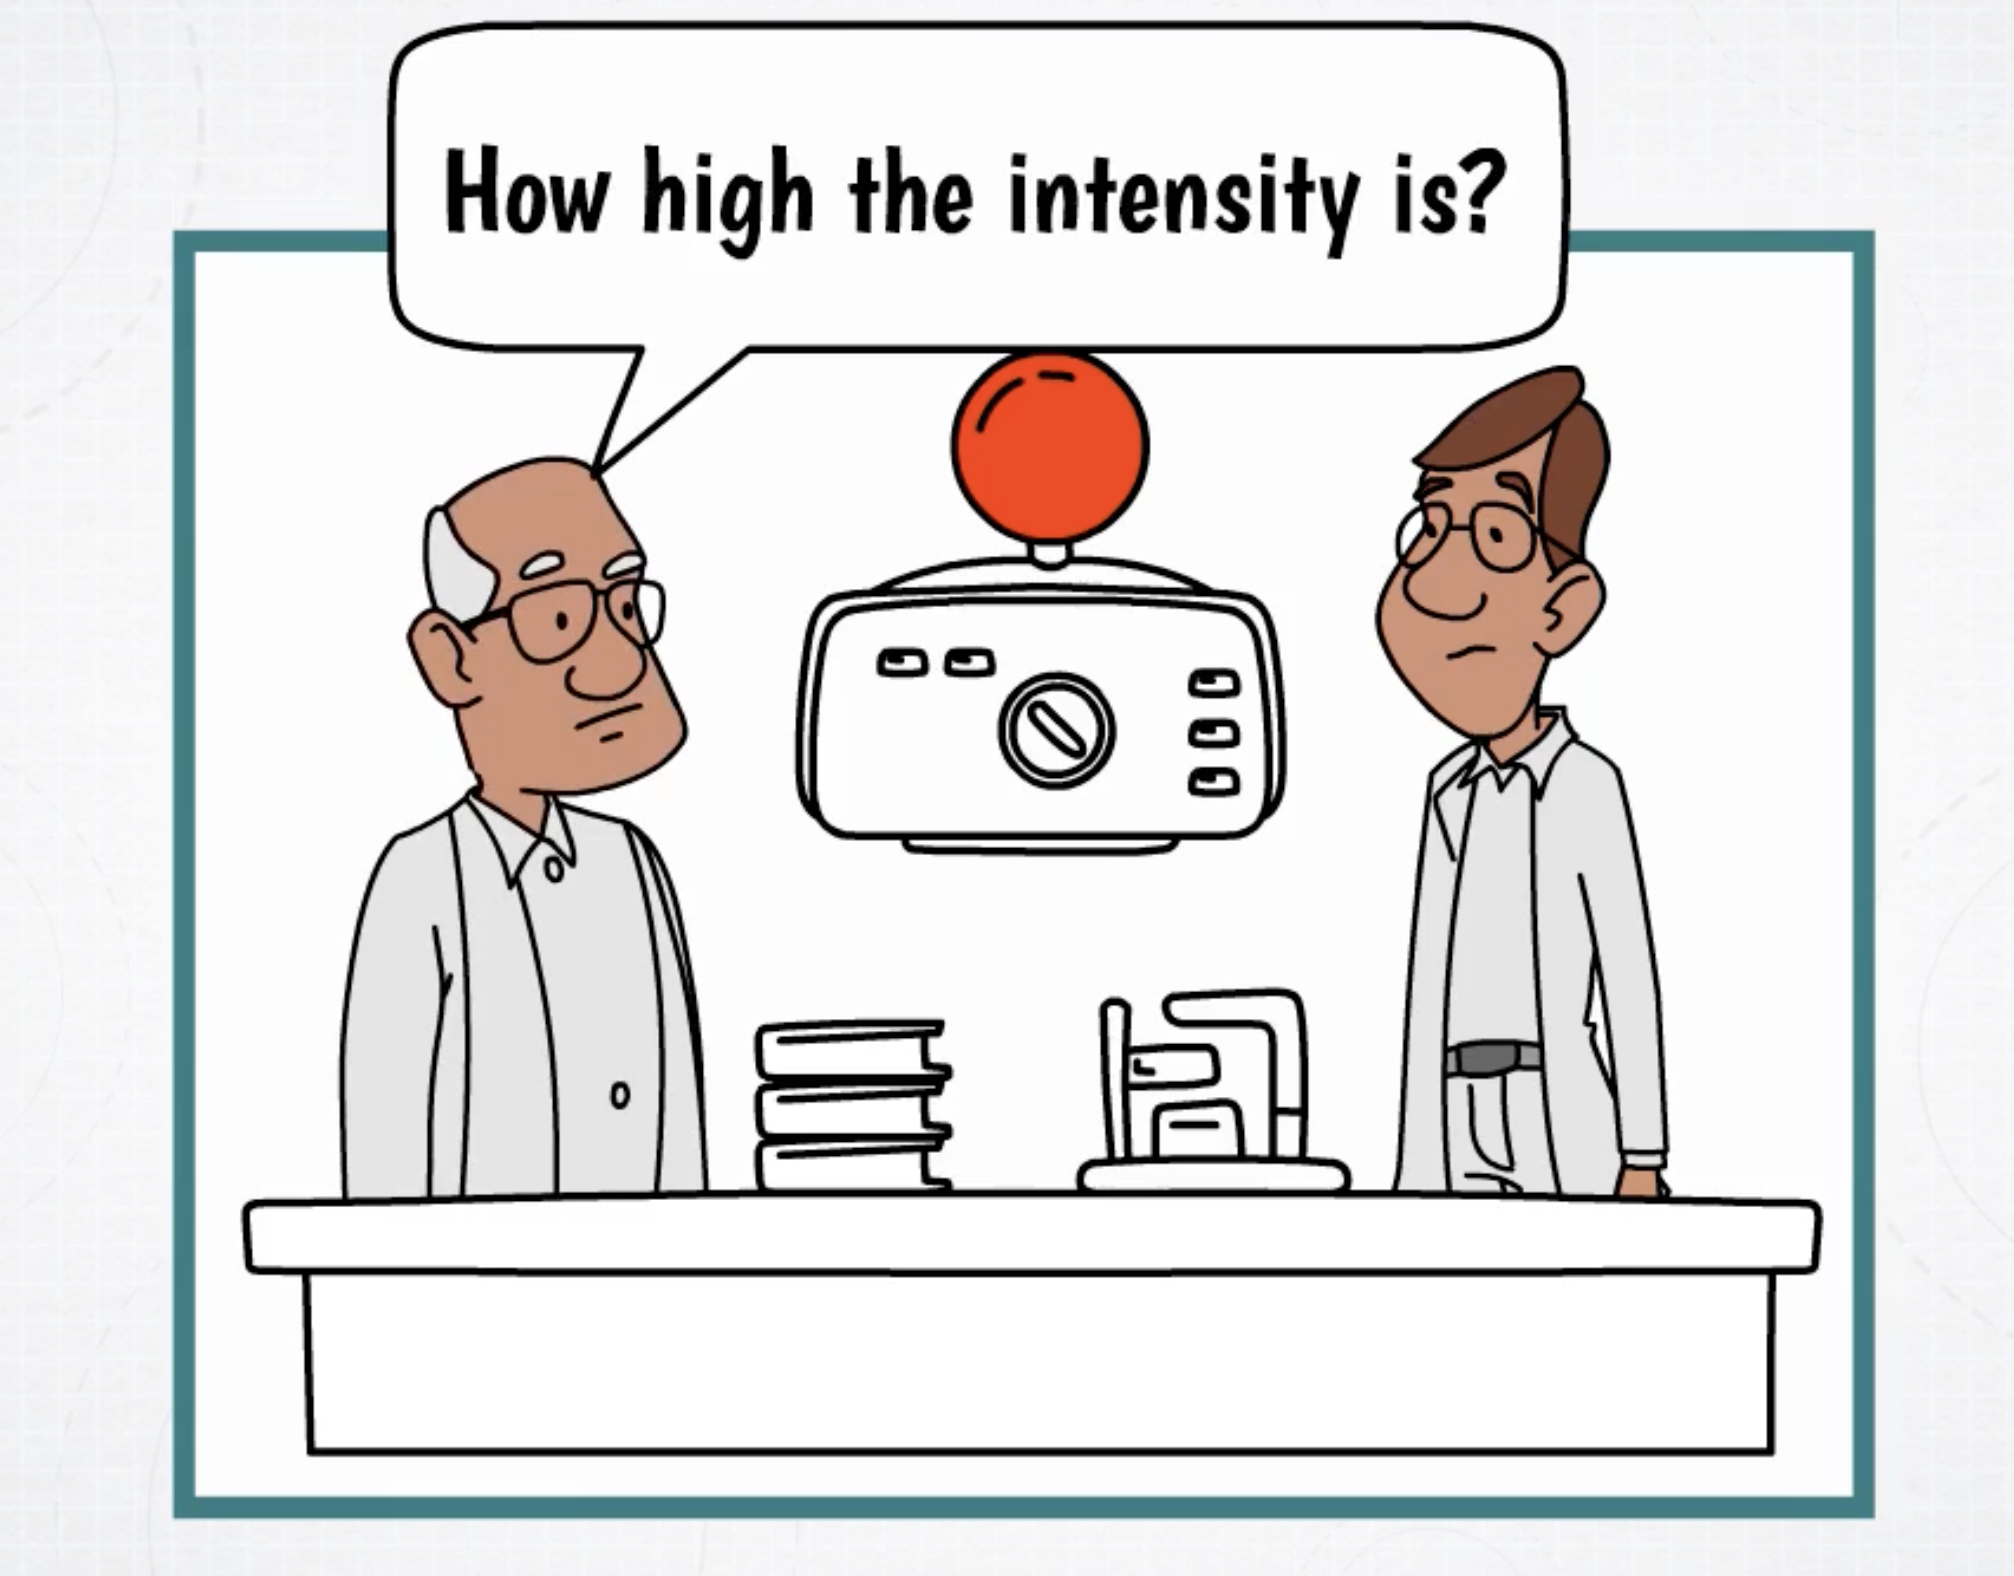{width="60%"} ## Power Law 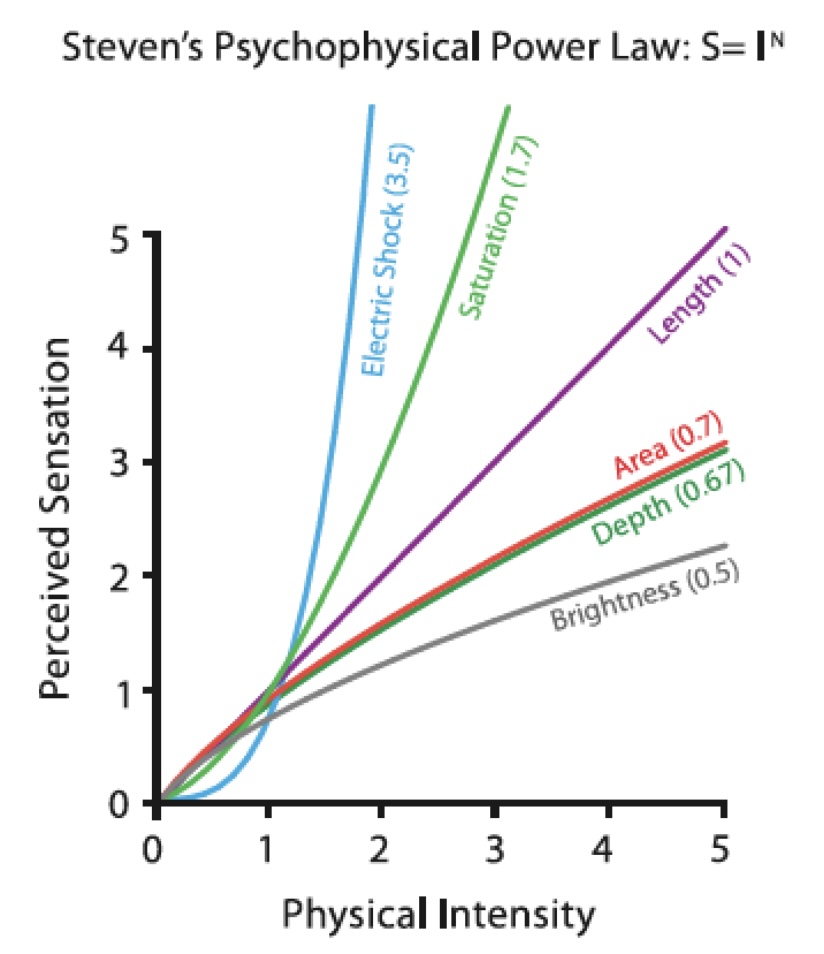{width="60%"} ## Graphical Perception :::: {.columns} ::: {.column width="50%"} 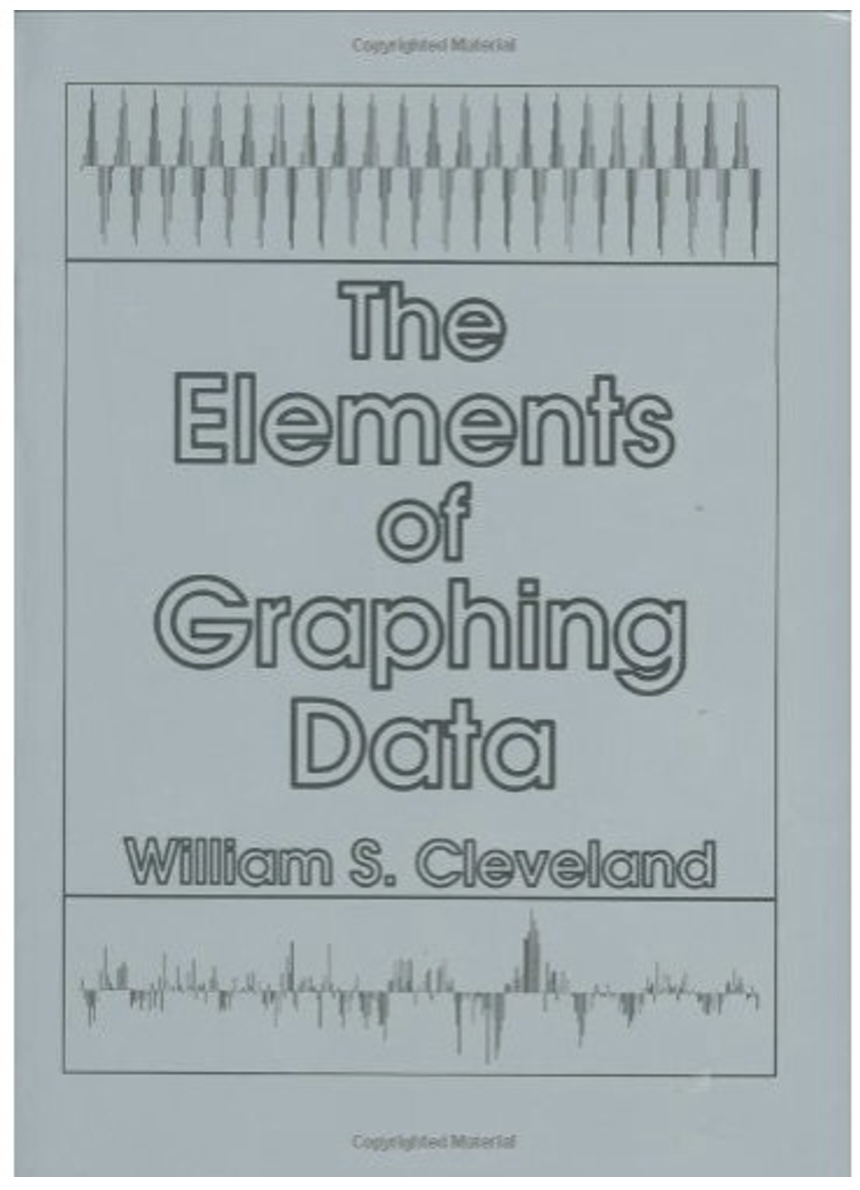 ::: ::: {.column width="50%"} 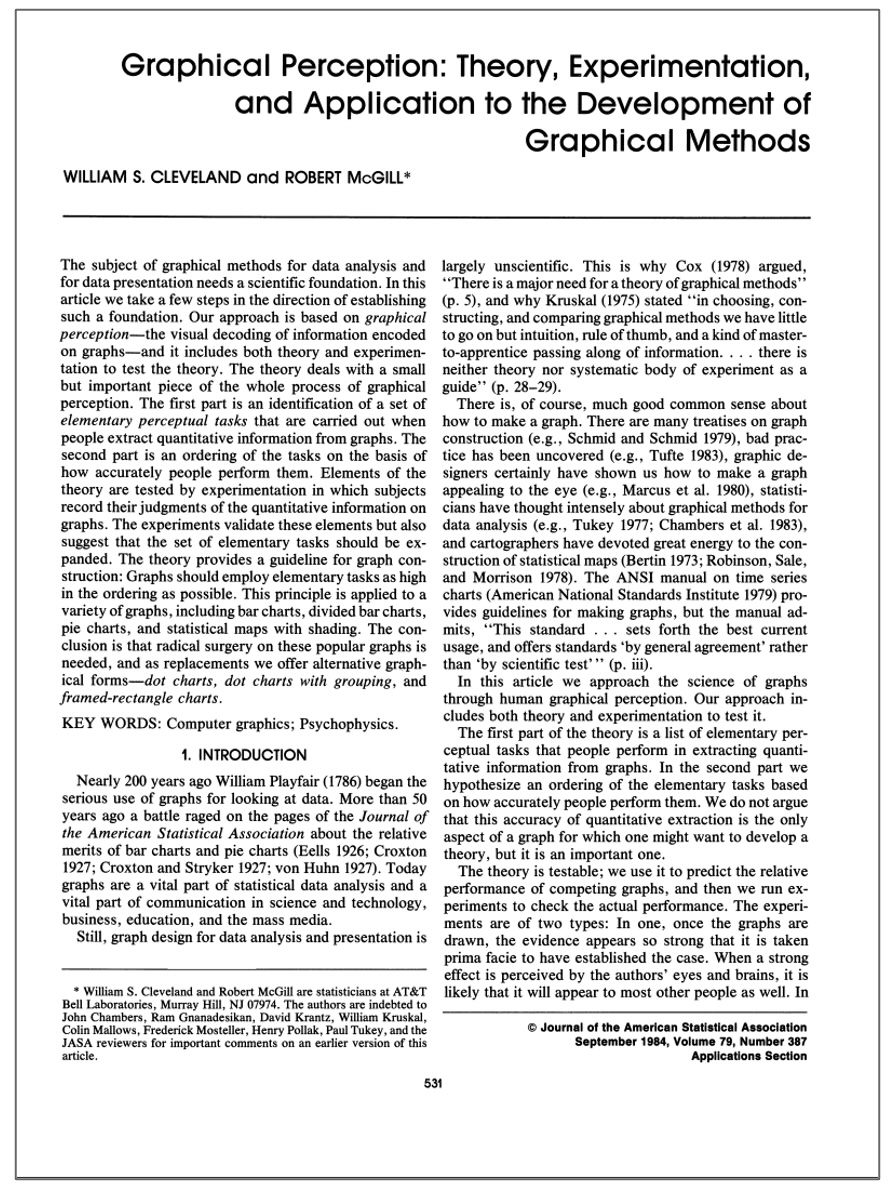 ::: :::: ::: footer Slides based on material from Prof. Enrico Bertini ::: ## Cleveland & McGill Experiment 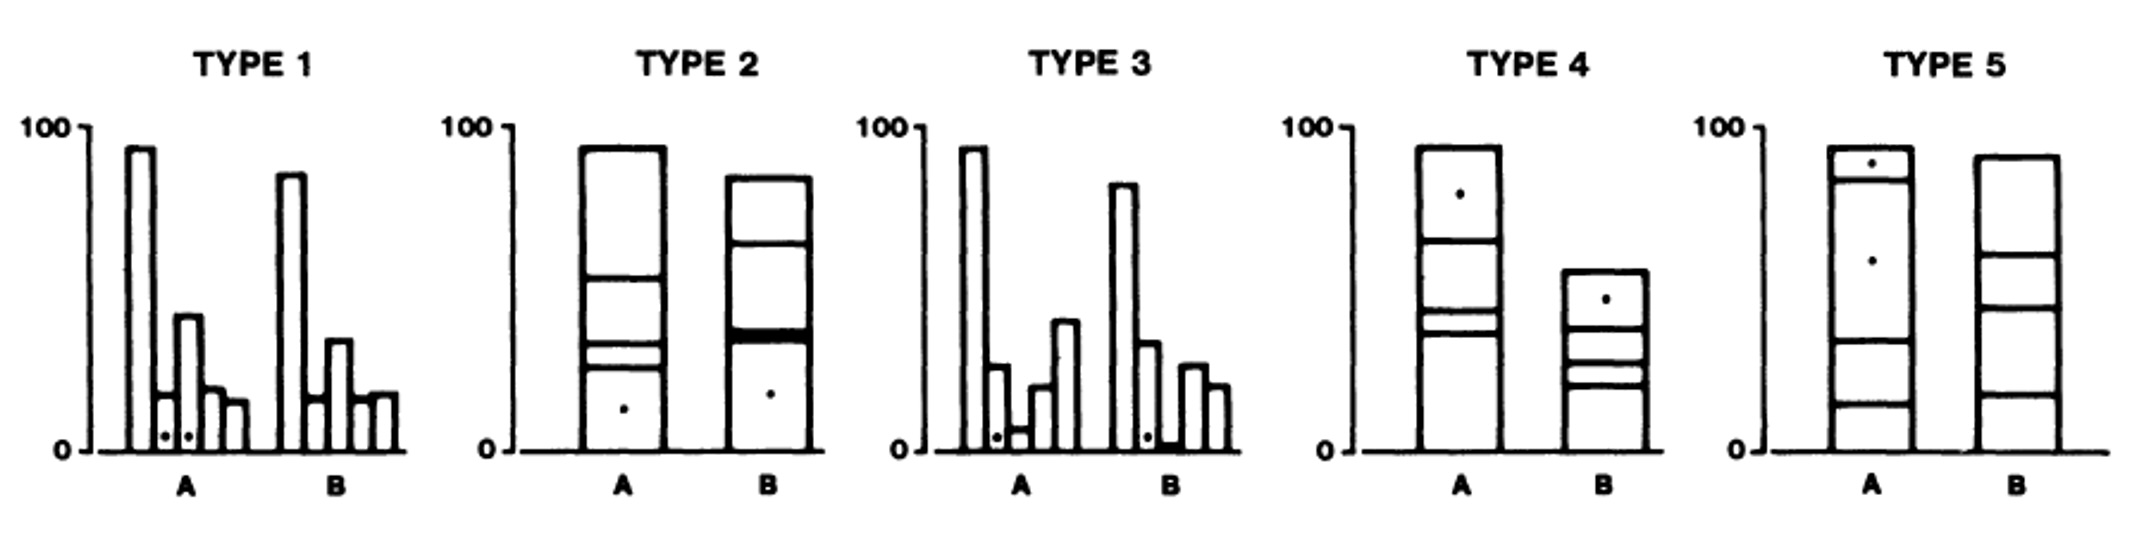{width="80%"} Task: Judge the percentage that the smaller value is of the larger ::: footer Slides based on material from Prof. Enrico Bertini ::: ## Cleveland & McGill Results 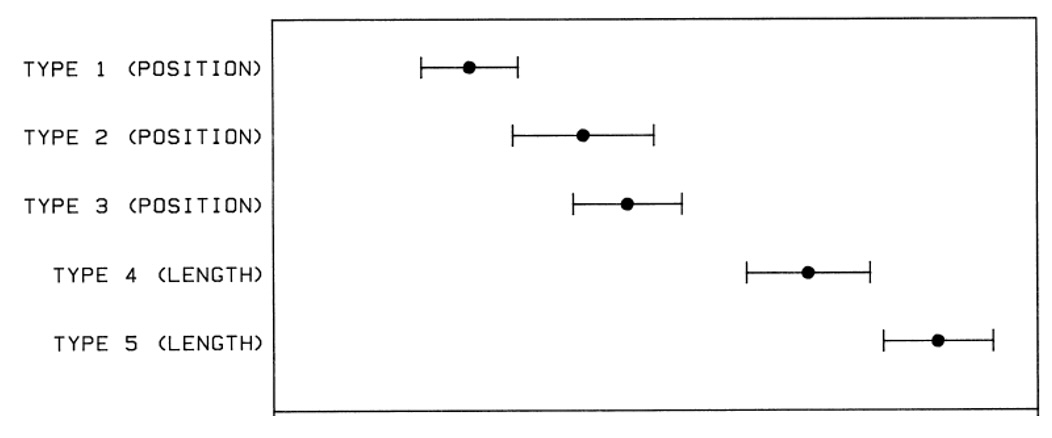{width="70%"} **Position > Length and Angle > Area** ::: footer Slides based on material from Prof. Enrico Bertini ::: ## Other Cleveland and McGill Experiment 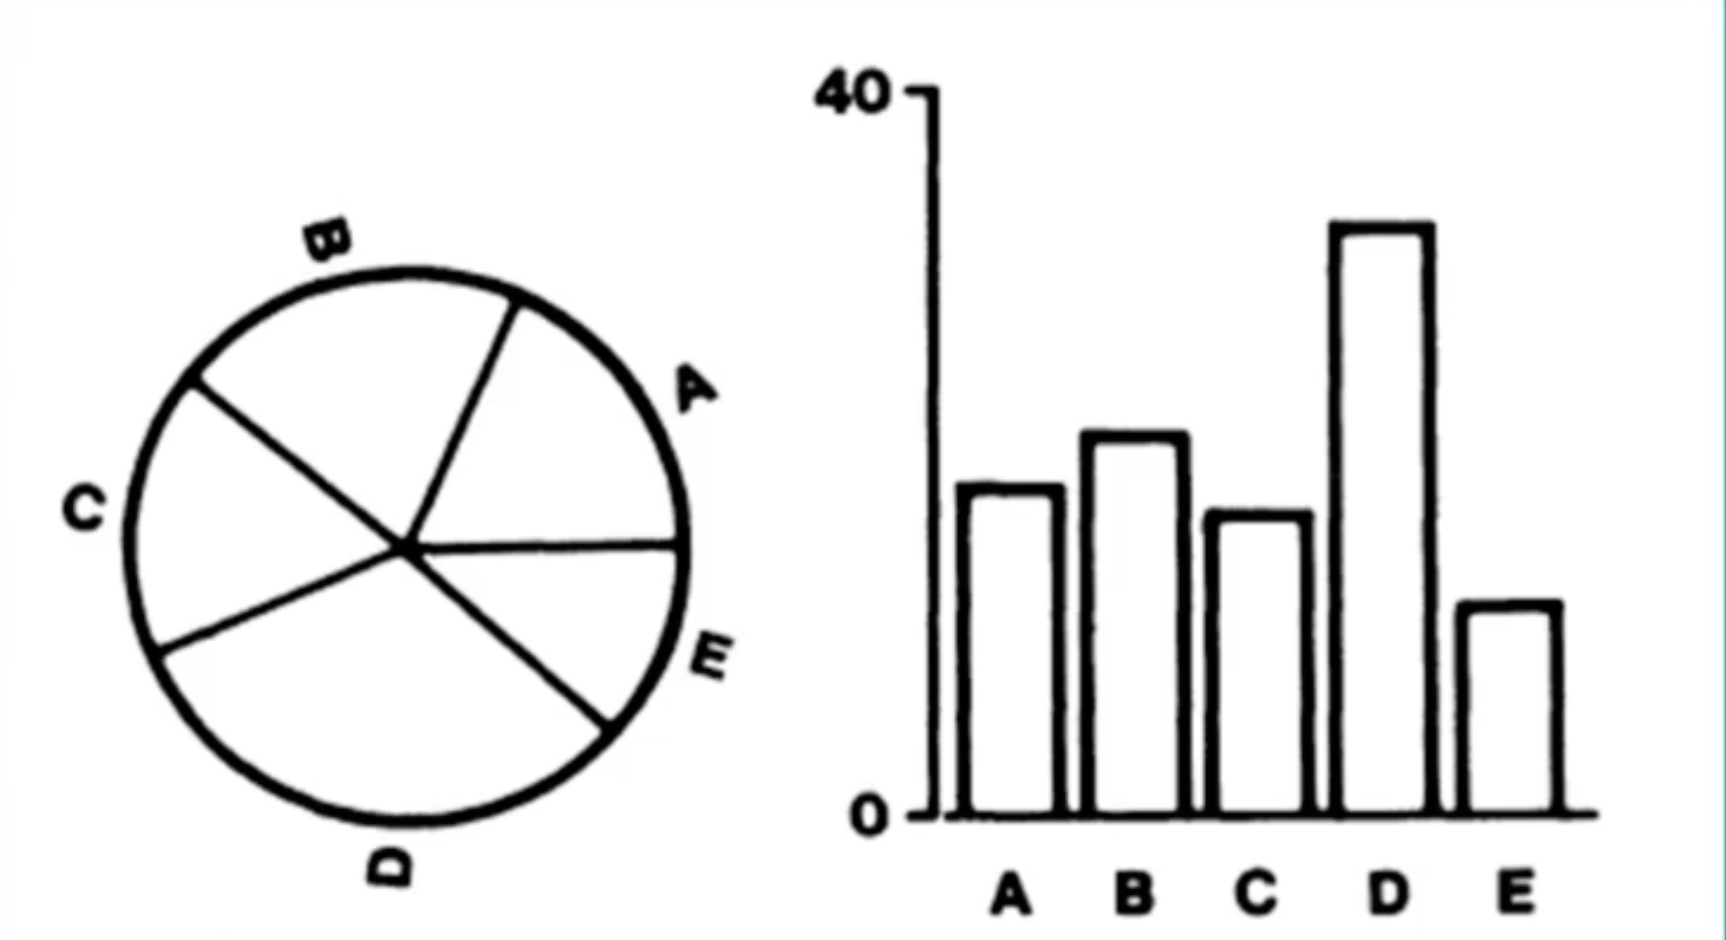{width="70%"} ::: footer Cleveland & McGill 84 ::: ## Other Cleveland and McGill Experiment 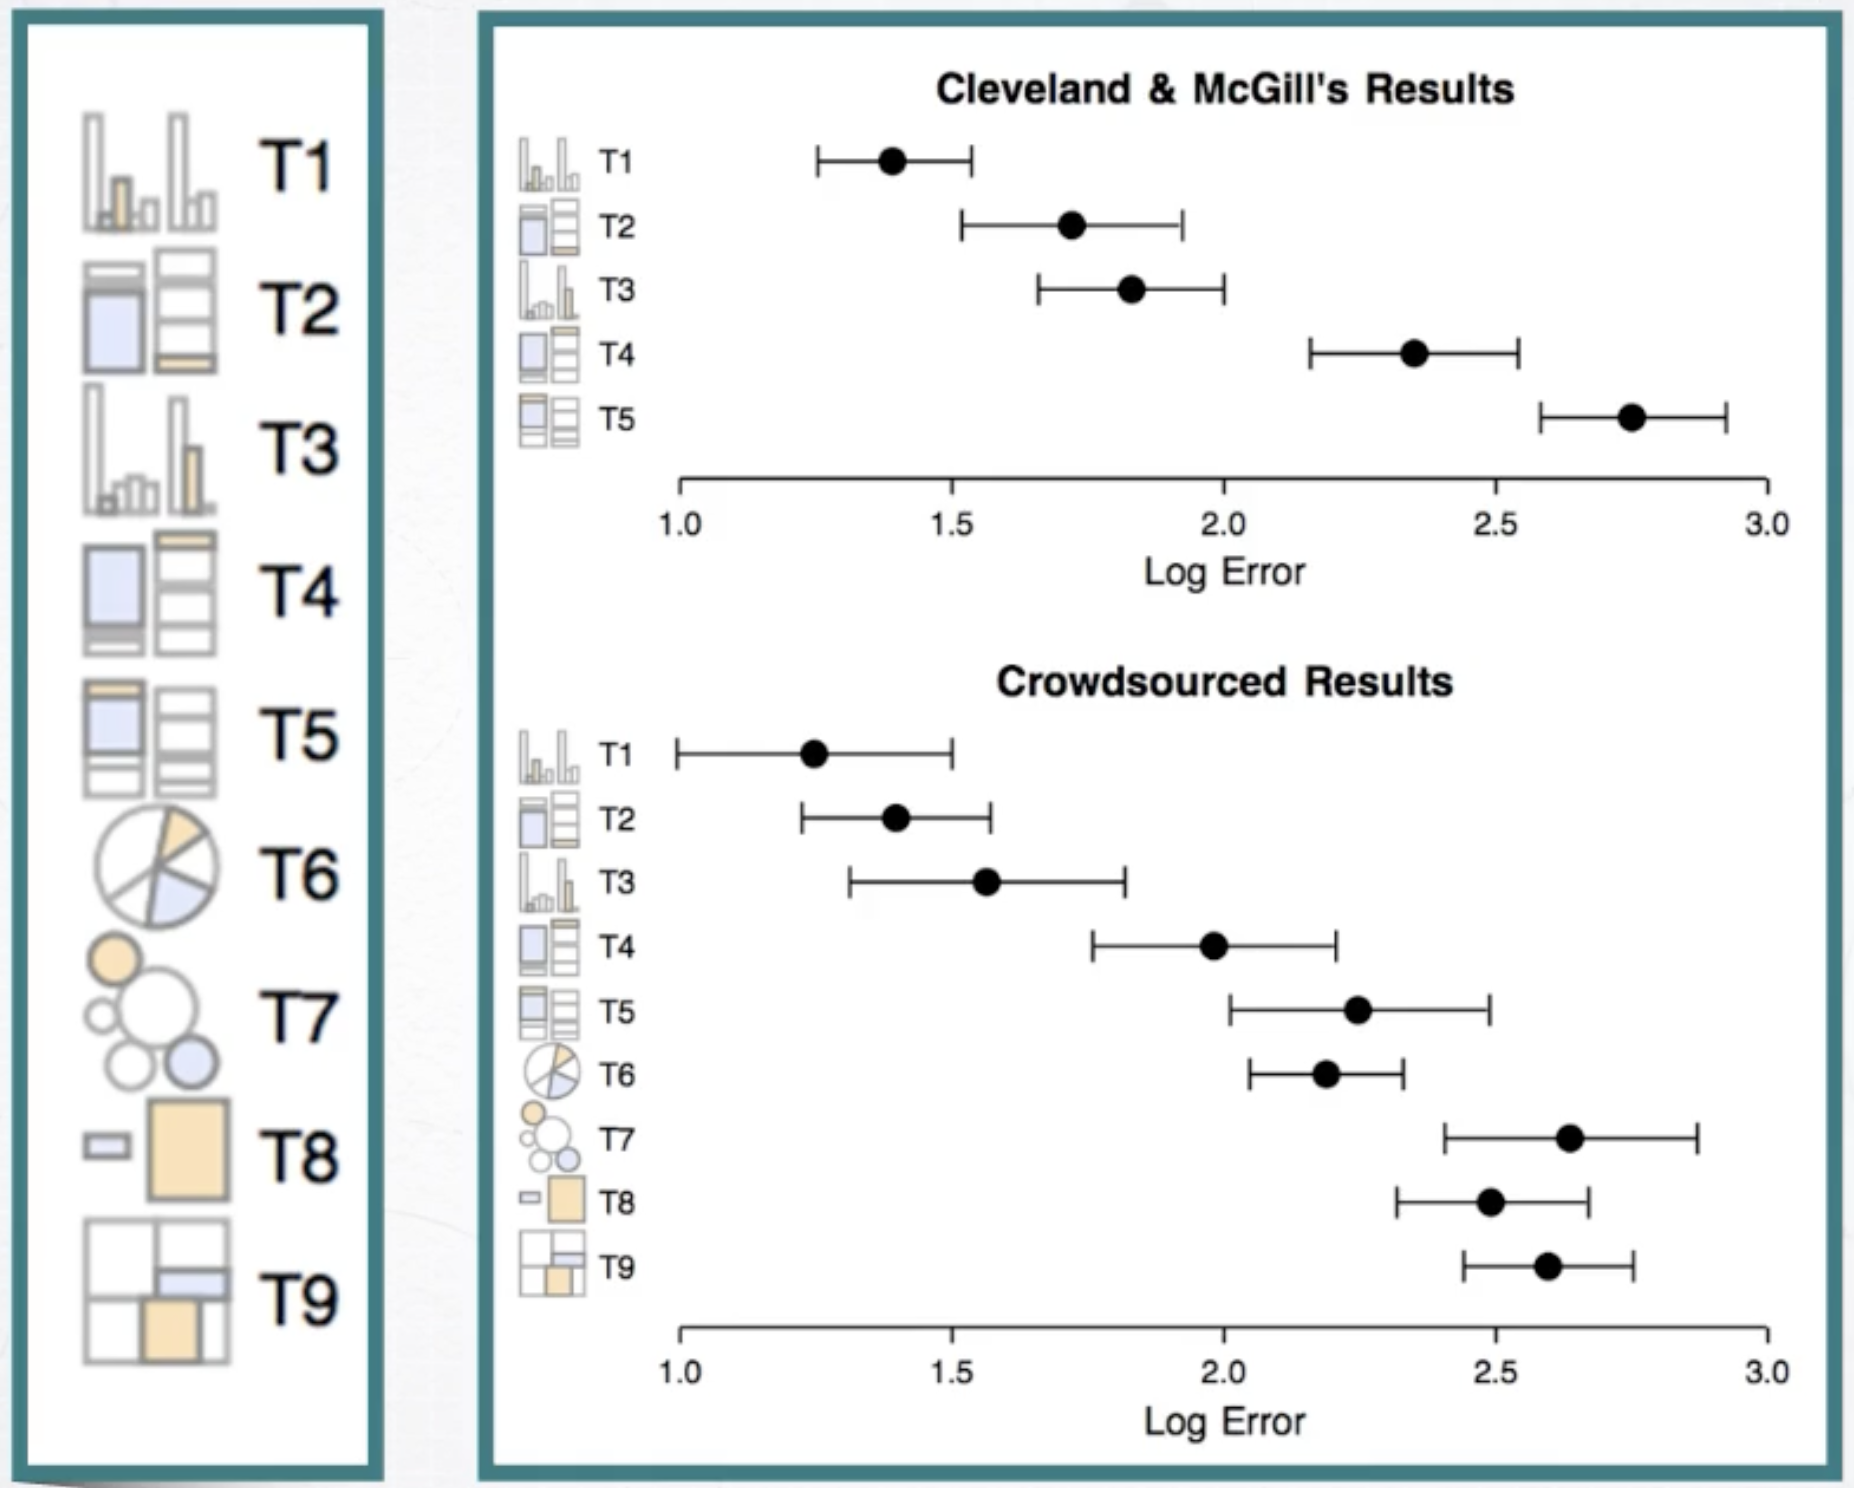{width="70%"} ::: footer Cleveland & McGill 84 ::: ## Channel Effectiveness Ranking 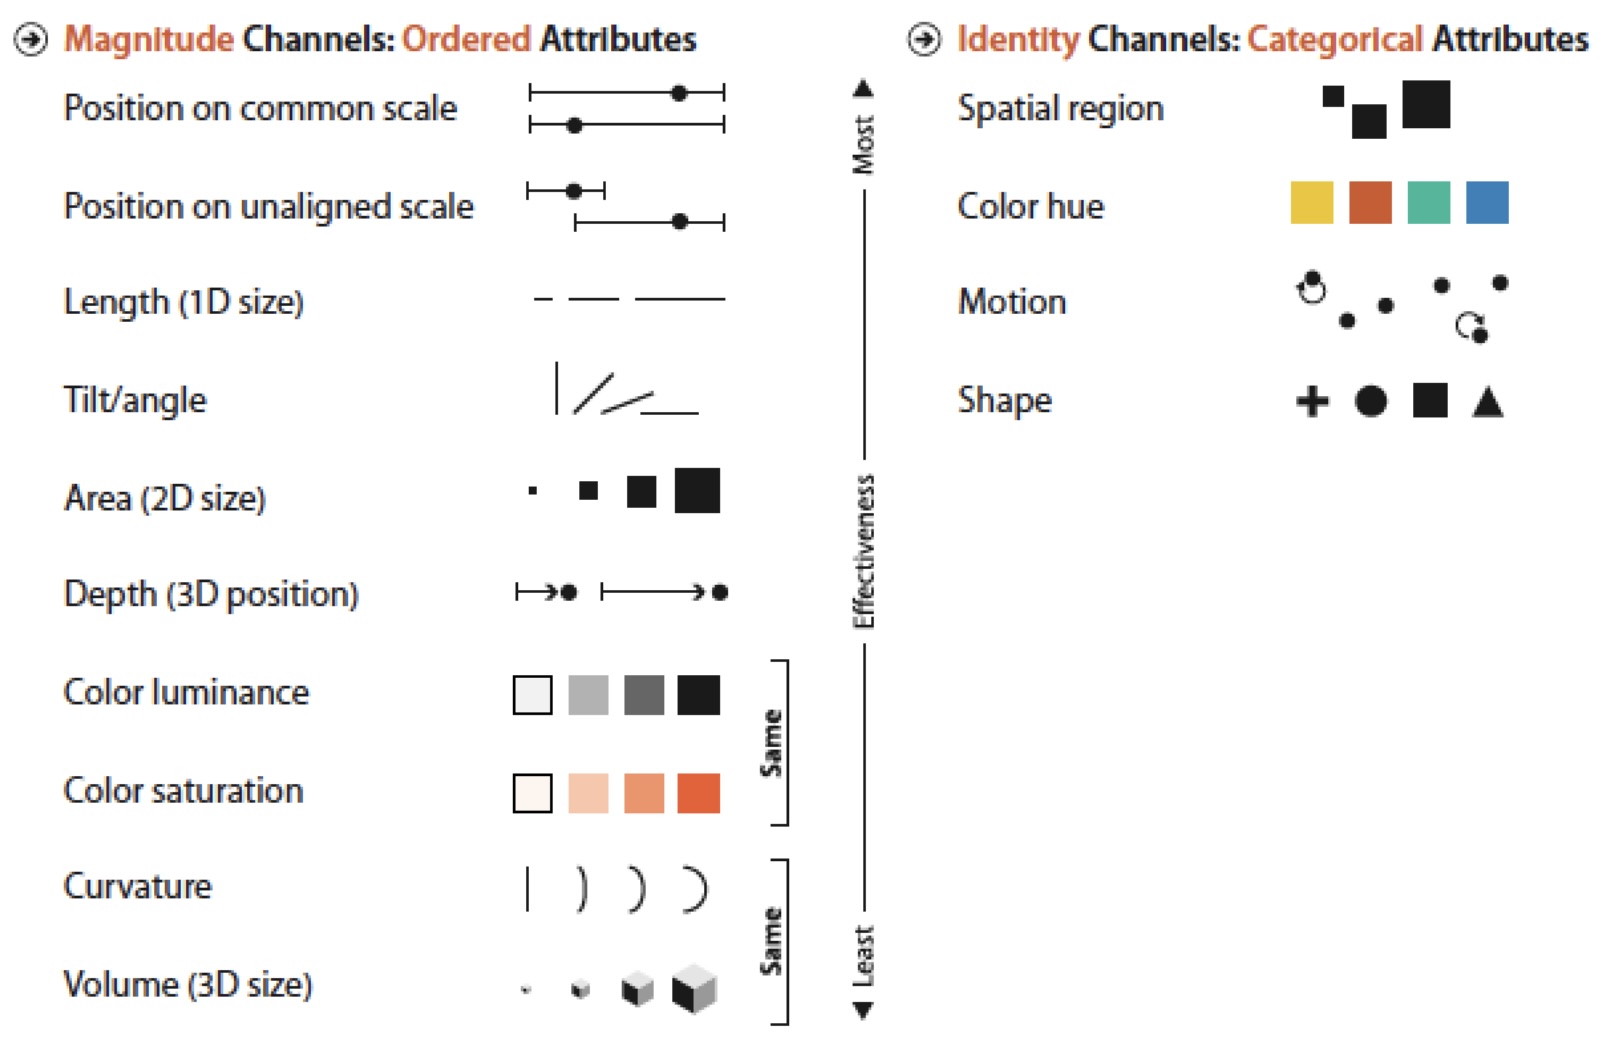{width="80%"} ## Accuracy Guidelines * **Prioritize high-rank channels** (with reason) * **Do not expect precise judgments** from low-rank channels * Position > Length > Angle > Area > Volume > Color **Application**: - Use position for most important comparisons - Use color for categorical distinctions - Avoid 3D for quantitative data ::: footer Slides based on material from Prof. Enrico Bertini ::: ## Relative vs. Absolute Judgments 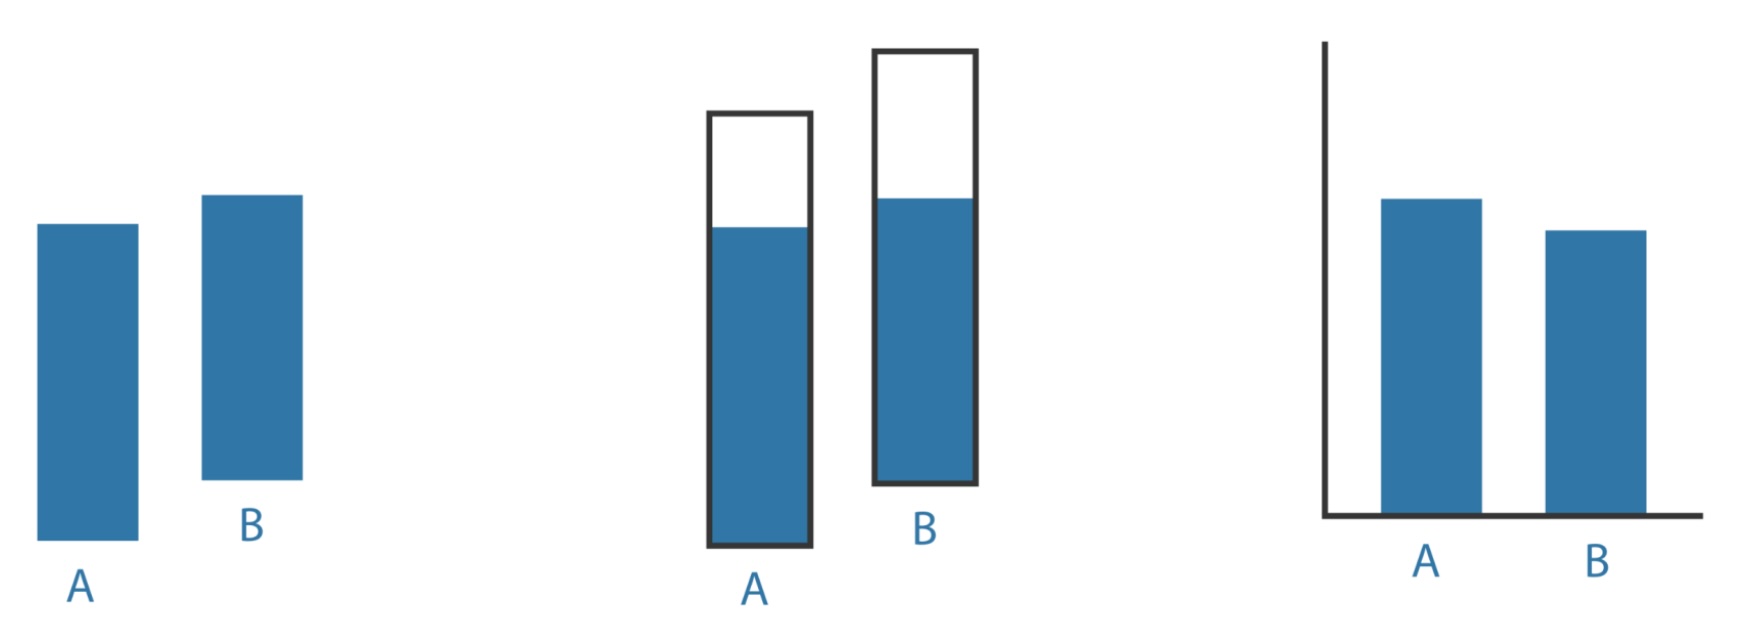{width="80%"} Humans are better at relative comparisons than absolute judgments ## Discriminability :::: {.columns} ::: {.column width="40%"} - **Discriminability**: How many values can be distinguished within a channel - It depends on: - Channel properties - Spatial arrangement - **Size** - Cardinality ::: ::: {.column width="60%"}   ::: :::: ## Discriminability :::: {.columns} ::: {.column width="40%"} - **Discriminability**: How many values can be distinguished within a channel - It depends on: - Channel properties - Spatial arrangement - Size - **Cardinality** ::: ::: {.column width="60%"}  ::: :::: ## Discriminability How many distinct values can be distinguished within a channel? Depends on: - Channel properties - Spatial arrangement - Size (resolution) - Cardinality **Practical limits**: - Line width: ~3 levels - Color hues: 5-6 maximum - Symbol shapes: 5-6 maximum ::: footer Material from [STAT4580](https://homepage.divms.uiowa.edu/~luke/classes/STAT4580/percep.html#discriminability) ::: ## Discriminability Guidelines - Do not overestimate the number of values viewers can perceive or discriminate.  ## Strategies to overcome this problem - How do we solve the problem of encoding a categorial attribute with high cardinality? - Grouping - Filtering - Faceting ## Grouping Semantically grouping elements can help reduce the number of distinct classes you need to distinguish  ## Filtering Selecting important classes to answer your data question reduces the cardinality problem 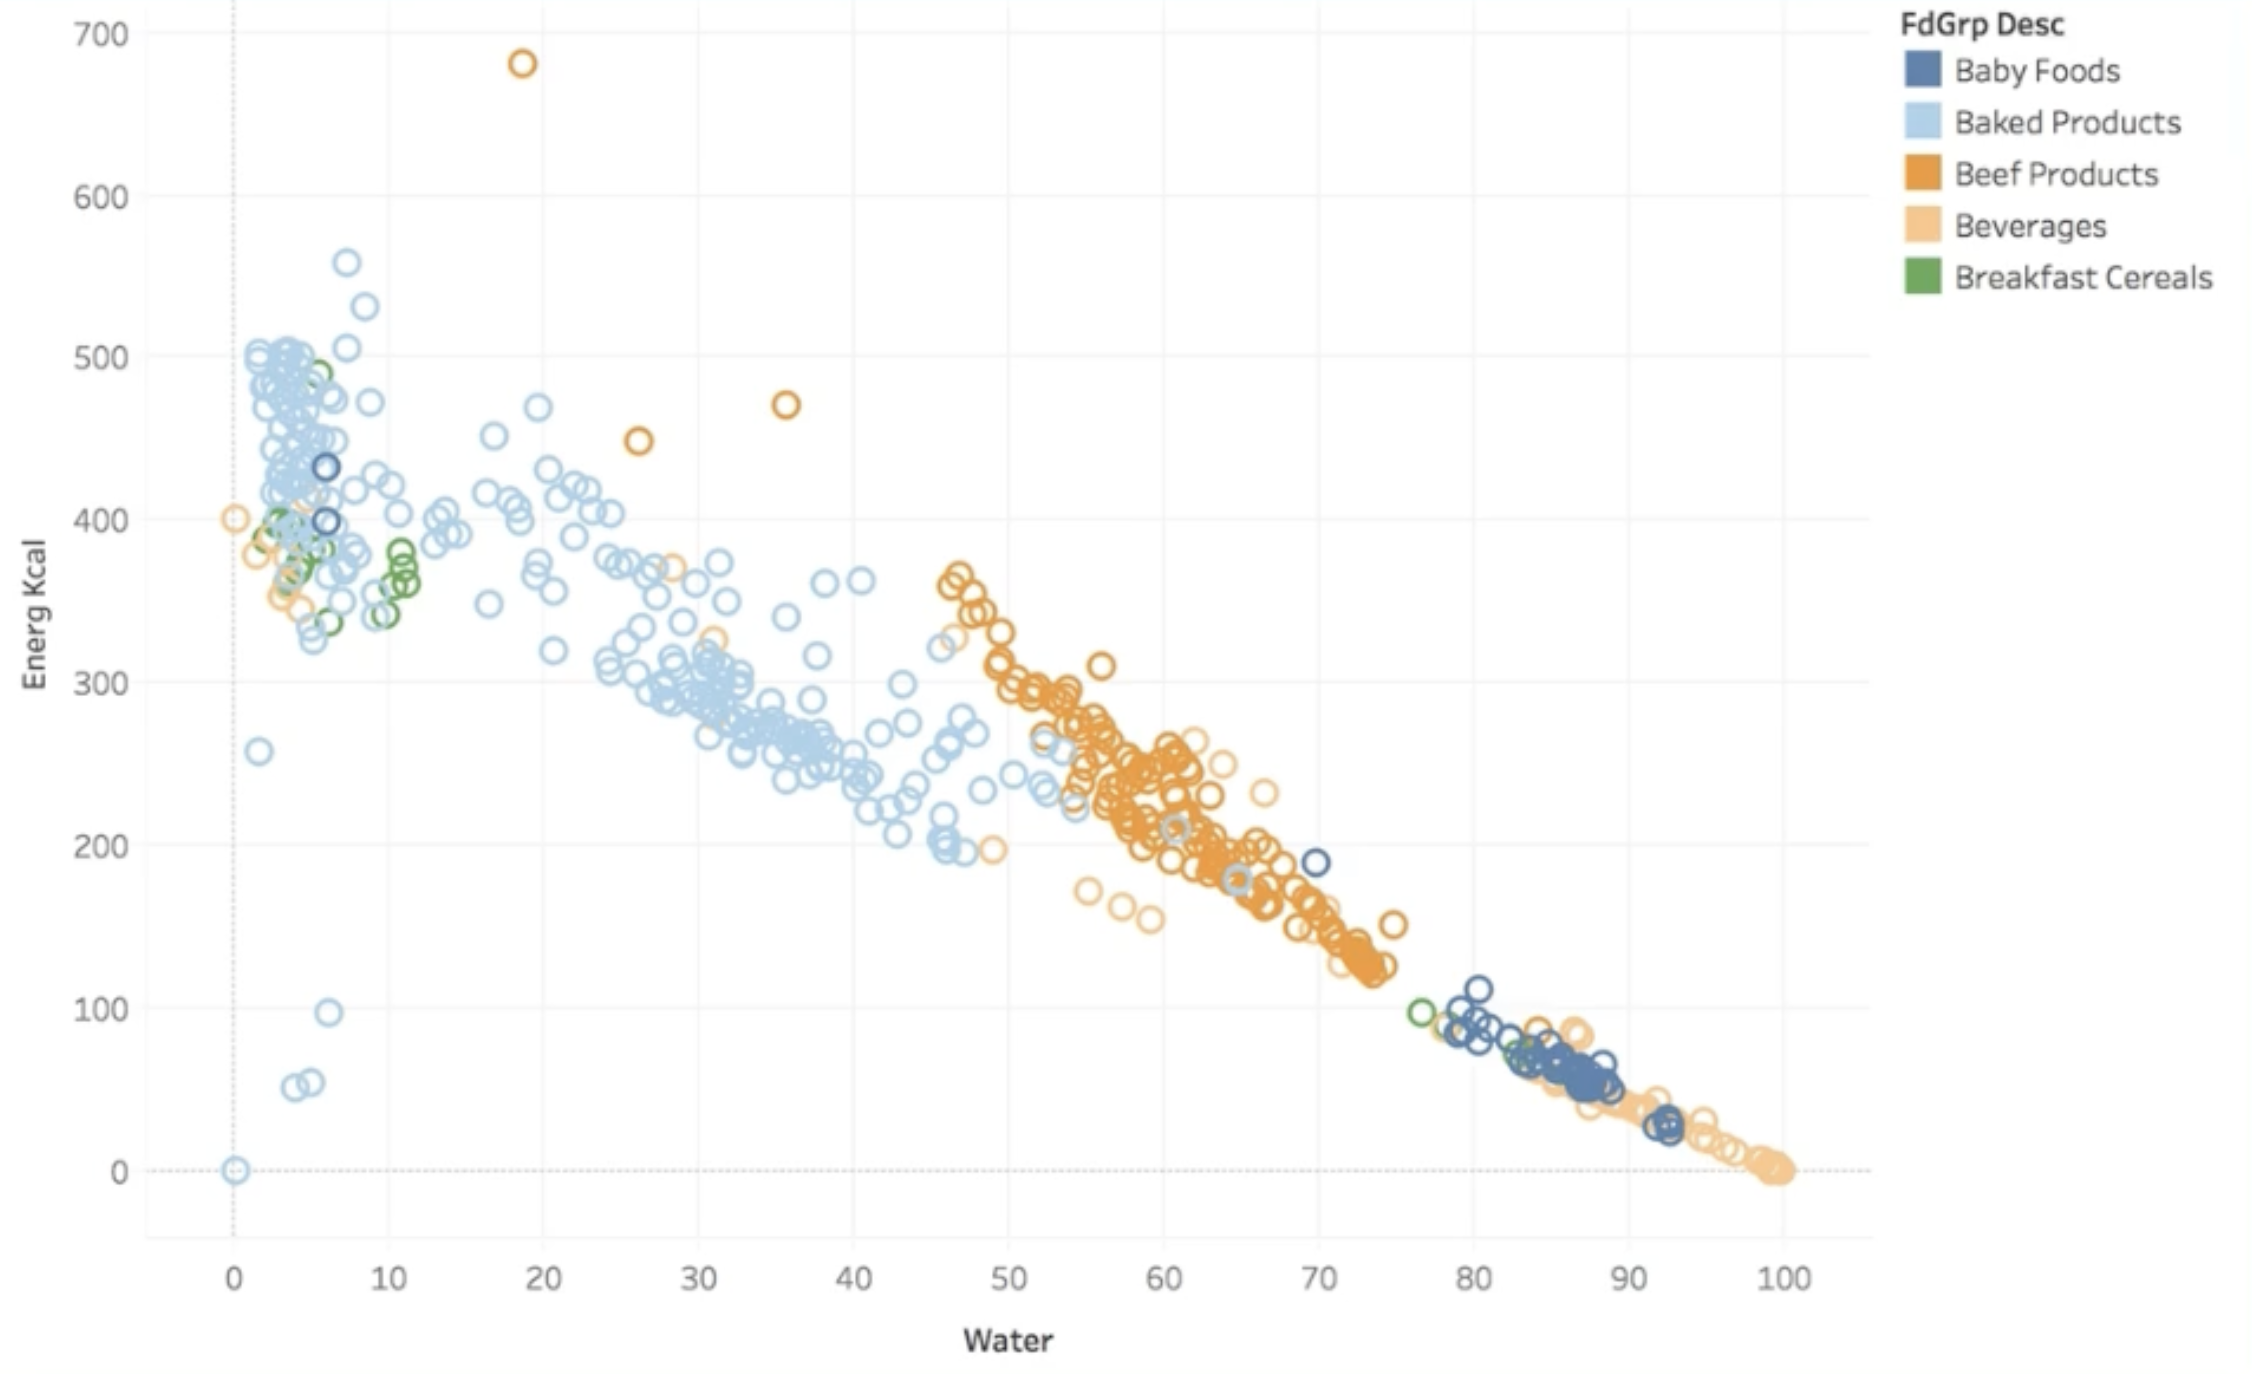 ## Faceting Encoding the categorical value in the position channel 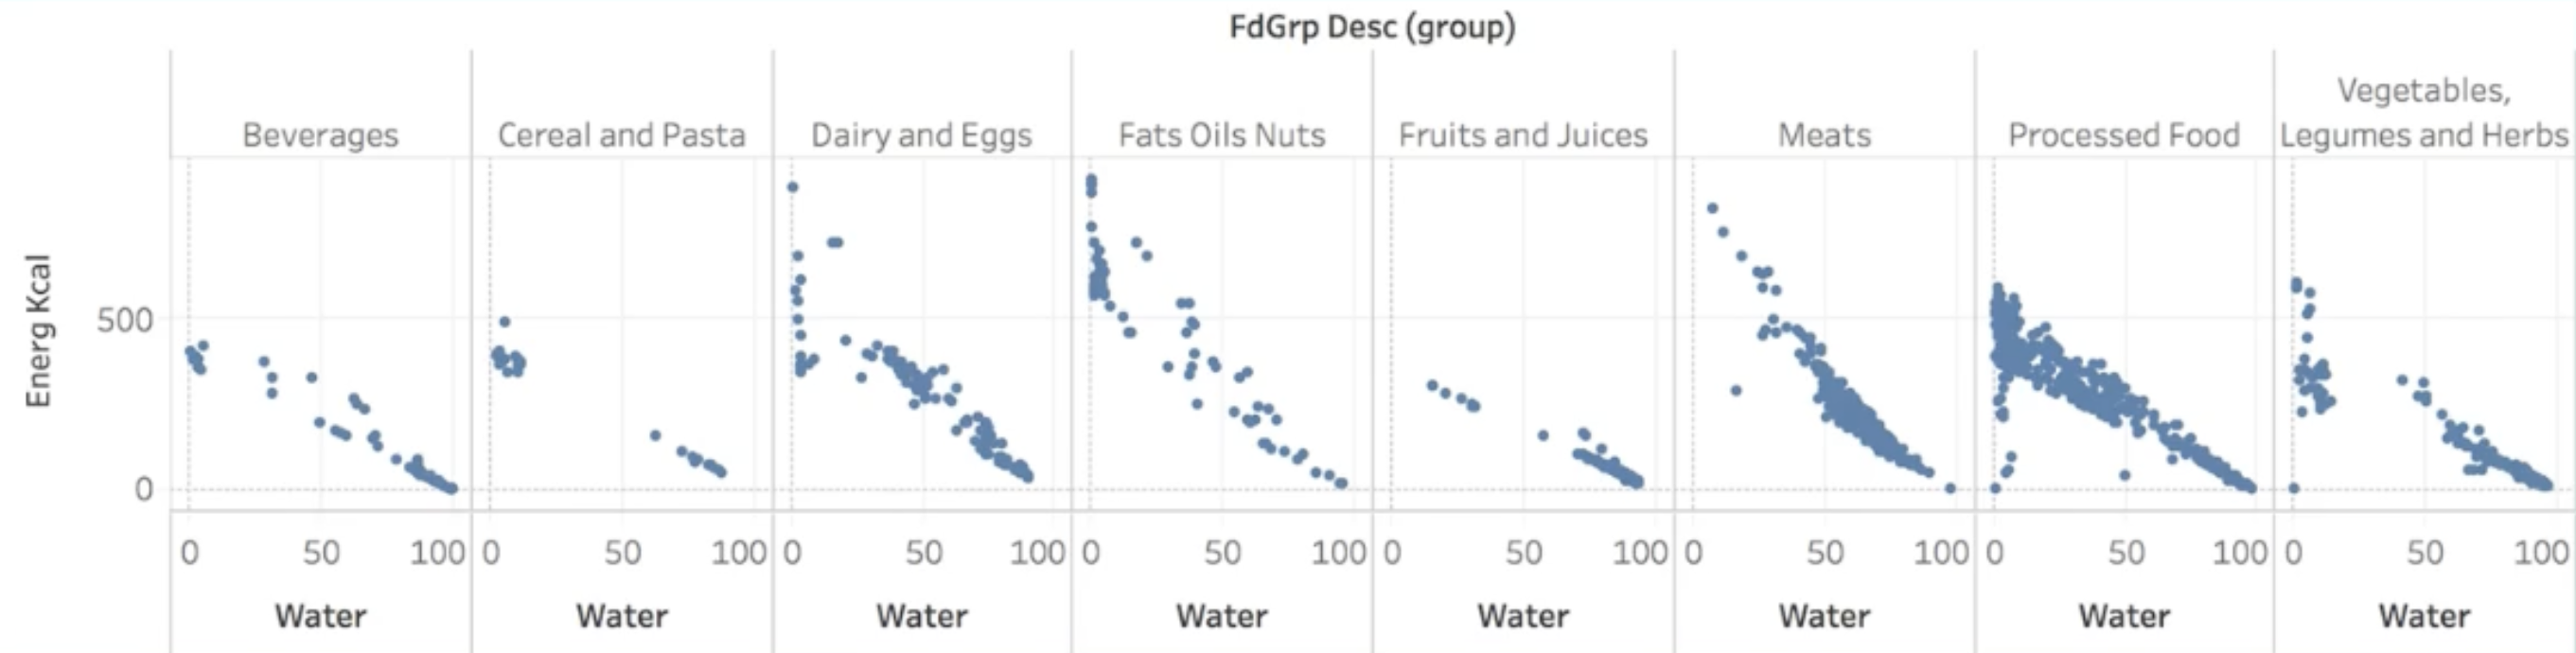 ## Pre-attentive Processing: Popout Anne Treisman studied how to find patterns when surrounded by distractors :::: {.columns} ::: {.column width="50%"} 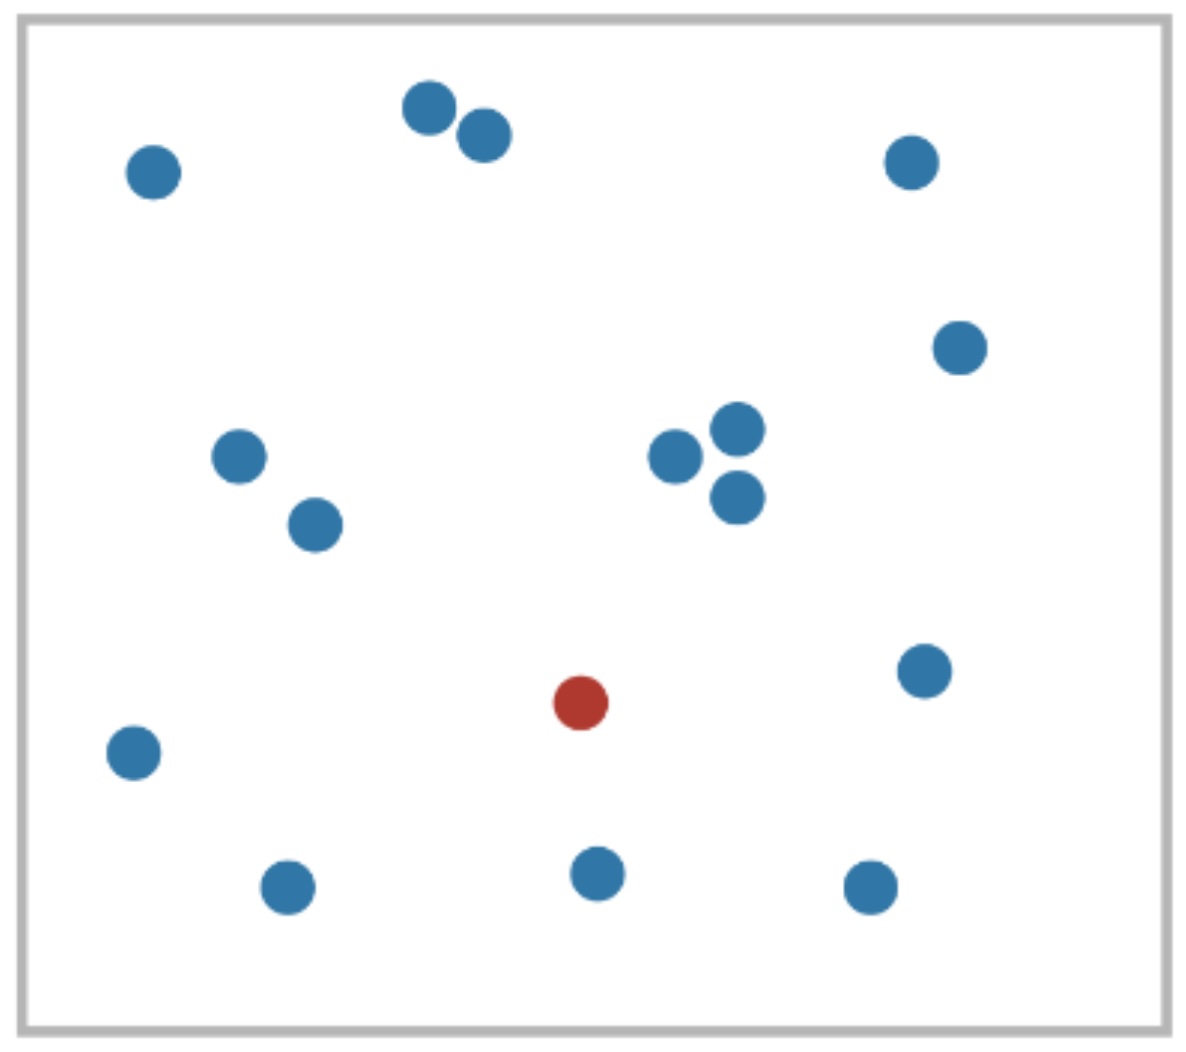 ::: ::: {.column width="50%"} 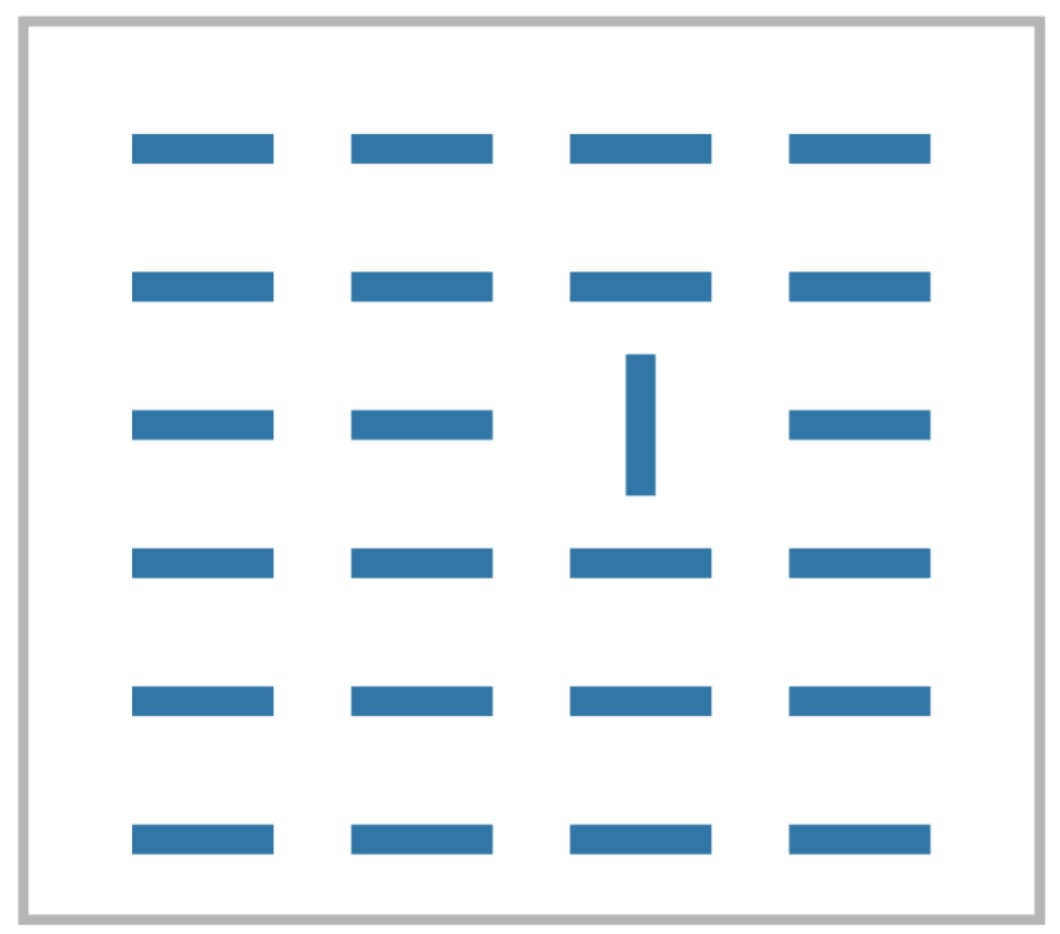 ::: :::: For some configurations, search time does *not* depend on number of distractors ::: footer Material from Colin Ware's book ::: ## Pre-attentive Processing: Popout 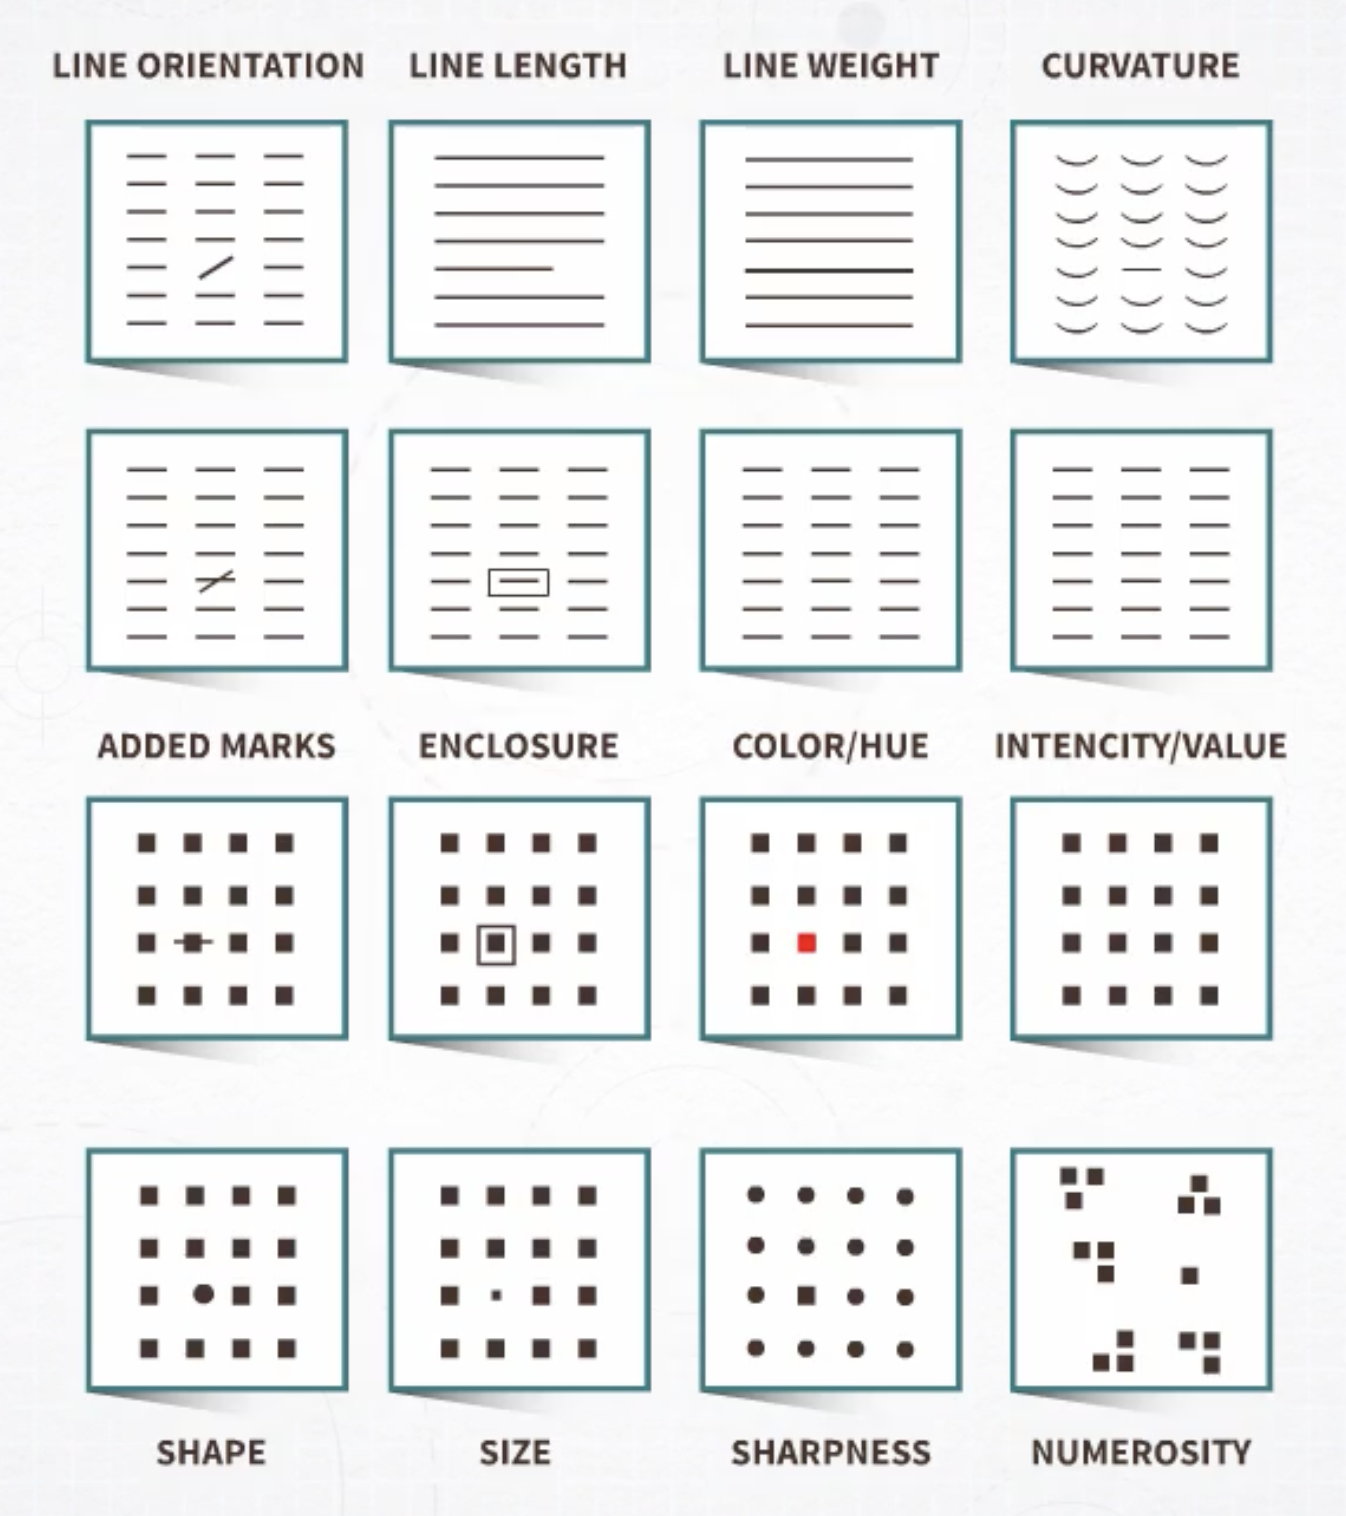 - Enrico's video experiment ::: footer Material from Enrico Bertini ::: ## Pre-attentive vs. Attentive 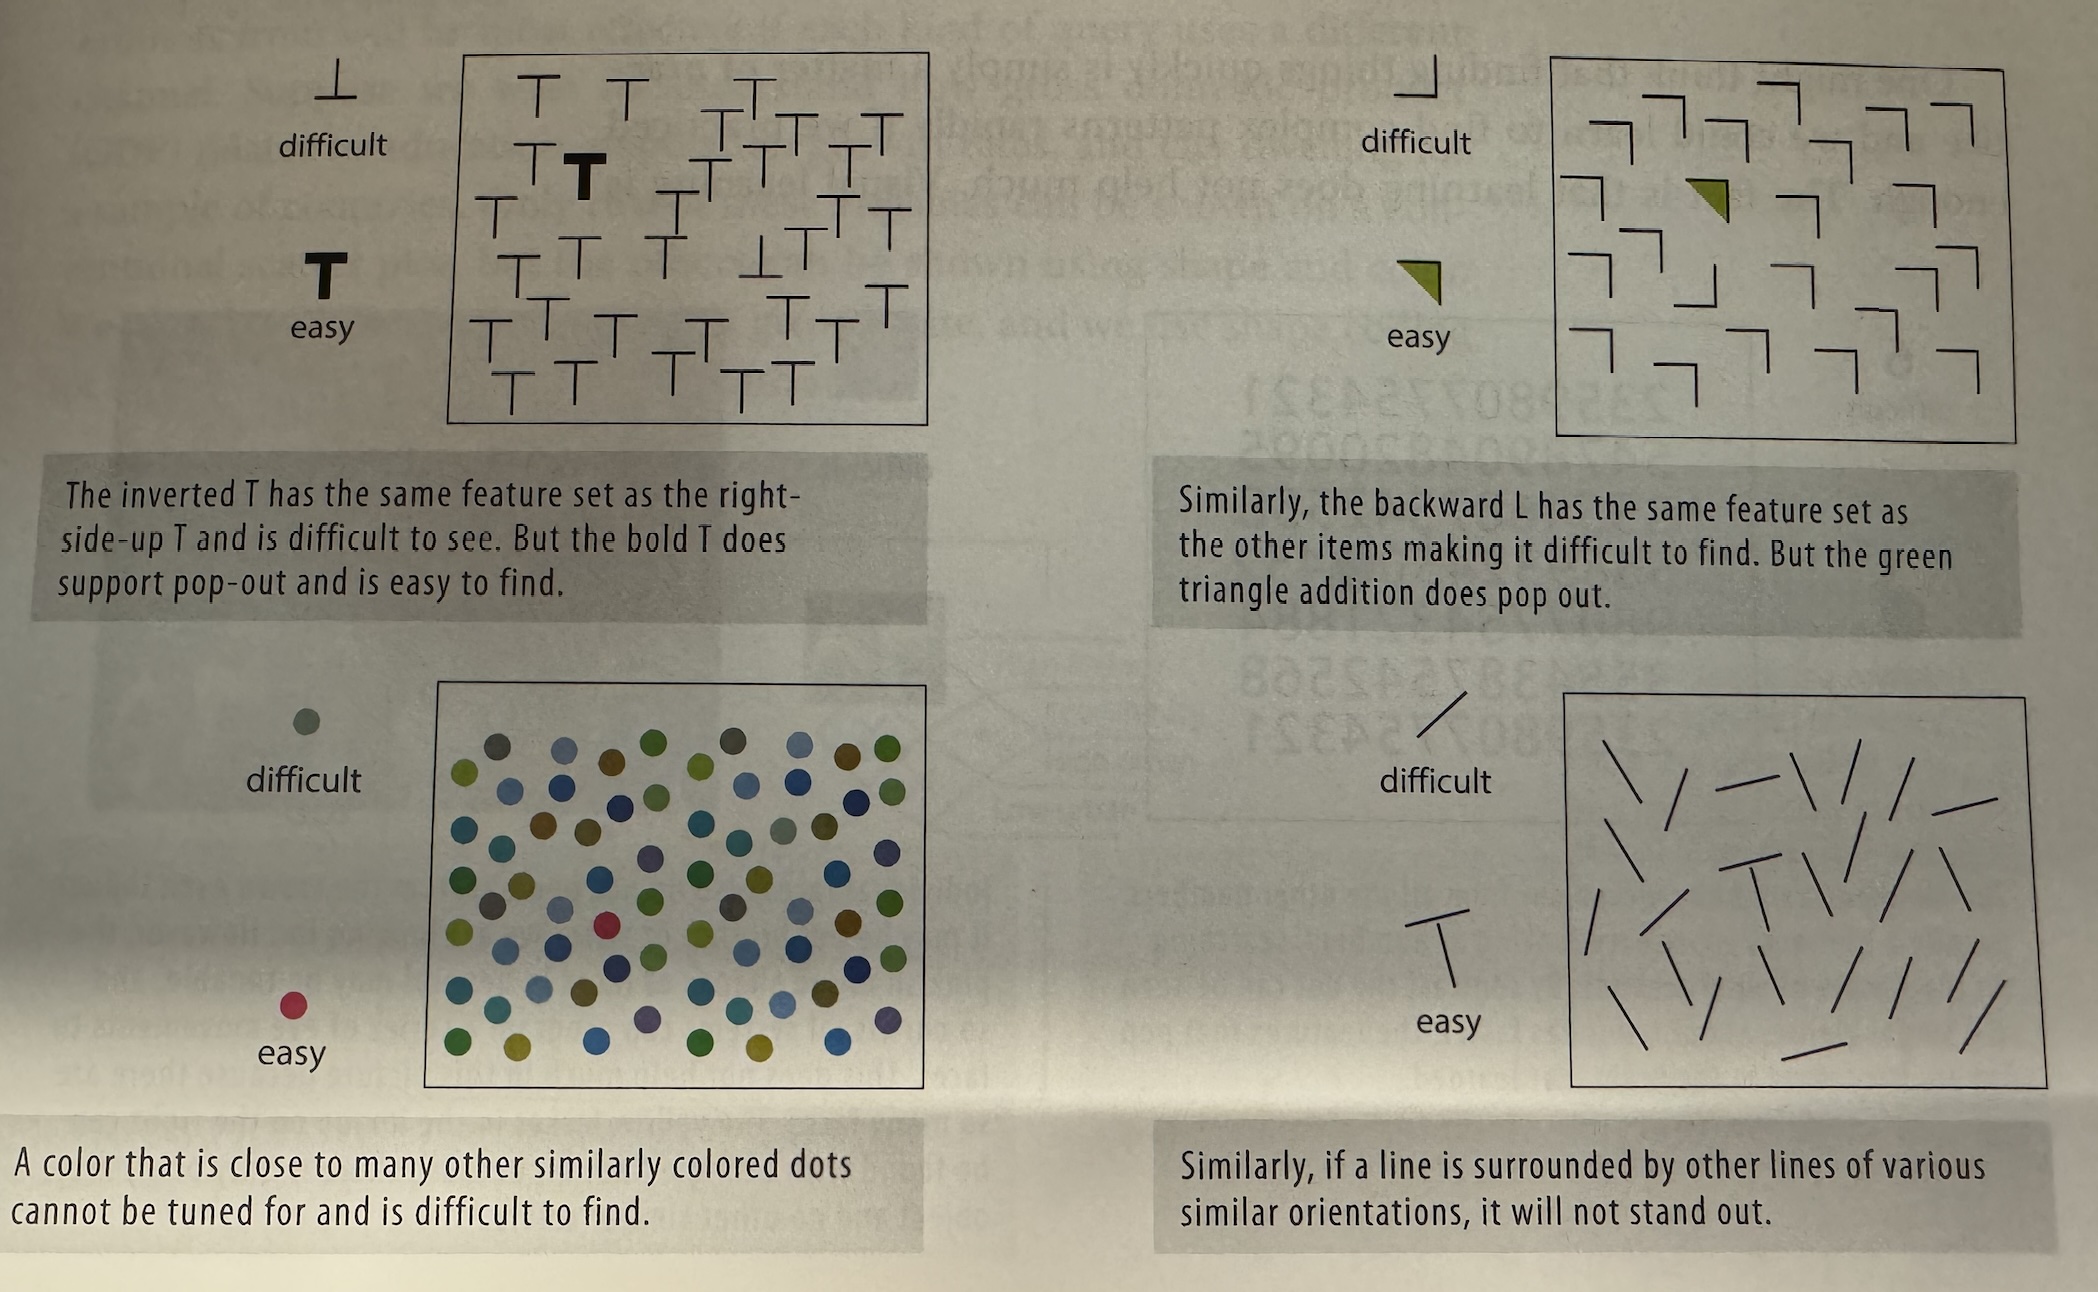{width="80%"} ::: footer Material from Colin Ware's book ::: ## Attentive 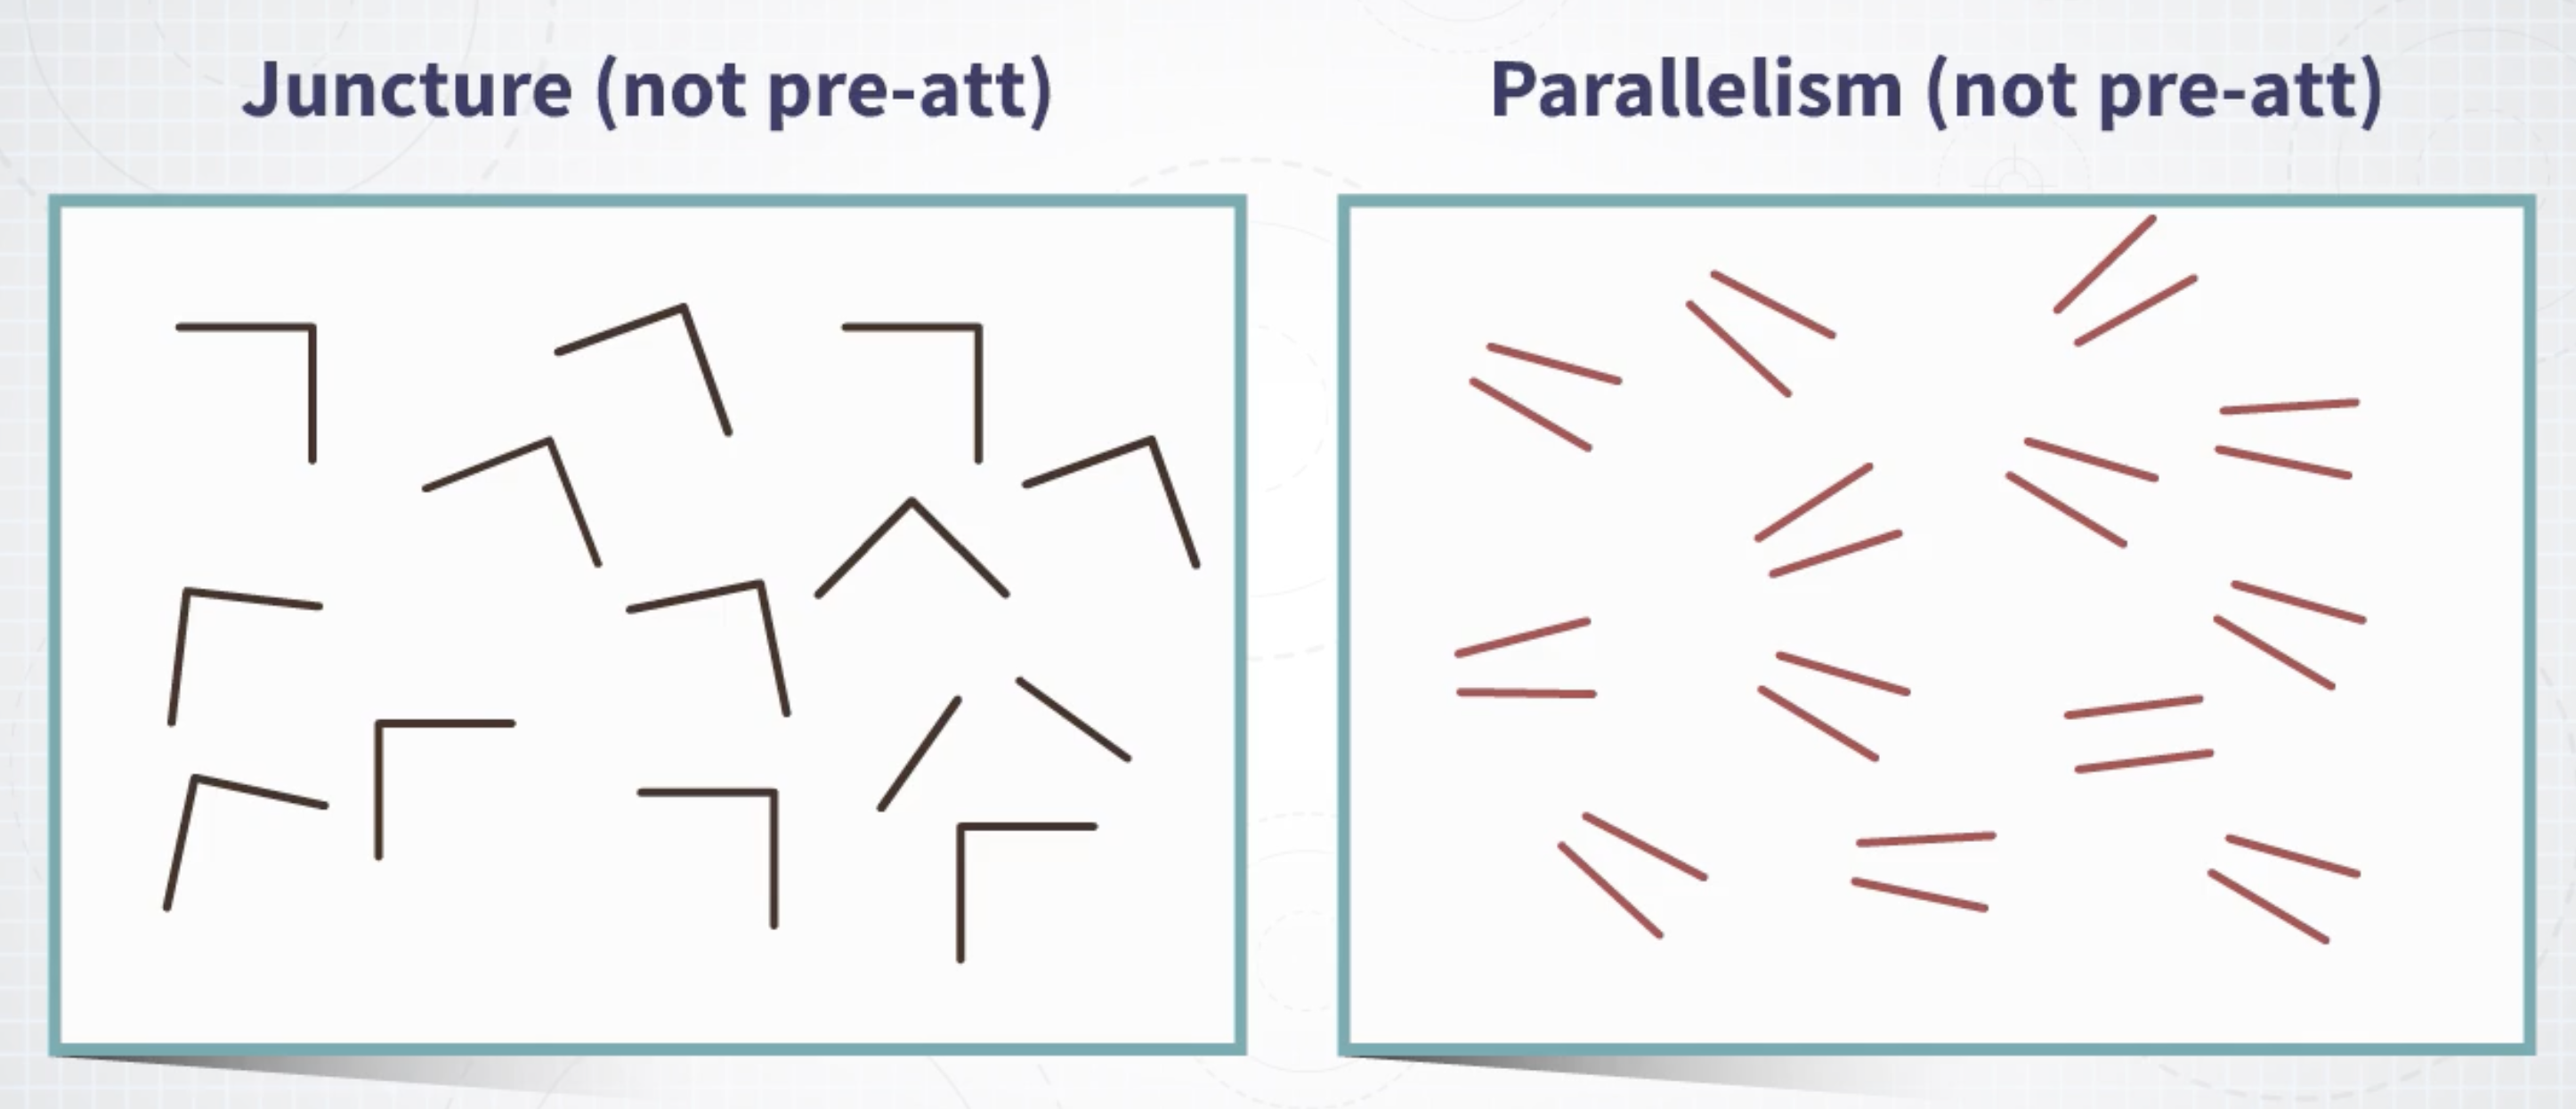{width="80%"} ::: footer Material from Enrico Bertini ::: ## Serial search 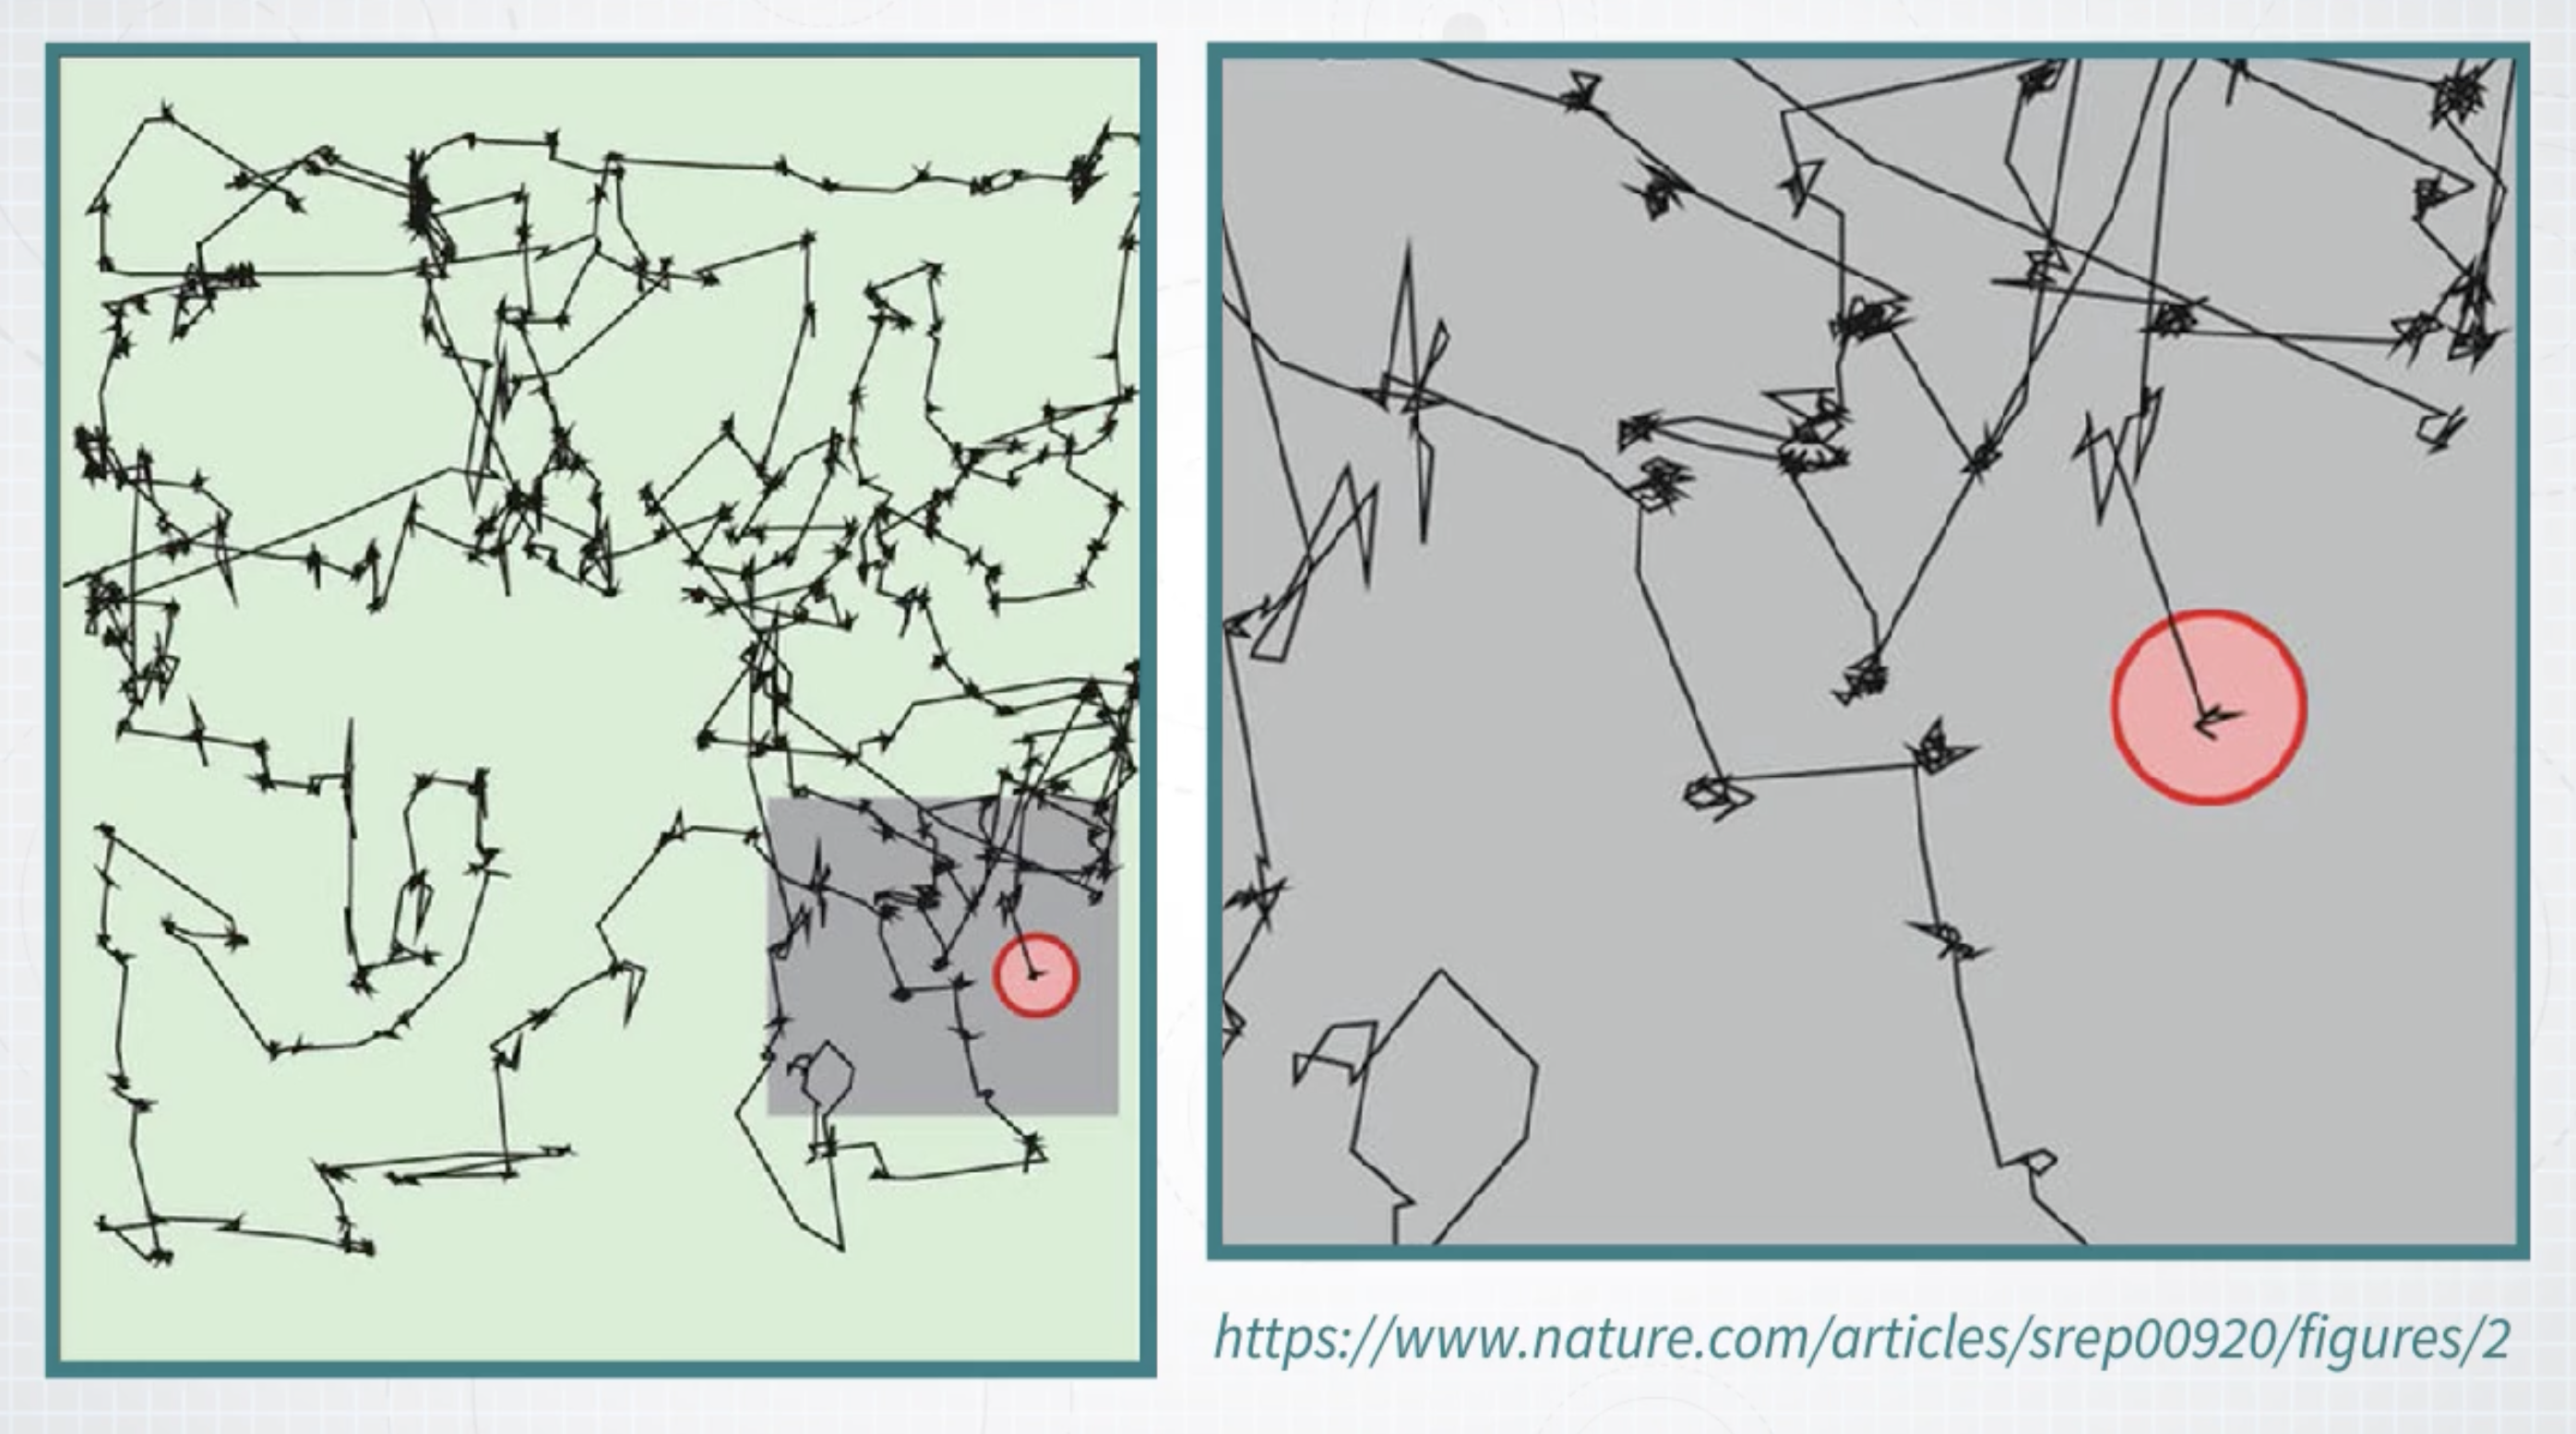{width="80%"} ::: footer Material from Enrico Bertini ::: ## Multiple Channels Usually Not Pre-attentive 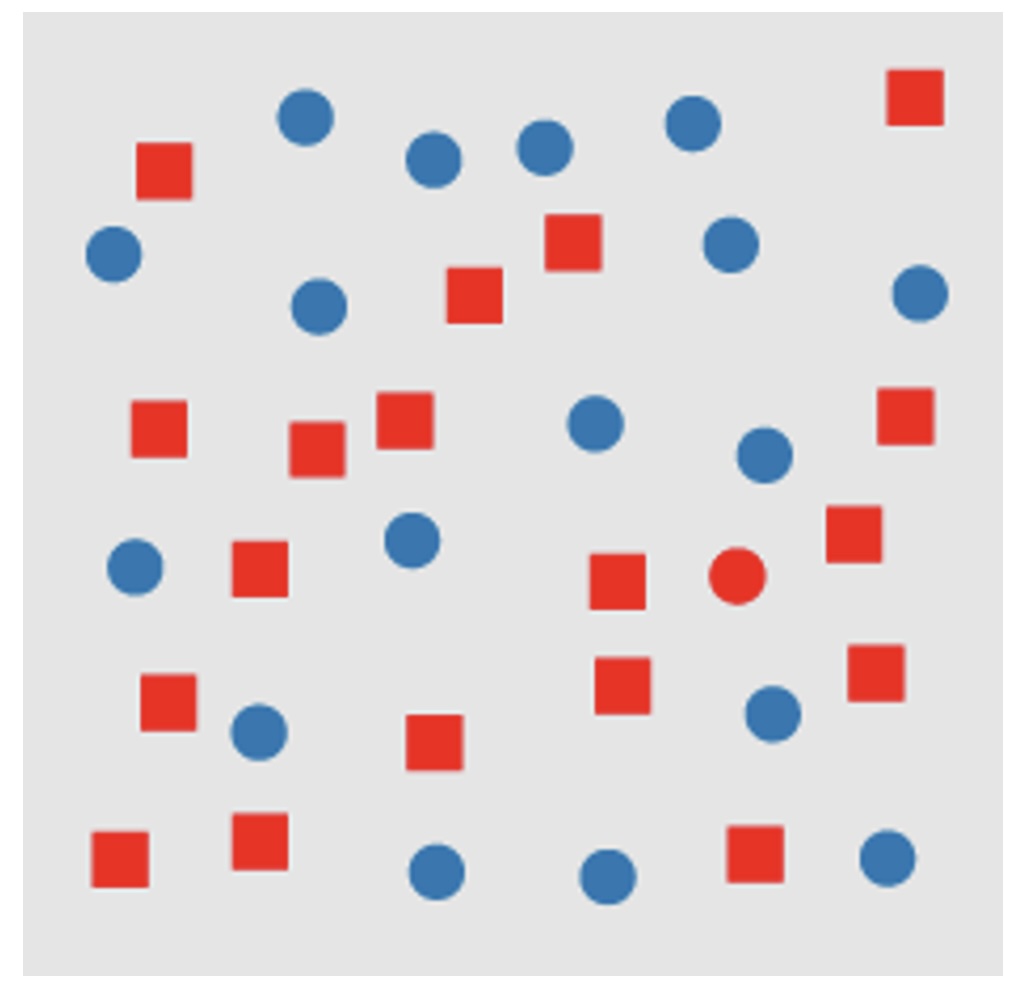{width="70%"} Combining color AND shape requires attentive processing ::: footer Slides based on material from Prof. Enrico Bertini ::: ## Application to visualization design 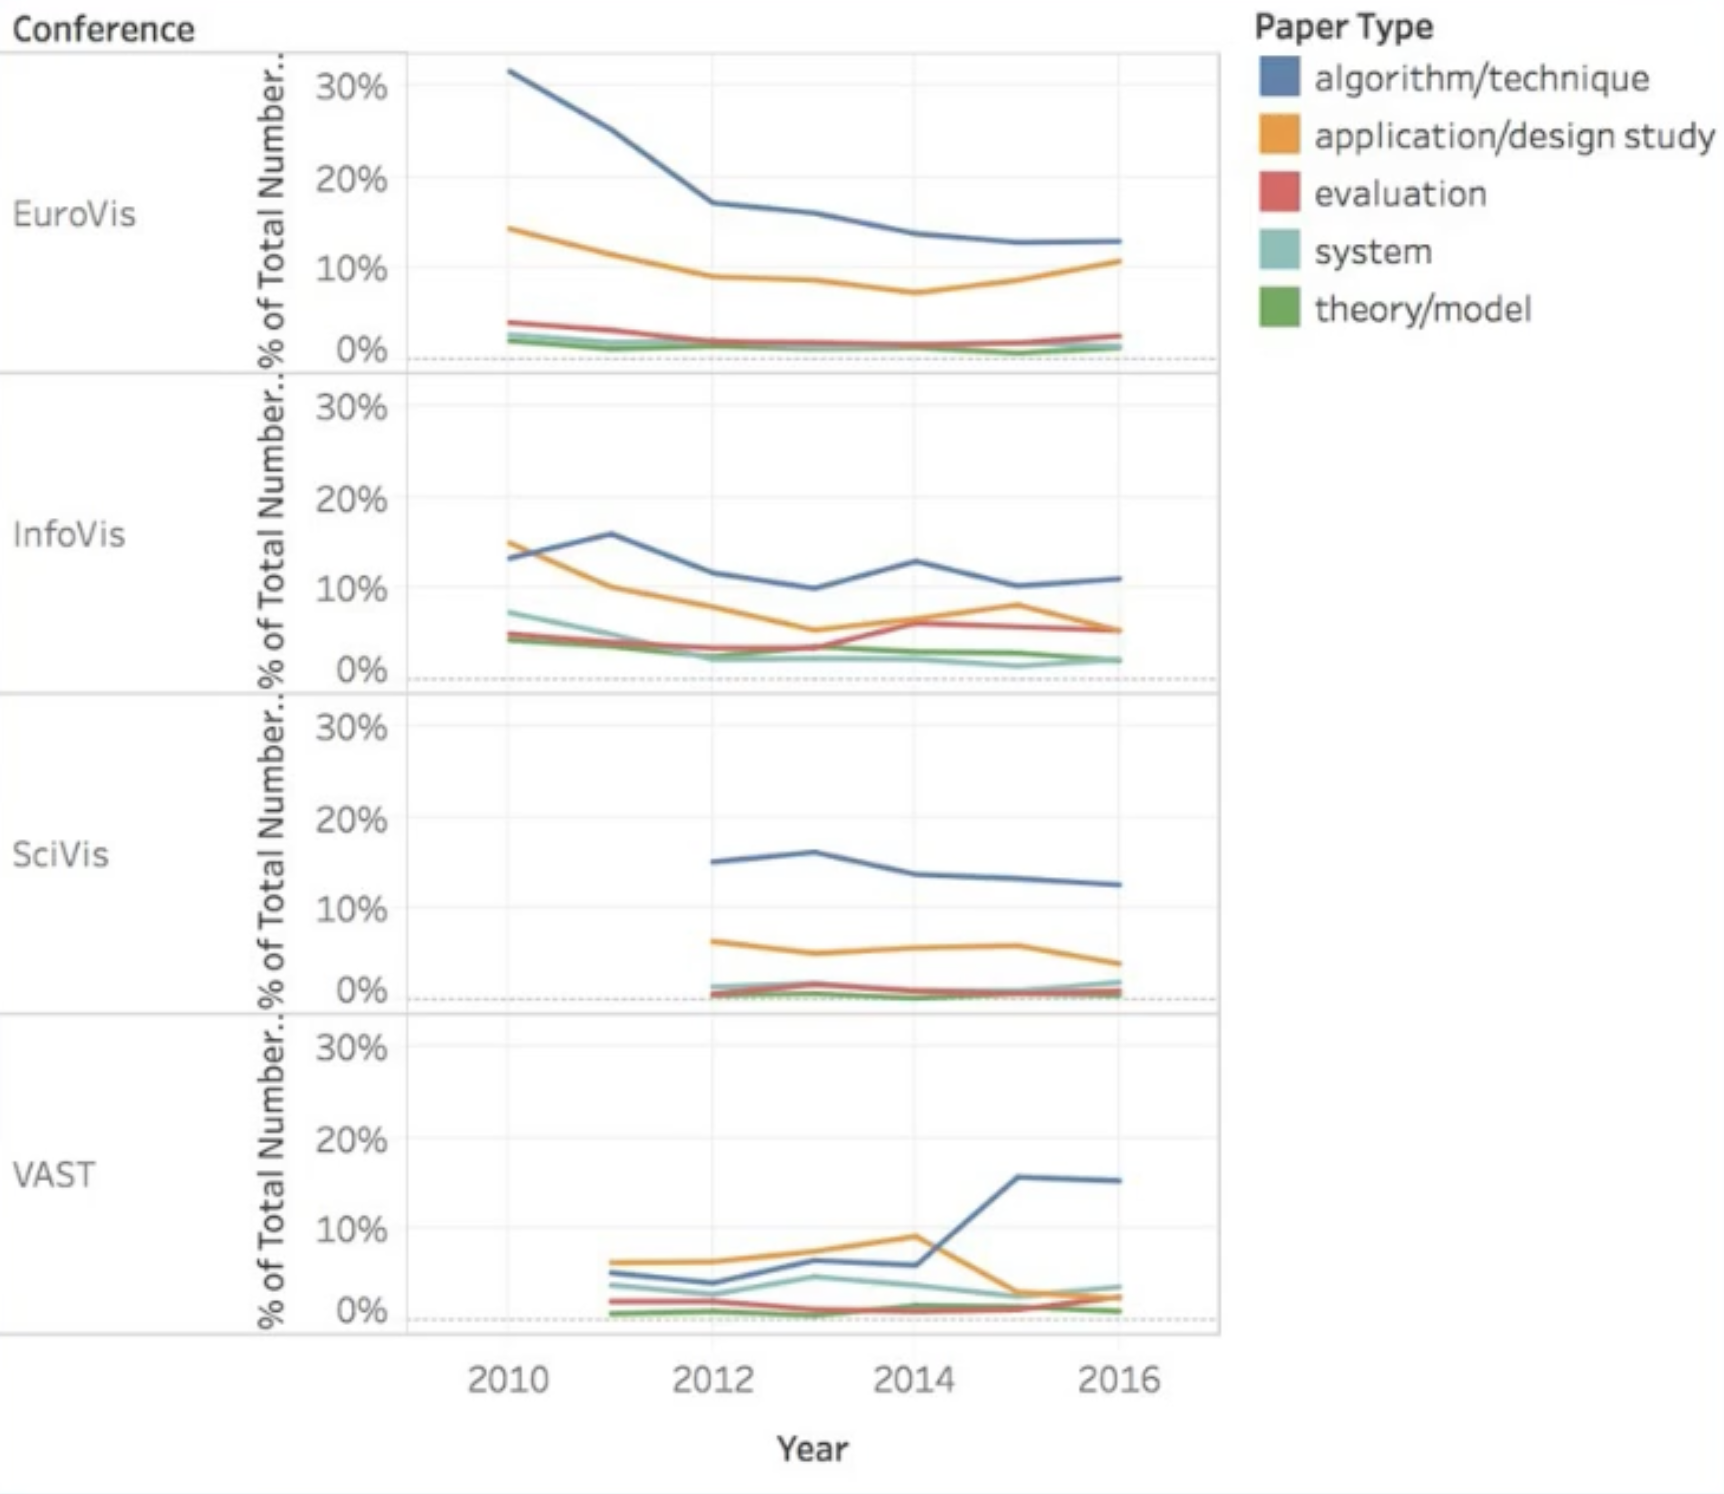{width="80%"} ## Application to visualization design 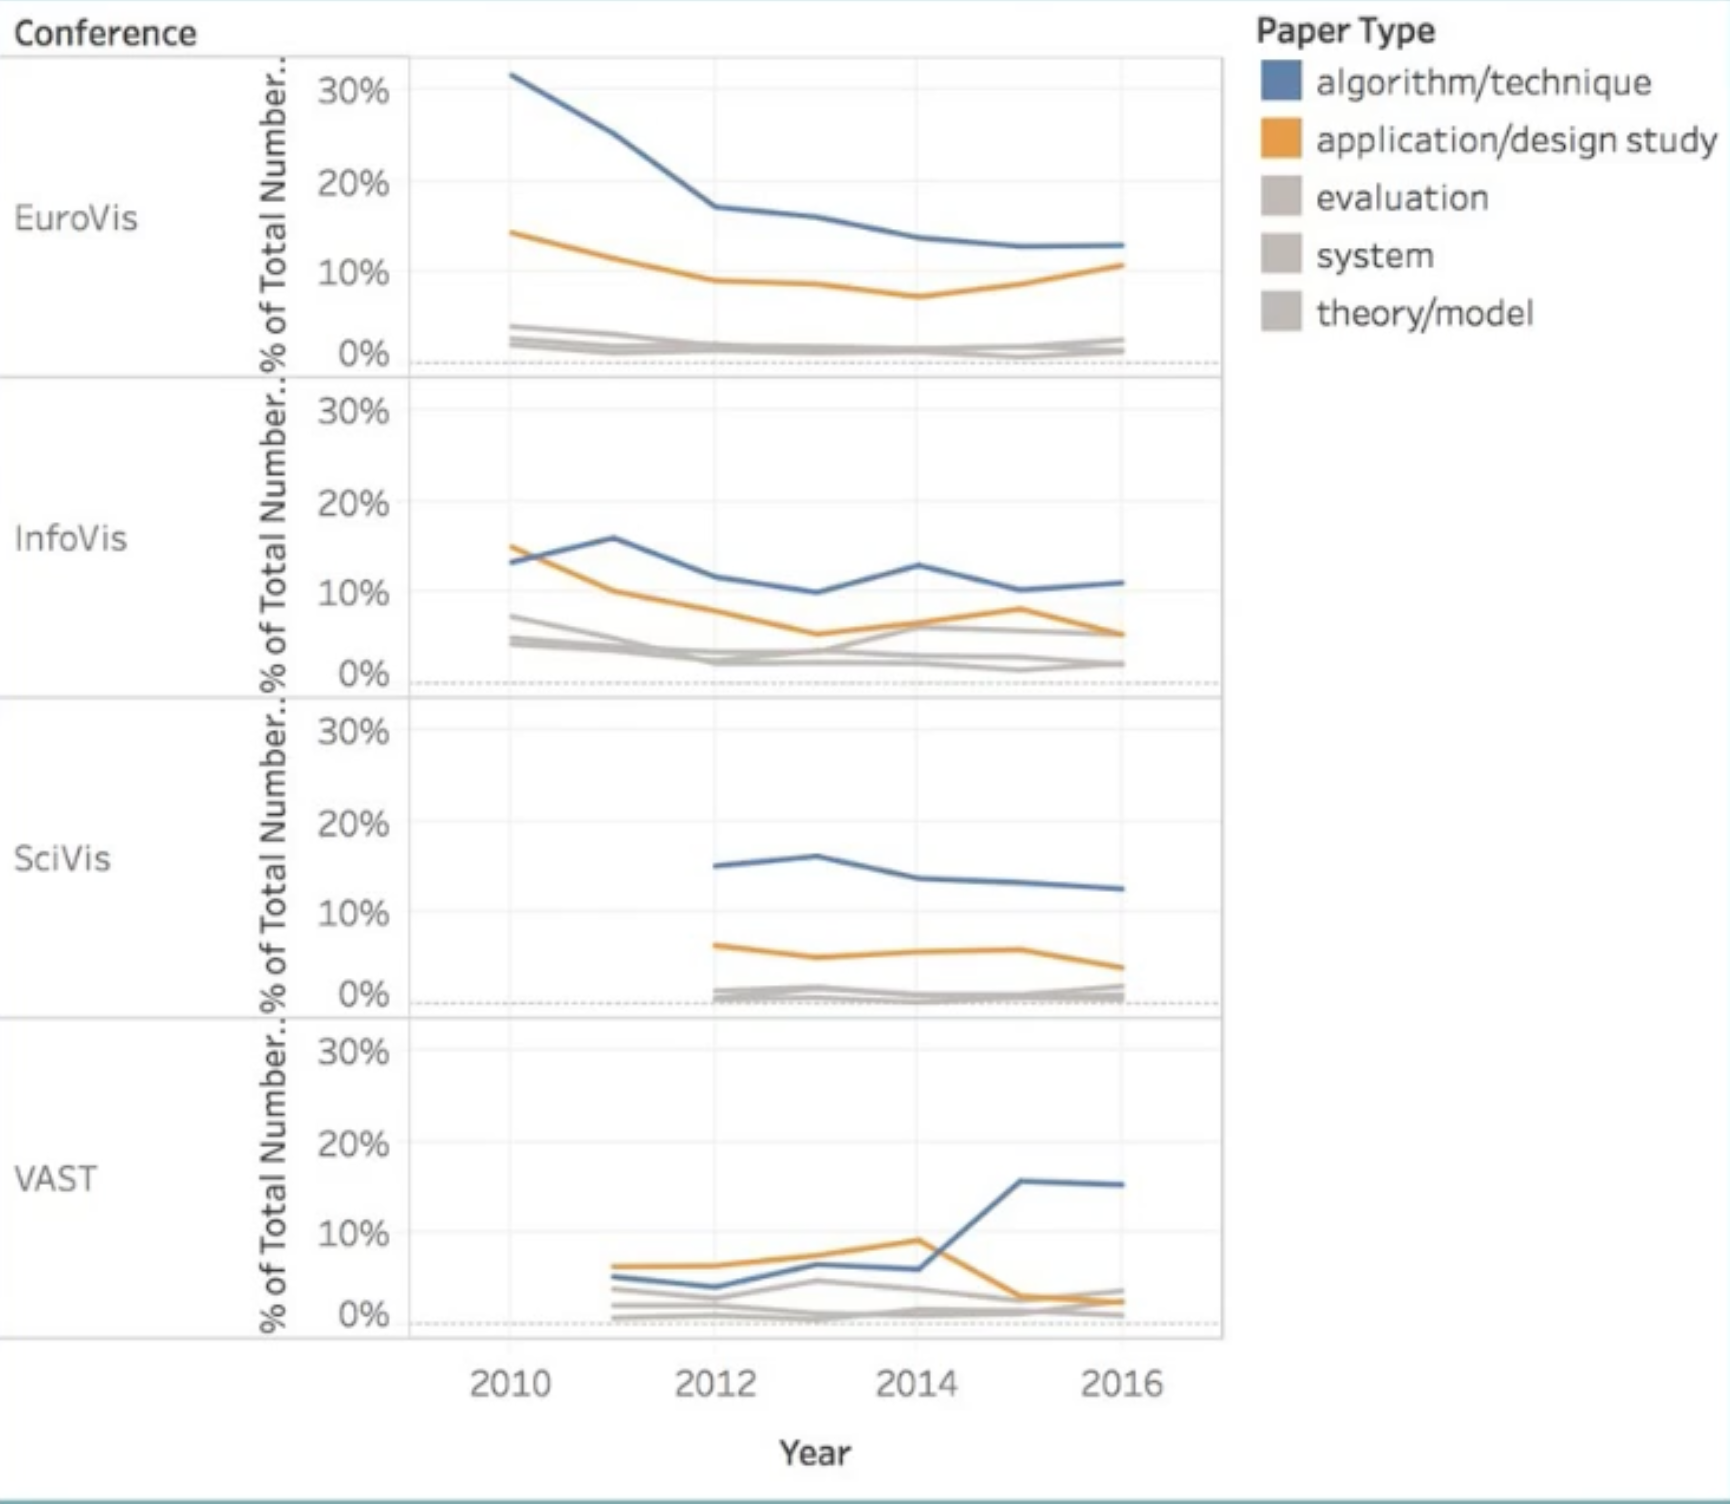{width="80%"} ## Pre-attentive Processing * Tasks performed in less than 200-250 milliseconds * Faster than eye movement initiation * Suggests processing by parallel low-level visual system {width="50%"} ::: footer Slides based on material from Prof. Enrico Bertini ::: ## Grouping: The Gestalt Principles [Interactive demo](https://www.interaction-design.org/literature/topics/gestalt-principles) * Visualization is a two-way street: - We (the vis designer) bring something to the table - The human (end user) brings their prior experience * Design should take prior experience into account * What is prior experience? **Gestalt laws** ::: footer Material from Matt Berger ::: ## Gestalt: Closure We can complete incomplete shapes {width="50%"} **Implications**: - Visualizations can be unintentionally misleading - Sometimes only necessary to show sparse marks to convey trend ::: footer Material from Matt Berger ::: ## Gestalt: Similarity Elements with the same visual properties are perceived as grouped :::: {.columns} ::: {.column width="50%"} 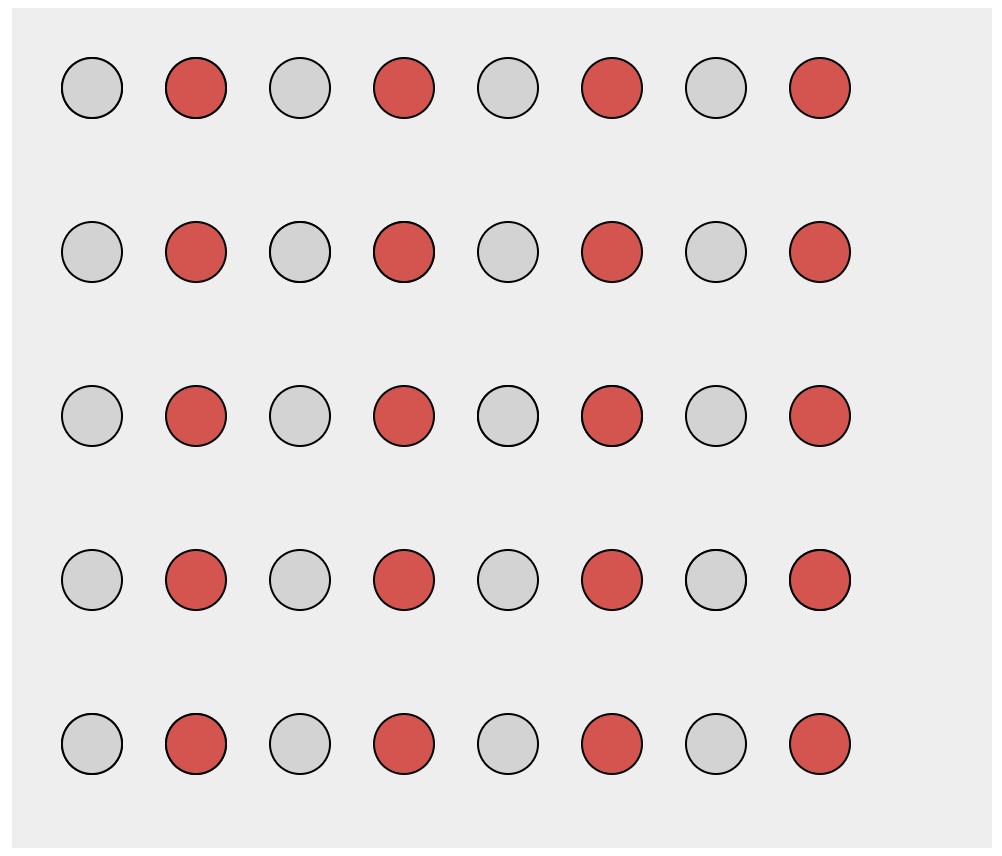 ::: ::: {.column width="50%"} 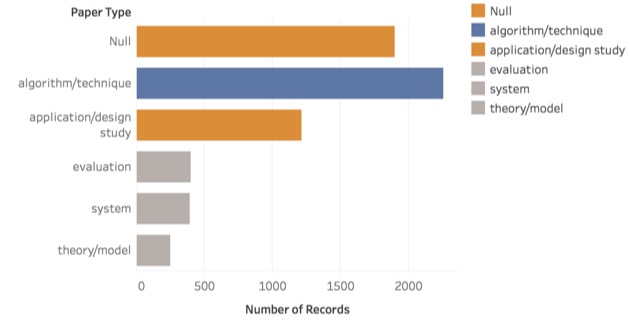 ::: :::: ::: footer Material from Matt Berger and Enrico Bertini ::: ## Gestalt: Proximity Elements that are spatially close are perceived as grouped :::: {.columns} ::: {.column width="50%"} 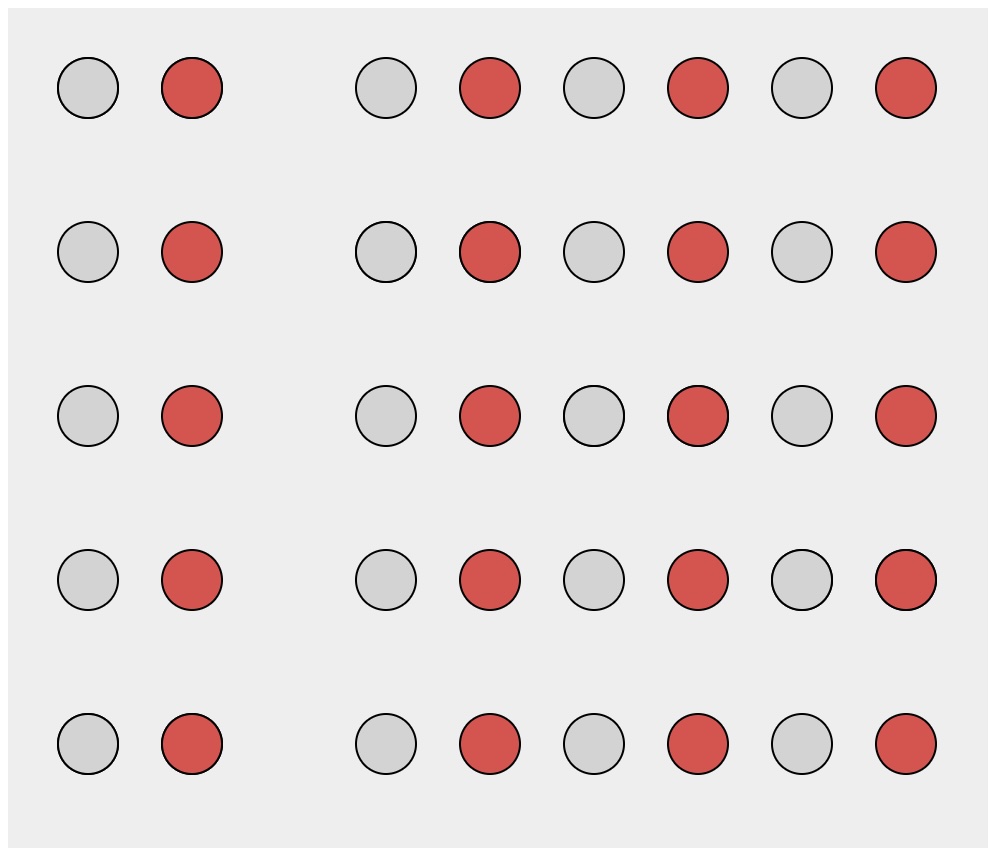 ::: ::: {.column width="50%"} 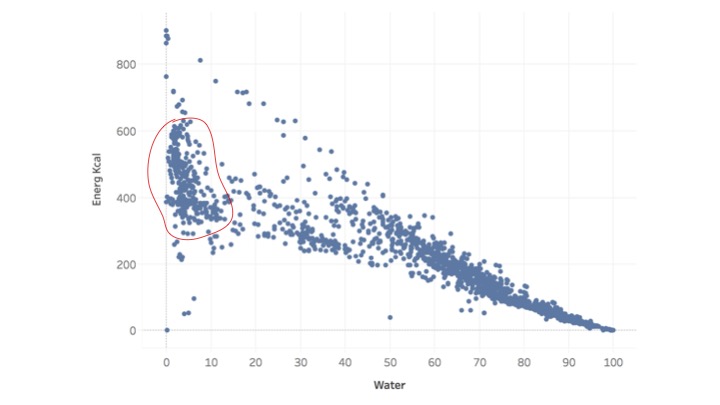 ::: :::: ::: footer Material from Matt Berger and Enrico Bertini ::: ## Gestalt: Enclosure Explicit visual encoding of enclosure depicts grouping :::: {.columns} ::: {.column width="50%"} 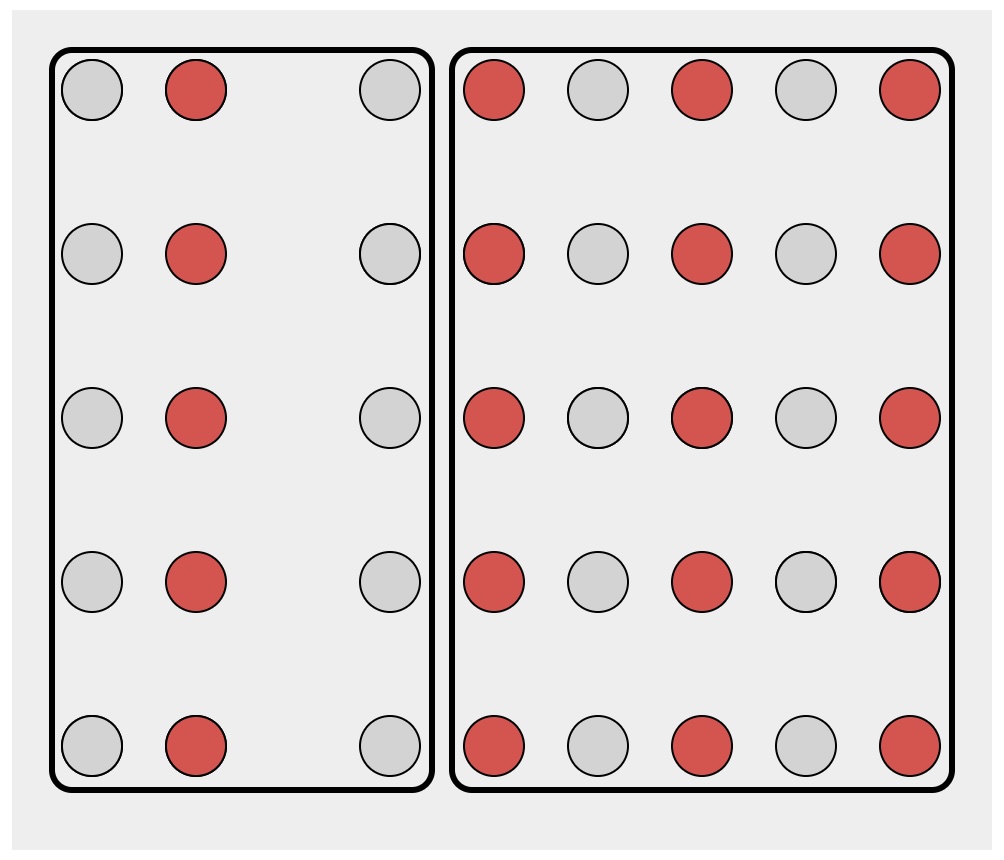 ::: ::: {.column width="50%"} 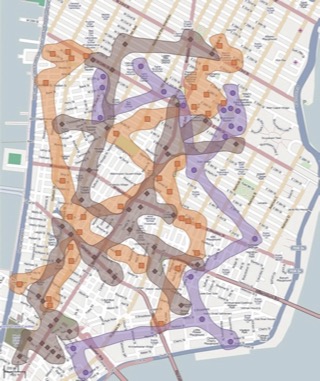 [Bubblesets video](https://www.youtube.com/watch?v=P6CgBmIiXaE) ::: :::: ::: footer Material from Matt Berger and Enrico Bertini ::: ## Gestalt: Connection Objects connected together are perceived as a group :::: {.columns} ::: {.column width="50%"} 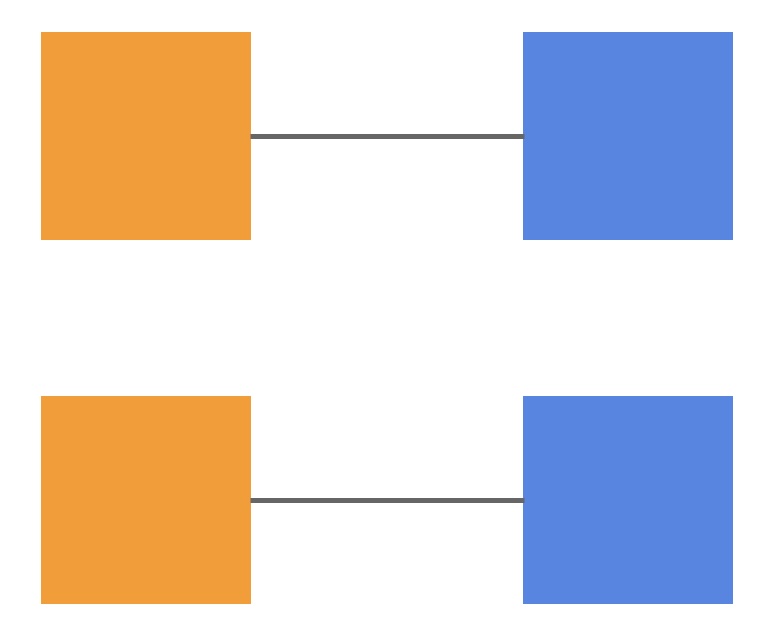 ::: ::: {.column width="50%"} 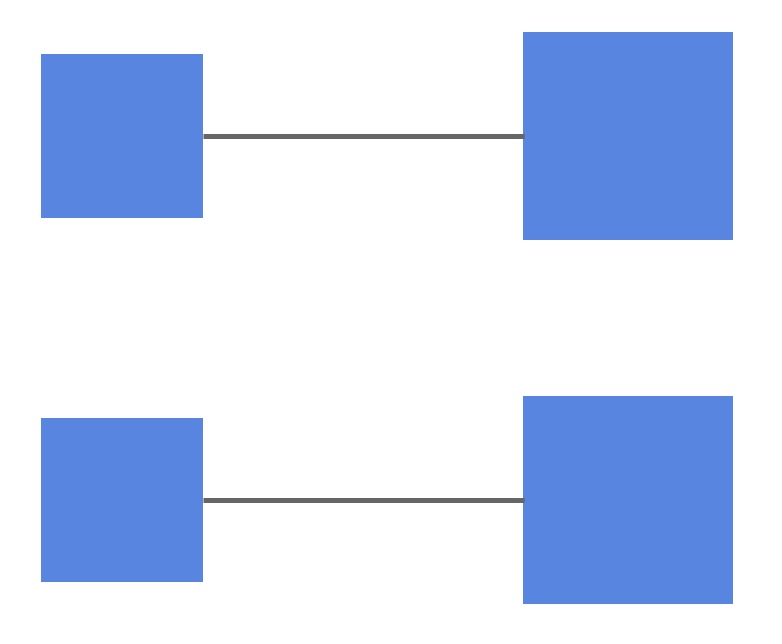 ::: :::: ::: footer Material from Enrico Bertini ::: ## Connection Examples :::: {.columns} ::: {.column width="50%"} 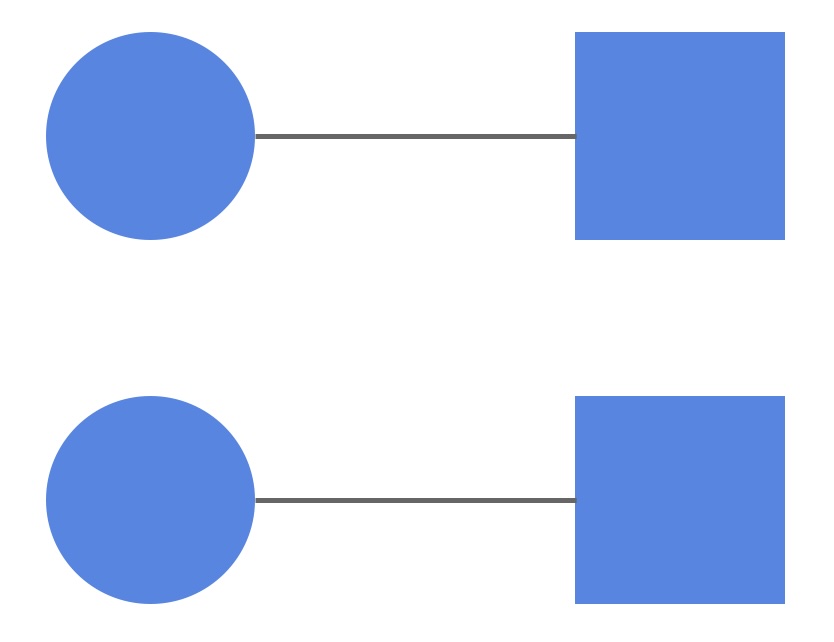 ::: ::: {.column width="50%"} 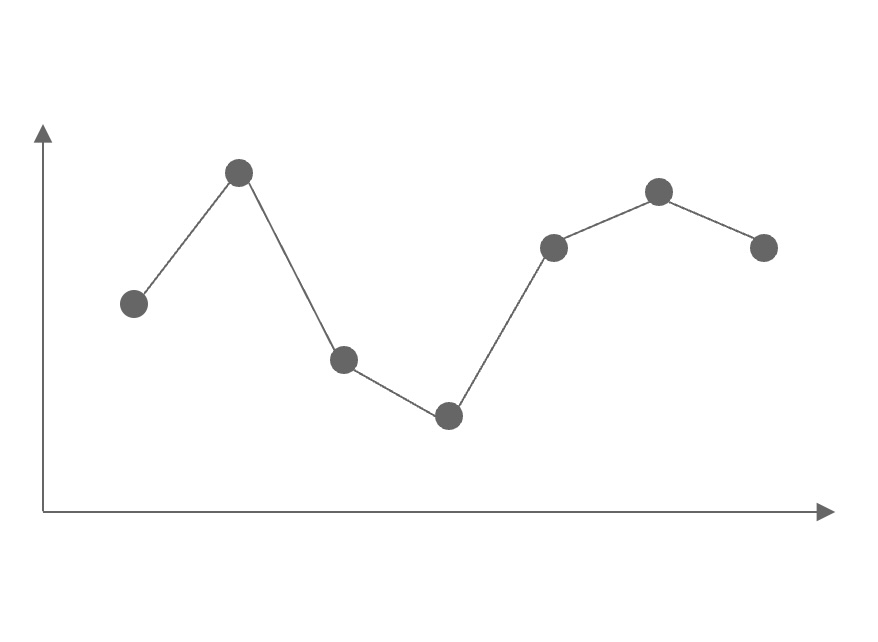 ::: :::: ::: footer Material from Enrico Bertini ::: ## Just Noticeable Difference (JND) * The amount something must be changed to be noticeable at least 50% of the time * Stevens's power law: [Wikipedia link](https://en.wikipedia.org/wiki/Stevens%27s_power_law) {width="60%"} ::: footer Wikipedia: [Just-noticeable difference](https://en.wikipedia.org/wiki/Just-noticeable_difference) ::: ## Channel Separability Amount of interference between channels 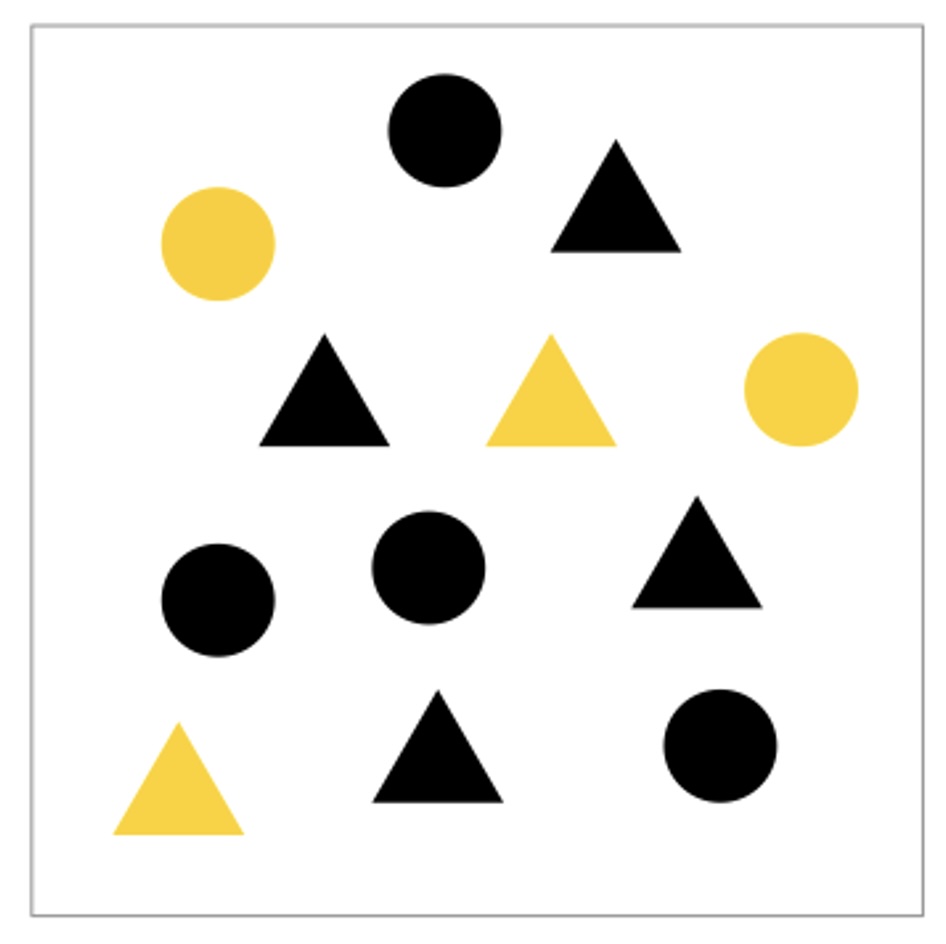{width="70%"} Some channel combinations interfere more than others ::: footer Slides based on material from Prof. Enrico Bertini ::: ## Introduction to D3.js ### What is D3? * **D**ata-**D**riven **D**ocuments * JavaScript library for manipulating documents based on data * Created by Mike Bostock (Observable, NYTimes) * Low-level but powerful approach to visualization ### Key Concepts: - Bind data to DOM elements - Use data to drive visual properties - Declarative approach to visualization ## D3 Core Concepts ### Selections ```javascript d3.select("body") // Select single element d3.selectAll("circle") // Select all circles ``` ### Data Binding ```javascript circles.data(dataset) // Bind data to elements ``` ### Enter, Update, Exit Pattern ```javascript // Enter: Create new elements for new data // Update: Update existing elements // Exit: Remove elements with no data ``` ## D3 Scales Transform data values to visual values ```javascript // Linear scale for continuous data const xScale = d3.scaleLinear() .domain([0, 100]) // Data space .range([0, width]); // Visual space // Ordinal scale for categories const colorScale = d3.scaleOrdinal() .domain(["A", "B", "C"]) .range(["red", "green", "blue"]); ``` ## Simple D3 Bar Chart ```javascript // Set dimensions const width = 500, height = 300; const margin = {top: 20, right: 20, bottom: 30, left: 40}; // Create SVG const svg = d3.select("body").append("svg") .attr("width", width) .attr("height", height); // Create scales const x = d3.scaleBand() .range([margin.left, width - margin.right]) .padding(0.1); const y = d3.scaleLinear() .range([height - margin.bottom, margin.top]); // Load and visualize data d3.csv("data.csv").then(data => { // Set domains x.domain(data.map(d => d.category)); y.domain([0, d3.max(data, d => +d.value)]); // Create bars svg.selectAll(".bar") .data(data) .enter().append("rect") .attr("class", "bar") .attr("x", d => x(d.category)) .attr("width", x.bandwidth()) .attr("y", d => y(d.value)) .attr("height", d => height - margin.bottom - y(d.value)); }); ``` ## D3 vs. Vega-Lite :::: {.columns} ::: {.column width="50%"} ### D3.js - **Imperative**: How to create - Low-level control - Full flexibility - Steep learning curve - ~100 lines for bar chart ::: ::: {.column width="50%"} ### Vega-Lite - **Declarative**: What to create - High-level abstraction - Quick prototyping - Limited customization - ~10 lines for bar chart ::: :::: **When to use which?** - **Vega-Lite**: Exploration, standard charts - **D3**: Custom visualizations, interactions ## Perception Principles in Practice ### Design Guidelines: 1. **Use position** for primary comparisons 2. **Limit color categories** to 5-6 3. **Leverage pre-attentive features** for highlighting 4. **Apply Gestalt principles** for grouping 5. **Consider colorblindness** (~10% of males) ### Common Mistakes: - Too many colors in categorical data - 3D charts for 2D data - Relying on area/volume for precise values - Ignoring perceptual limits ## Lab Preview: Your First D3 Visualization ### Today's Lab Activities: 1. Set up D3 development environment 2. Create basic selections and data binding 3. Build a simple bar chart 4. Add scales and axes 5. Implement basic interactions (hover) ### Resources: - [D3.js Official Site](https://d3js.org) - [Observable D3 Gallery](https://observablehq.com/@d3/gallery) - [D3 Graph Gallery](https://d3-graph-gallery.com) ## Summary ### Visual Perception: - Pre-attentive features enable rapid visual search - Gestalt principles guide grouping and organization - Channel effectiveness varies by task - Humans excel at relative, not absolute judgments ### D3 Foundations: - Data-driven approach to visualization - Selections, data binding, and scales - More control but steeper learning curve than Vega-Lite ### Next Week: **Color Theory and D3 Scales** - Deep dive into color perception and advanced D3 techniques ## Reading for Next Week ### Required: - [The Science of Visual Data Communication](https://journals.sagepub.com/doi/full/10.1177/15291006211051956) - Franconeri et al. 2021 - [39 Studies About Human Perception](https://medium.com/@kennelliott/39-studies-about-human-perception-in-30-minutes-4728f9e31a73) - Kennedy Elliott - [D3 Scales Tutorial](https://observablehq.com/@d3/introduction-to-d3s-scales) ### Optional: - [Graphical Perception Paper](https://courses.cs.washington.edu/courses/cse512/25sp/uwnetid/readings/perception/Cleveland_GraphicalPerception.pdf) - Cleveland & McGill 1984 - **Visual Thinking for Information Design** (2nd Edition) by Colin Ware - Chapters on perception and color 