VisML Lab: Deep Learning, Hands-On
DS-GA 3001 - Fall 2026 - Playing with Neural Networks
NYU Center for Data Science
2026-10-27
Lab Overview
- Today: make tonight’s lecture concrete by breaking and fixing small neural networks
- Two browser tools, no installs: TensorFlow Playground and CNN Explainer
- Work in pairs. For each experiment, predict first, then test
- Next week: Visualization for NLP and LLMs
Plan for tonight (50 minutes)
| Minutes | |
|---|---|
| Tour of the Playground | 5 |
| Experiments 1-4 in the Playground | 25 |
| CNN Explainer | 12 |
| Debrief | 8 |
Experiments 3 and 4 are optional if we run short.
The Playground in One Slide
- Data: four 2-D datasets (circle, XOR, Gaussian, spiral)
- Features: what the network gets to see: \(x_1\), \(x_2\), and hand-made combinations
- Hidden layers: add or remove layers and neurons with the + / − buttons
- Output: the decision boundary, with training and test loss
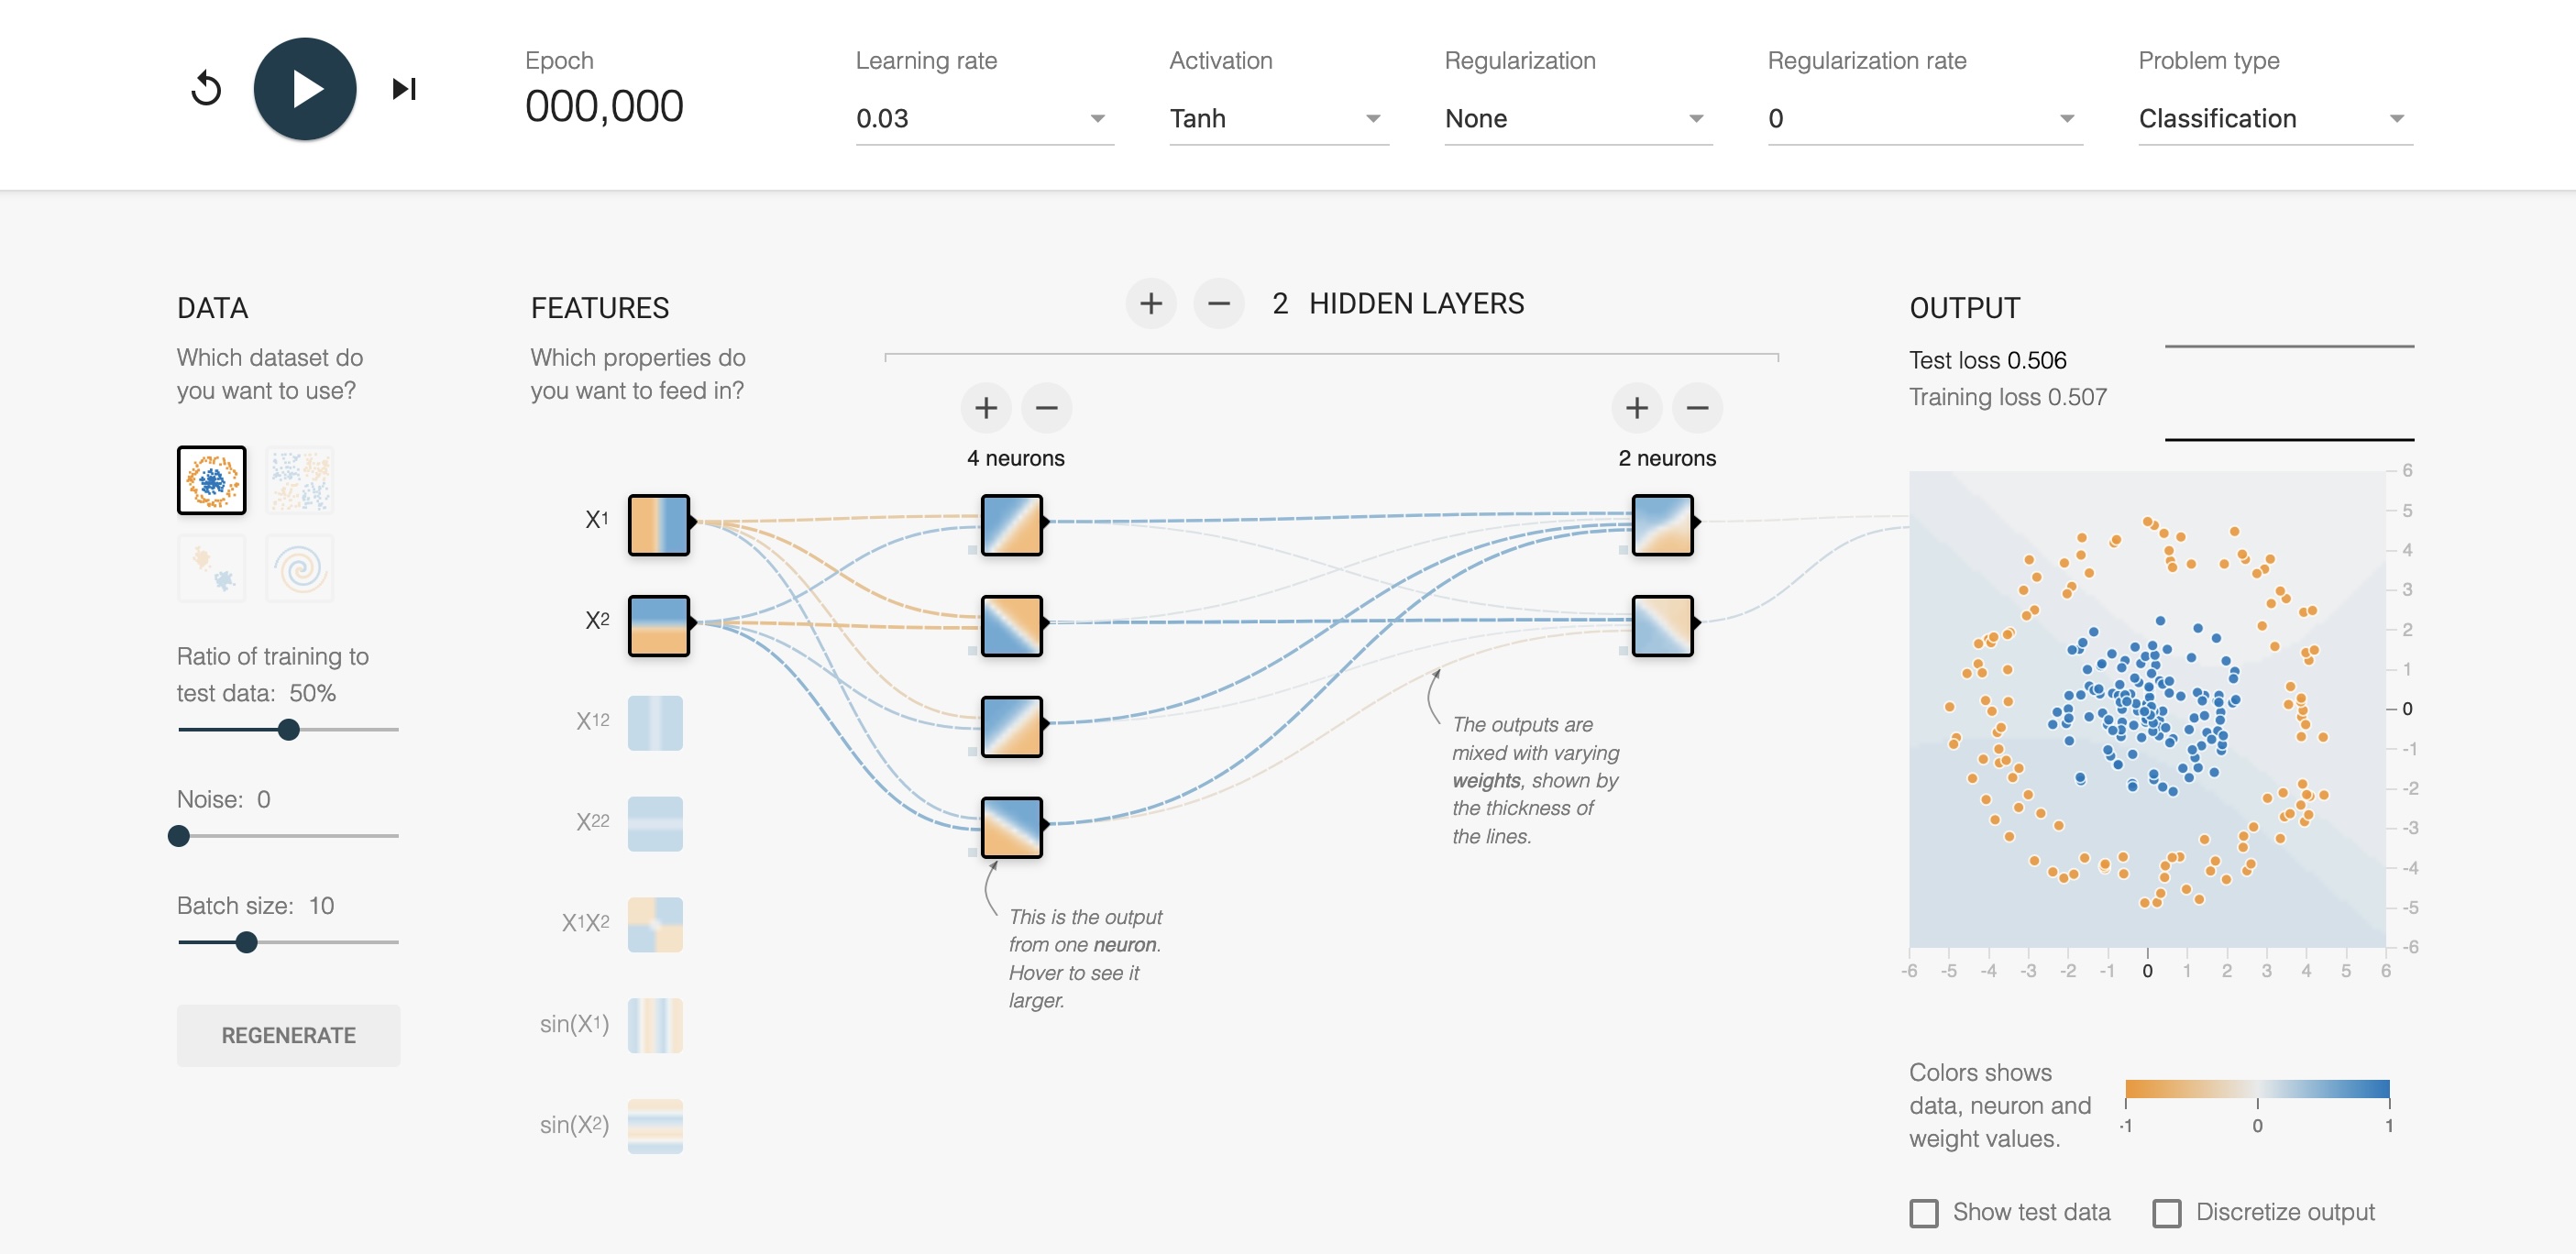
Open https://playground.tensorflow.org now. Press play once to see training run.
Experiment 1: Why Do We Need Hidden Layers?
Predict: can a network with no hidden layers separate the circle dataset?
- Choose the circle dataset. Features: only \(x_1\) and \(x_2\). Remove all hidden layers. Train.
- Add one hidden layer with 4 neurons (activation: tanh). Train again.
- Hover over each hidden neuron. What shape does each one draw?
Connect to lecture: a linear model gives a straight boundary; hidden units are the “bent lines” we composed.
Experiment 2: What Does the Activation Do?
Predict: what happens if the activation is linear and we add more layers?
- Use the circle dataset with a 2-layer network (4 + 2 neurons). Set the activation to Linear. Train.
- Switch to ReLU, then Tanh. Compare the boundaries.
- Return to Linear and make the network much bigger. Does the boundary change character?
Connect to lecture: without a non-linear activation, composing layers is still one linear function.
Experiment 3: Learning Rate
Predict: what happens at learning rates 0.003, 0.03 and 3?
- Use the circle dataset, 1 hidden layer of 4 neurons, Tanh. Reset between runs.
- Run each learning rate for the same number of epochs. Watch the loss curve (top right of the output panel).
- Which rate converges fastest? Which one is unstable?
Connect to lecture: \(\Phi_{new} = \Phi_{old} - \alpha \nabla L[\Phi]\). Too small is slow; too large overshoots.
Experiment 4: The Spiral
Predict: how small can the network be and still solve the spiral dataset?
- Start with only \(x_1\), \(x_2\) and one hidden layer. Train for a while.
- Add layers and neurons until the spiral is solved. Record the smallest network you find.
- Now go back to a small network and instead turn on extra features (\(\sin x_1\), \(\sin x_2\), \(x_1 x_2\)). Does that help?
Discuss: depth vs. width vs. better features. Which gave the most for the fewest parameters?
CNN Explainer: Setup
Open https://poloclub.github.io/cnn-explainer/
- The model is a small CNN trained on 10 image classes
- The overview shows the whole pipeline: input → convolution → ReLU → pooling → output
- Click a layer to expand it. Hover over an output cell to see which input patch produced it
Find: which layers are convolutions, which are ReLU, which are pooling?
CNN Explainer: Questions
Convolution
- Click a convolution layer, then a single activation map. What does that filter respond to?
- Do the first-layer maps look different from later-layer maps?
- How does the kernel slide across the input?
ReLU, pooling, output
- After ReLU, which pixels become exactly zero?
- What does pooling throw away? What does it keep?
- Which class gets the highest score for the sample image, and how confident is the network?
Connect to lecture: early layers = low-level features; later layers = parts and objects.
Debrief
- Which prediction did you get wrong? What did the visualization show that you did not expect?
- What can these tools not show? (Think: real data with thousands of dimensions, millions of weights.)
- Where would you need a different visualization for your project’s model?
Further Exploration
- TensorFlow Playground and its source
- CNN Explainer
- Prince, Understanding Deep Learning, Chapters 2-4 and the accompanying notebooks
- Next week (Nov 3): Visualization for NLP and LLMs