import numpy as np
import matplotlib.pyplot as plt
import sklearn
from sklearn.datasets import load_digits
from sklearn.decomposition import TruncatedSVD
from sklearn.discriminant_analysis import LinearDiscriminantAnalysis
from sklearn.ensemble import RandomTreesEmbedding
from sklearn.manifold import (Isomap, LocallyLinearEmbedding, MDS, SpectralEmbedding, TSNE)
from sklearn.neighbors import NeighborhoodComponentsAnalysis
from sklearn.pipeline import make_pipeline
from sklearn.random_projection import SparseRandomProjection
from sklearn.decomposition import PCA
import plotly.graph_objects as go
from umap import UMAPVisML Lab: Dimensionality Reduction in Practice
DS-GA 3001 - Fall 2026 - Dimensionality Reduction in Practice
2026-10-20
MNIST Dataset
- Dataset of 28x28 pixel images of handwritten digits

MNIST Dataset
- Every MNIST image can be thought of as a 28x28 array of numbers describing how dark each pixel is:
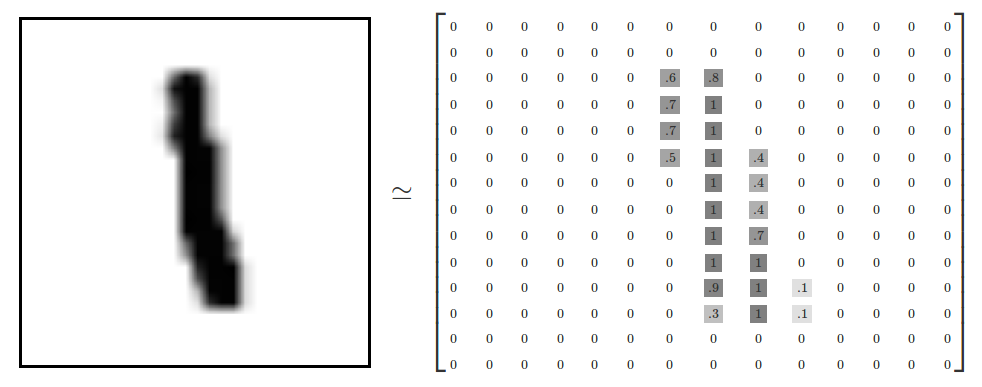
- We can flatten each array into a 28 * 28 = 784 dimensional vector, where each component of the vector is a value between zero and one describing the intensity of the pixel
- We can think of MNIST as a collection of 784-dimensional vectors
MNIST Dataset
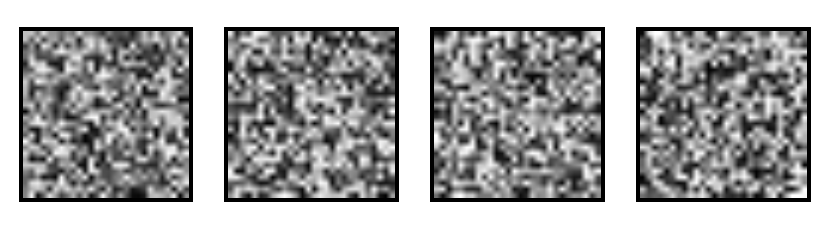
- But not all vectors in this 784-dimensional space are MNIST digits! Typical points in this space are very different
- To get a sense of what a typical point looks like, we can randomly pick a few random 28x28 images – each pixel is randomly black, white or some shade of gray. These random points look like noise:
MNIST Cube
- Imagine the MNIST data points as points suspended in a 784-dimensional cube
- Each dimension of the cube corresponds to a particular pixel
- The data points range from zero to one according to pixel intensity
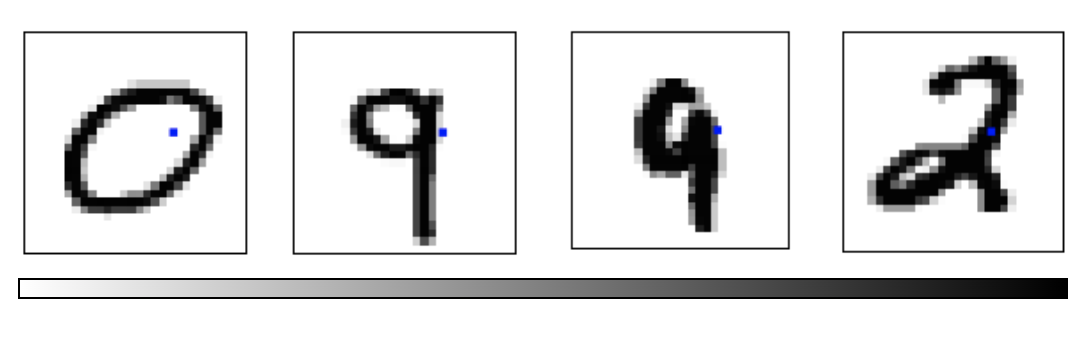
- On one side of the dimension, there are images where that pixel is white. On the other side of the dimension, there are images where it is black. In between, there are images where it is gray.
- What does this cube look like if we look at a particular two-dimensional face? Let's look at Olah's visualizations.
Principal Component Analysis Recap
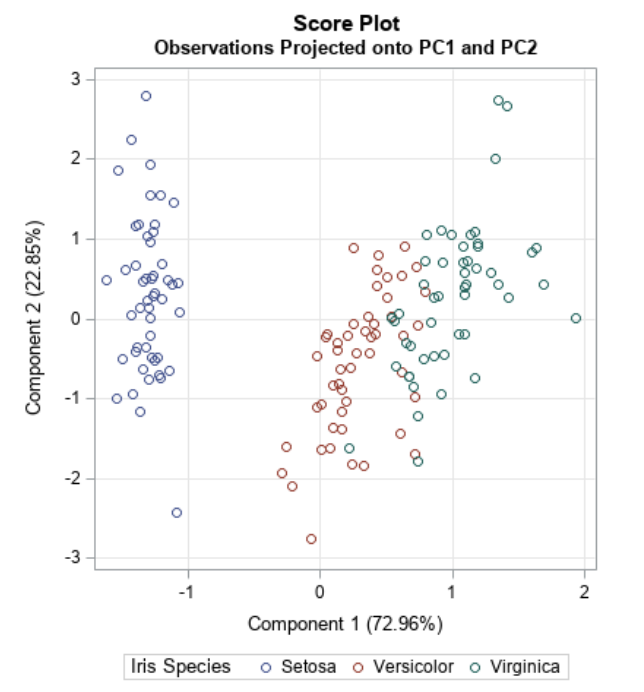
- Dimensionality reduction technique that allows us to find clusters of similar data points based on many features (which we boil down to two “principal components” PC1 and PC2)
- PC1 and PC2 represent the directions in the data space with the highest and second-highest variances, respectively
- Way to bring out strong patterns from large and complex datasets
PCA on MNIST
-
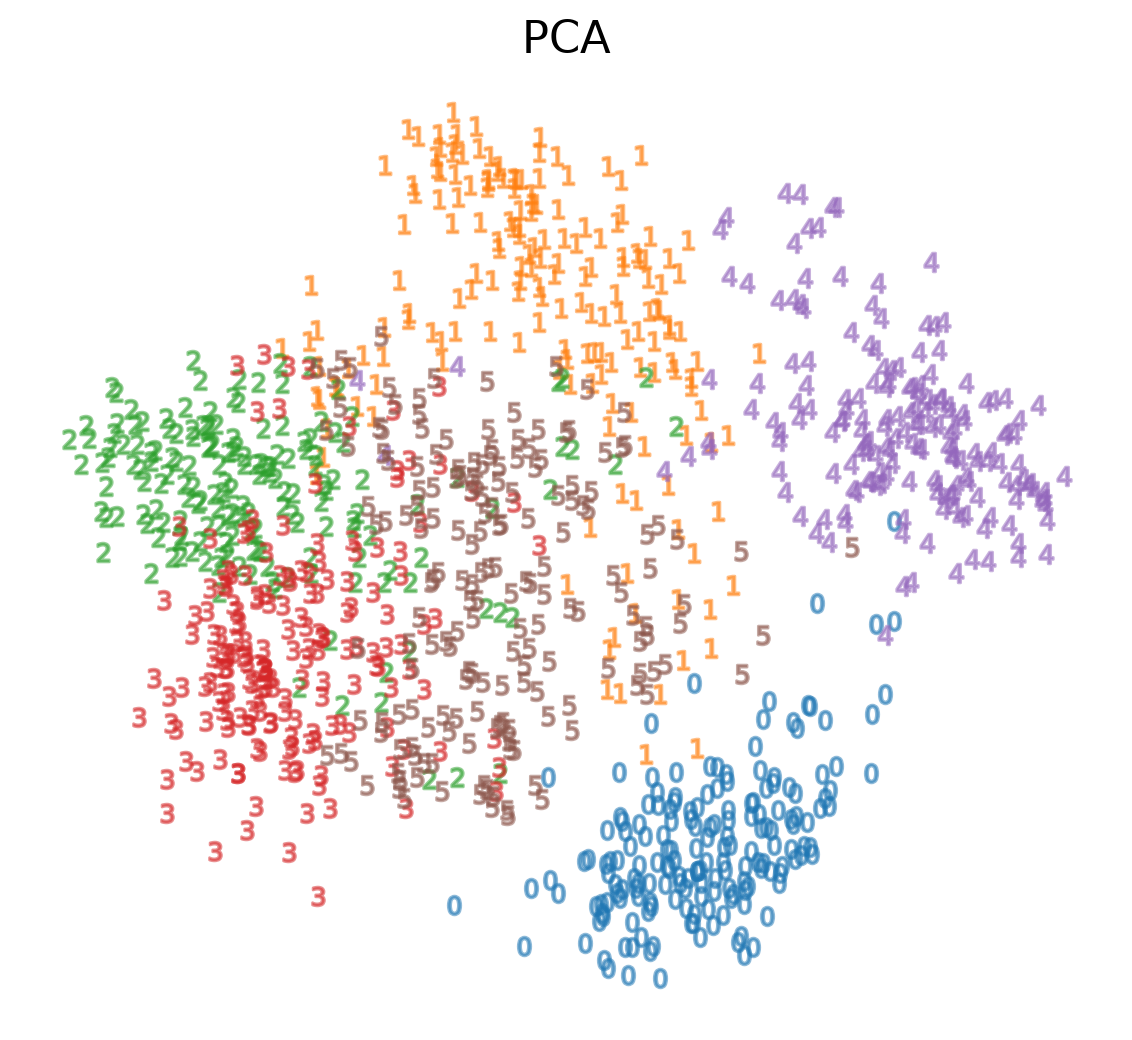
We see that we are able to reasonbly cluster the data by digit using PCA:
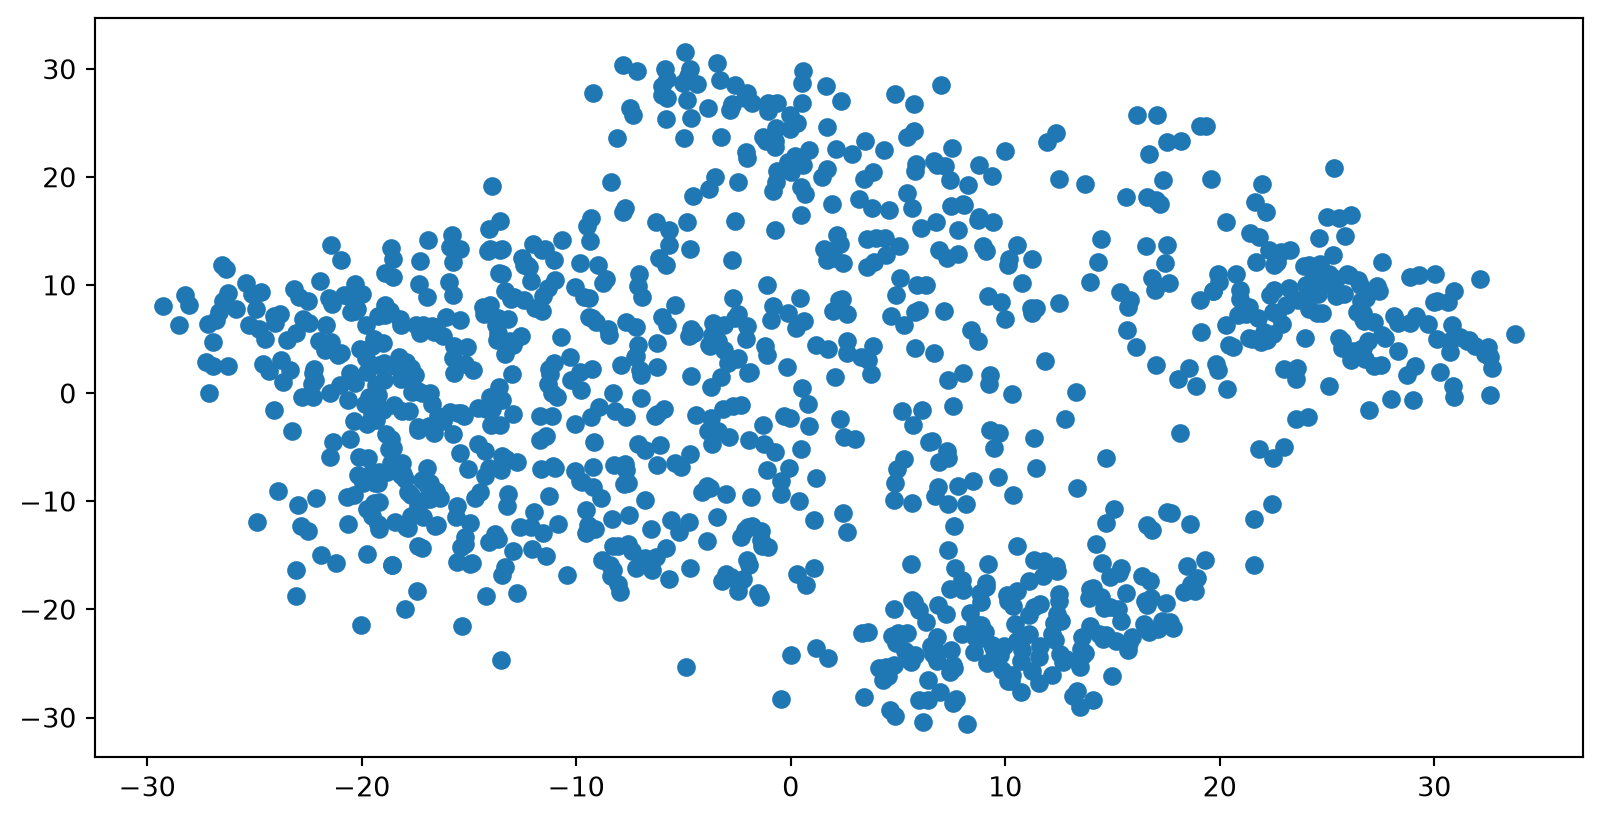
PCA on MNIST
-
We see that we are able to reasonbly cluster the data by digit using PCA:
Optimization-Based Dimensionality Reduction
- What if the distances between points in our visualization were the same as the distances between points in the original space?
- This captures the global geometry of the data
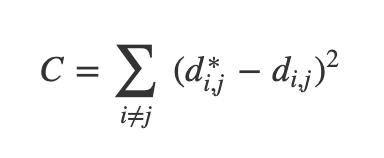
- In this case, we say that for any two MNIST data points, xi and xj, there are two notions of distance between them:
- d*i,j denotes the distance between xi and xj in the original space
- di,j denotes the distance between xi and xj in our visualization.
- Now we can define a cost:
Multidimensional Scaling (MDS)
- If these distances are similar, the cost is low (and vice versa). So a cost of zero is optimal (though we can never actually reach this)
- We can solve this as an optimization problem - we start with a random point and apply gradient descent
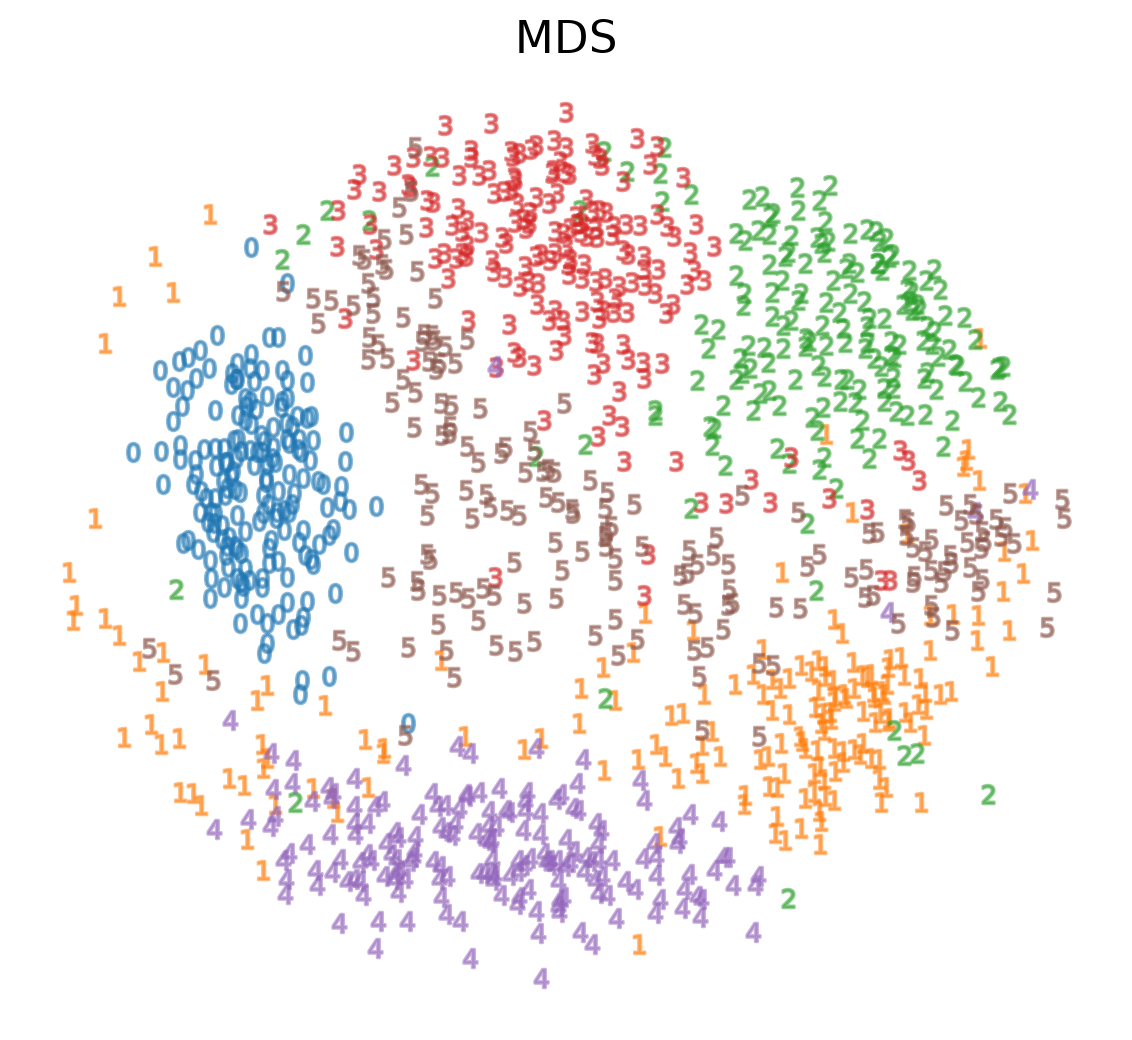
- This is called multidimensional scaling (MDS)
MDS on MNIST
Sammon’s Mapping
- There are many variations of MDS
- Common theme is to use a cost function that emphasizes local structure as more important to maintain than global structure
- One version of this is Sammon's Mapping, which uses the cost function:
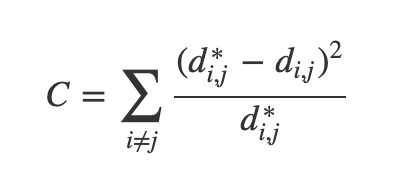
- In Sammon’s mapping, we try harder to preserve the distances between nearby points than between those which are far apart. If two points are twice as close in the original space as two others, it is twice as important to maintain the distance between them.
Sparse Random Projection
- Reduces the dimensionality by projecting the original input space using a sparse random matrix
- Alternative to dense Gaussian random projection matrix - guarantees similar embedding quality while being much more memory efficient and allowing faster computation of the projected data
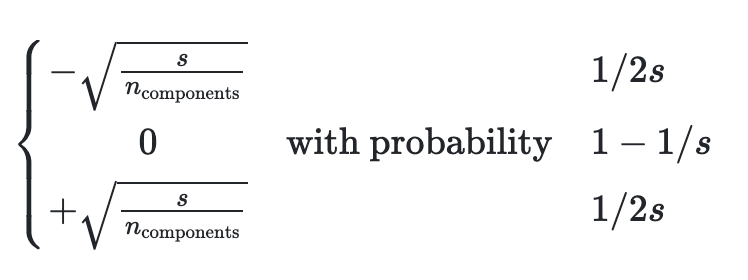
- If we define s = 1 / density, the elements of the random matrix are drawn from
-
where ncomponents is the size of the projected subspace. <li style=“font-size:30px”;>By default the density of nonzero elements is set to the minimum density as recommended by Ping Li et al: 1 /
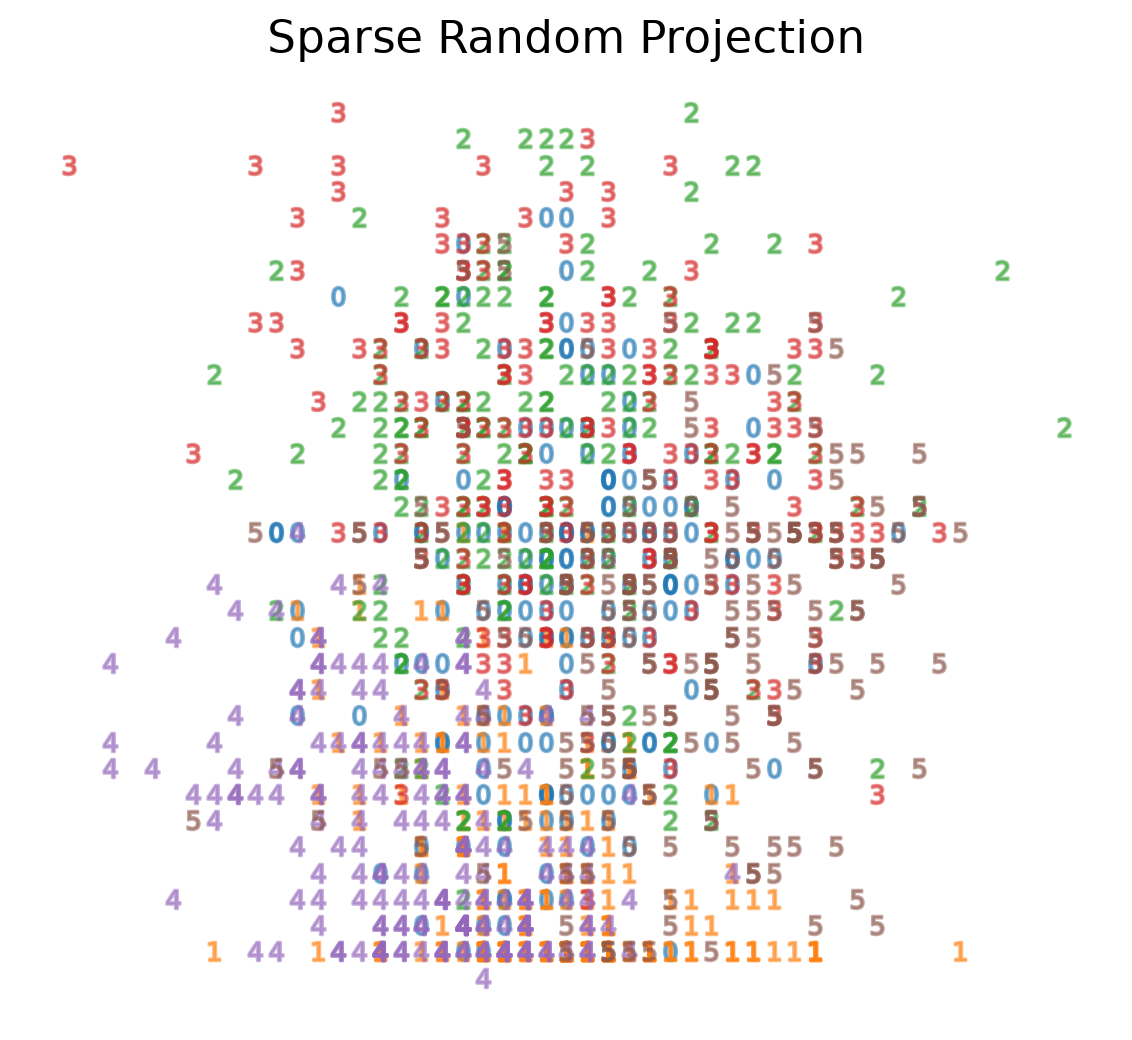
Sparse Random Projection on MNIST
Locally Linear Embedding
- First we find the k-nearest neighbors of each data point
- One advantage of the LLE algorithm is that there is only one parameter to tune (K). If K is chosen to be too small or too large, it will not be able to accomodate the geometry of the original data. Here, for each data point that we have we compute the K nearest neighbours.
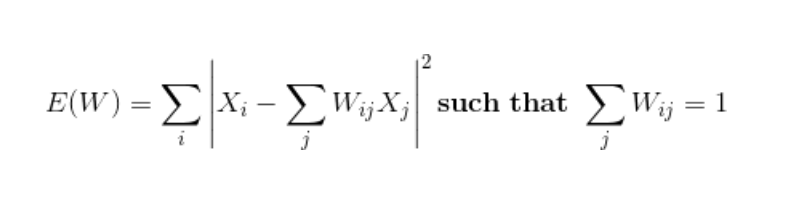
- Next, we approximate each data vector as a weighted linear combination of its k-nearest neighbors to construct new points. We try to minimize the cost function, where j’th nearest neighbour for point Xi.
Locally Linear Embedding
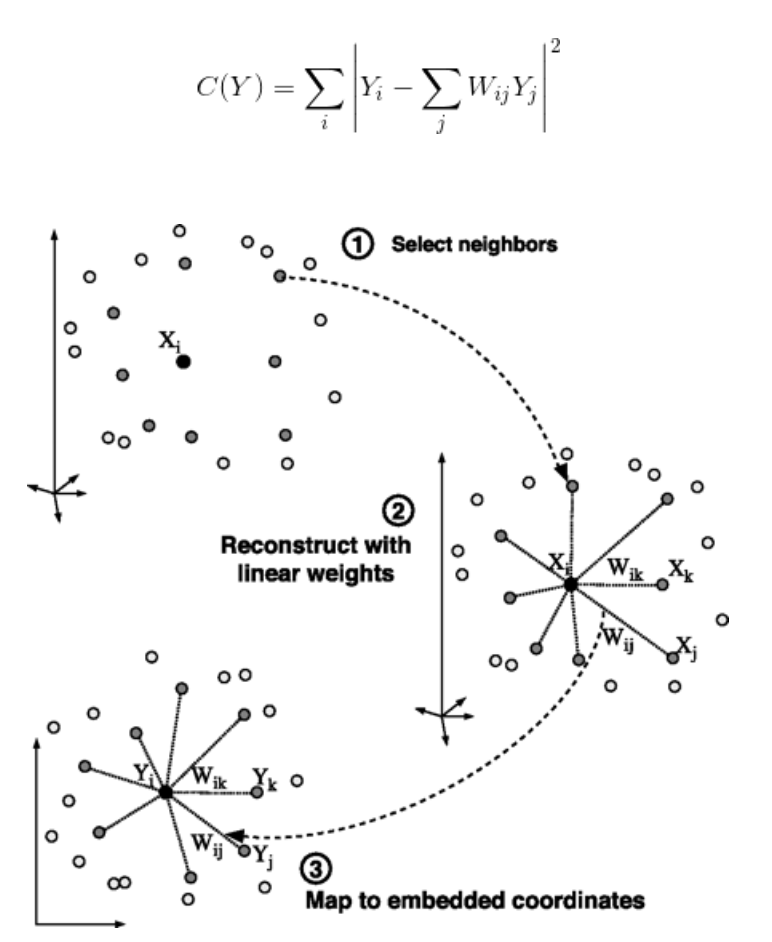
LLE on MNIST
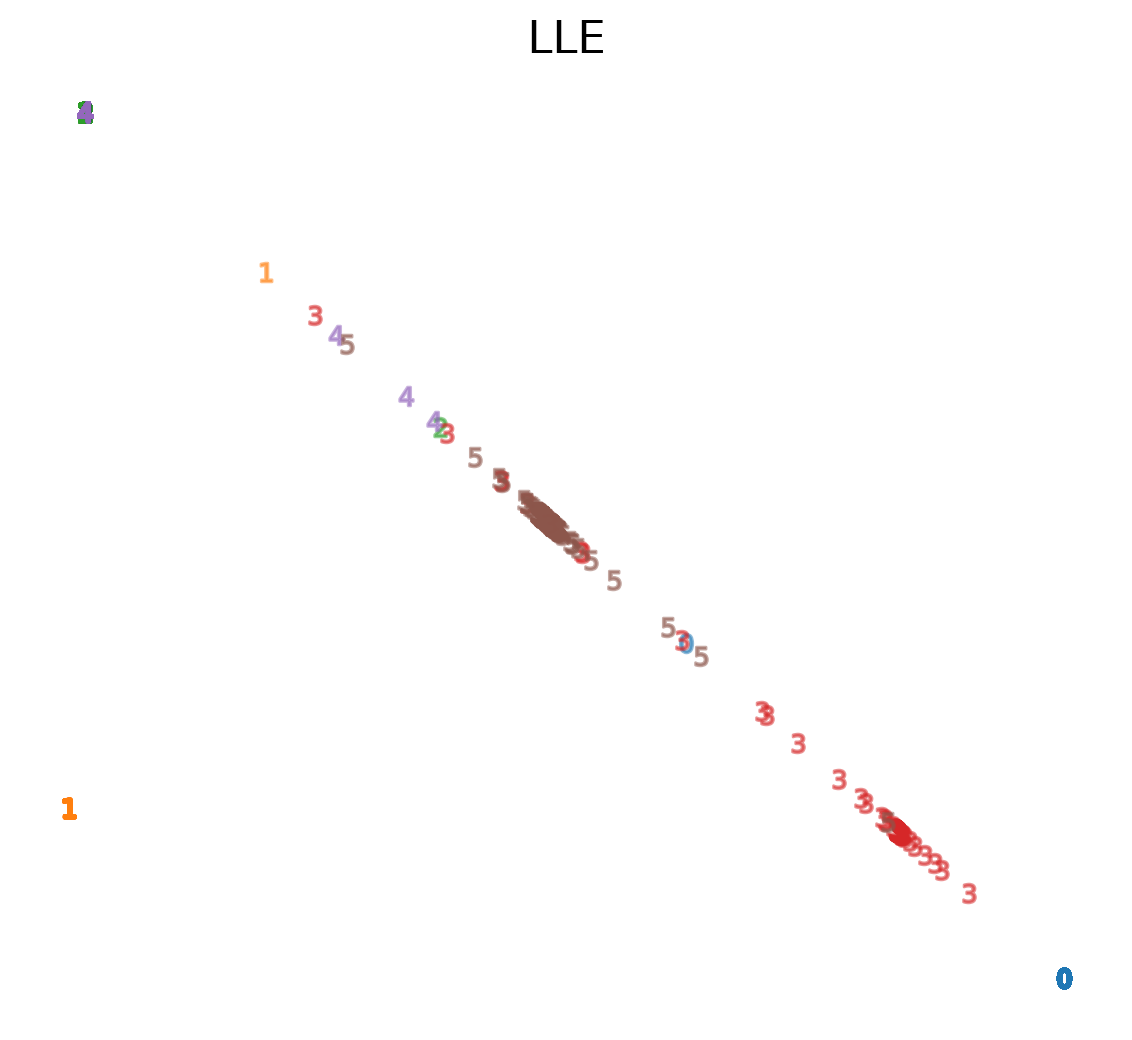
LLE: the one parameter matters
fig, axs = plt.subplots(1, 2, figsize=(9, 4.5))
for ax, k in zip(axs, [5, 30]):
    e = LocallyLinearEmbedding(
        n_neighbors=k, n_components=2).fit_transform(X)
    lo, hi = np.percentile(e, [2, 98], axis=0)  # skip outliers
    ax.scatter(e[:, 0], e[:, 1], c=plt.cm.tab10(y), s=6)
    ax.set_xlim(lo[0], hi[0]); ax.set_ylim(lo[1], hi[1])
    ax.set_title(f"LLE, n_neighbors={k}"); ax.axis("off")
plt.tight_layout()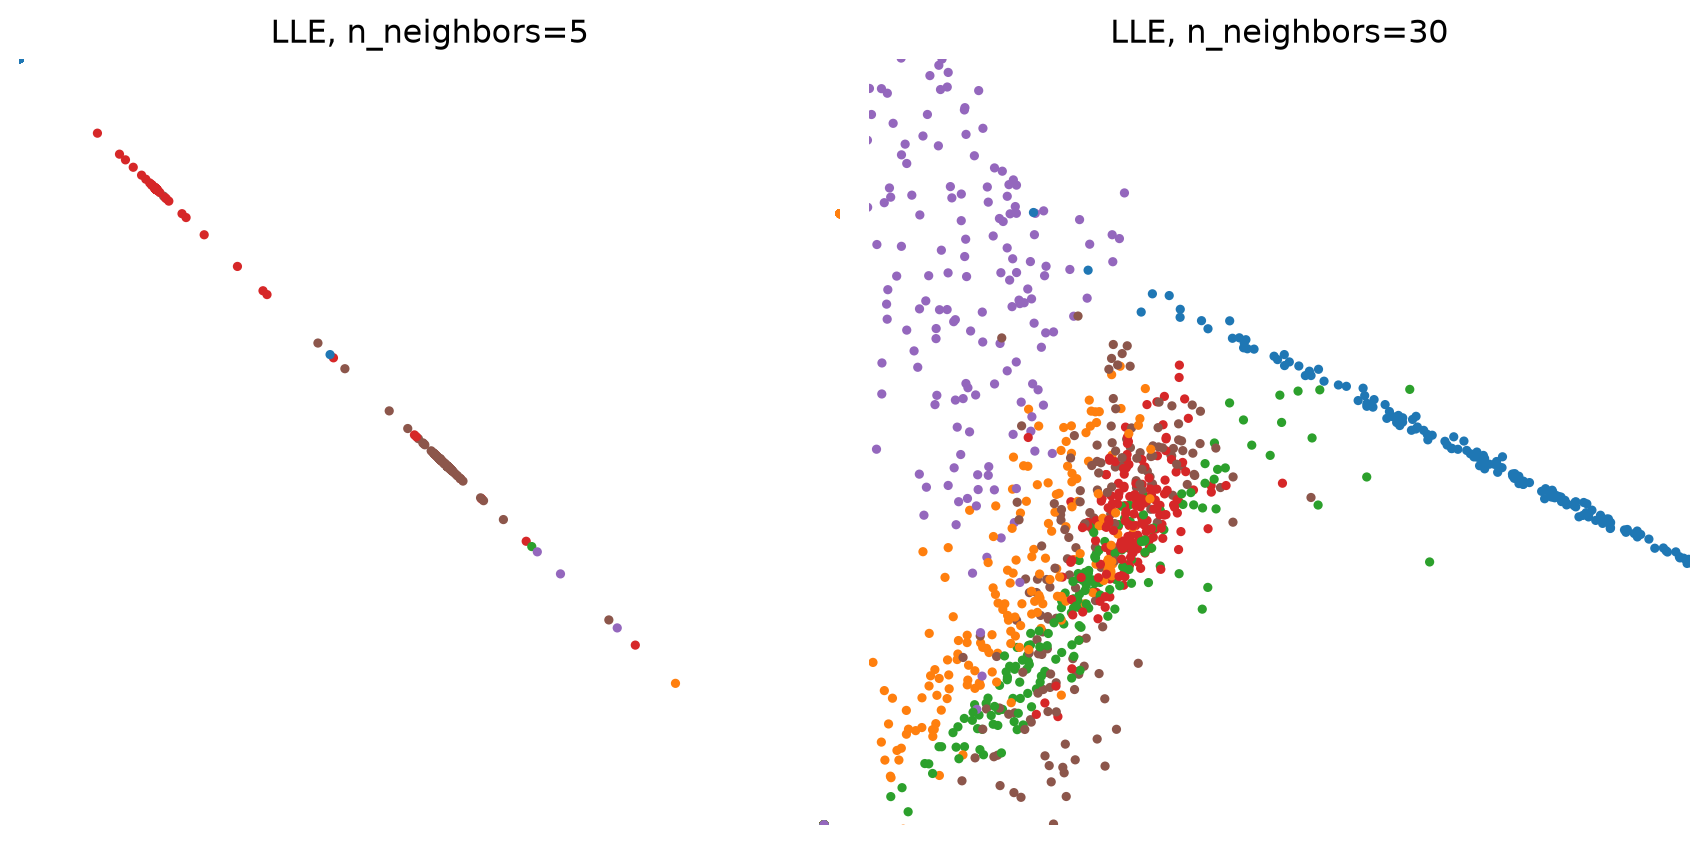
- With 5 neighbors the embedding is almost one-dimensional; with 30 it spreads out, but most digits overlap
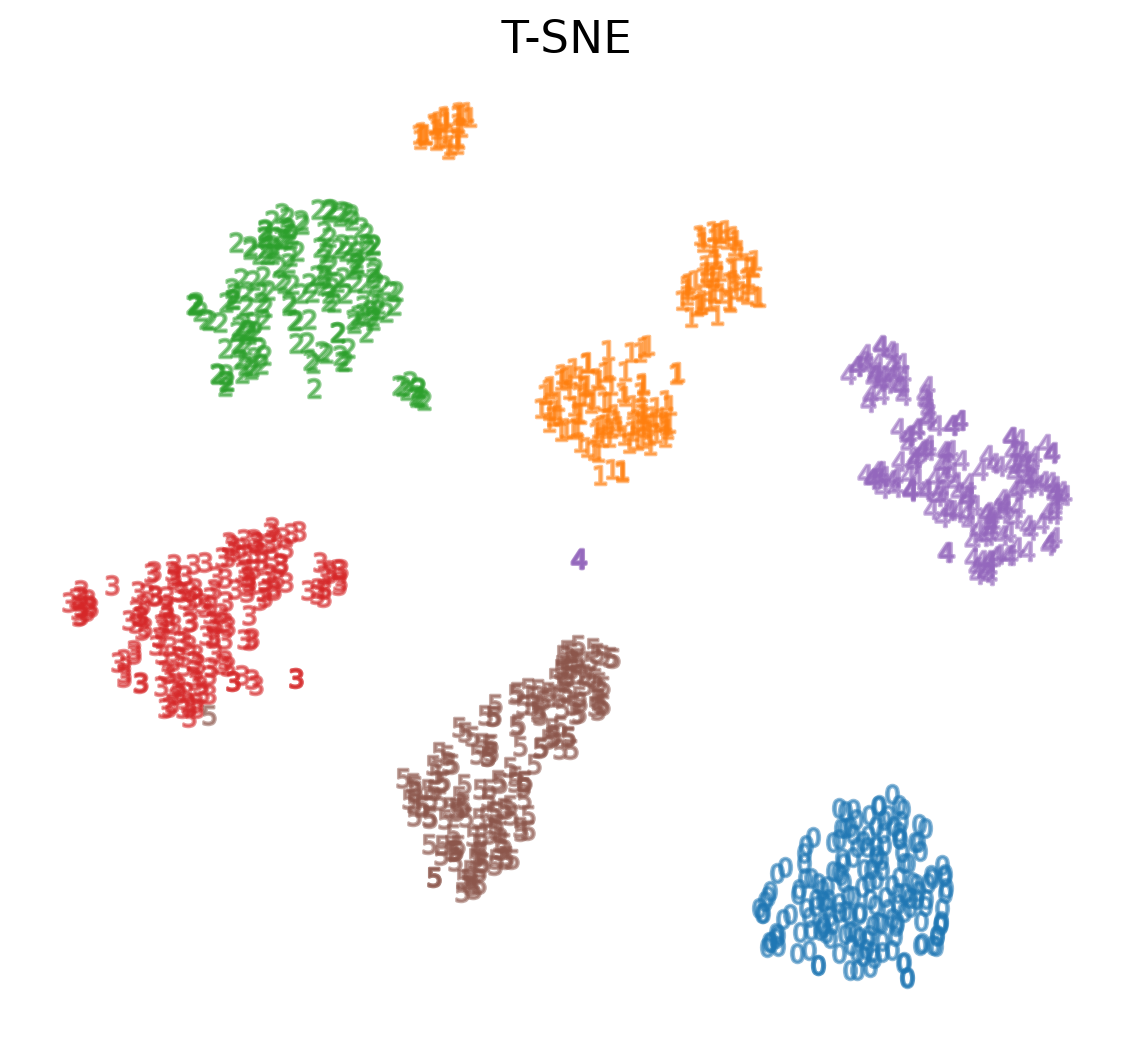
- Compare with t-SNE and UMAP below
t-SNE on MNIST
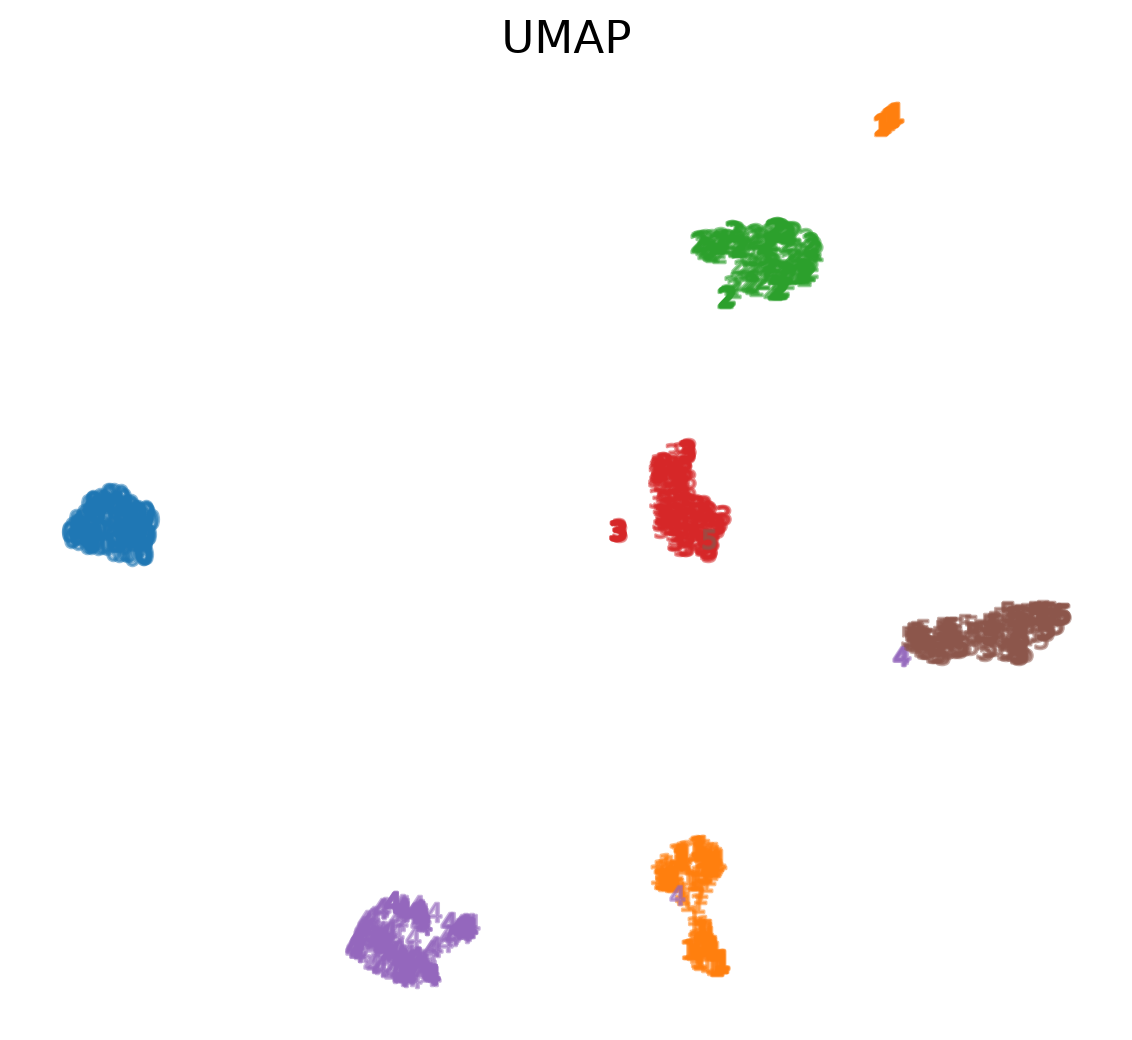
UMAP on MNIST
Exercise 1: perplexity
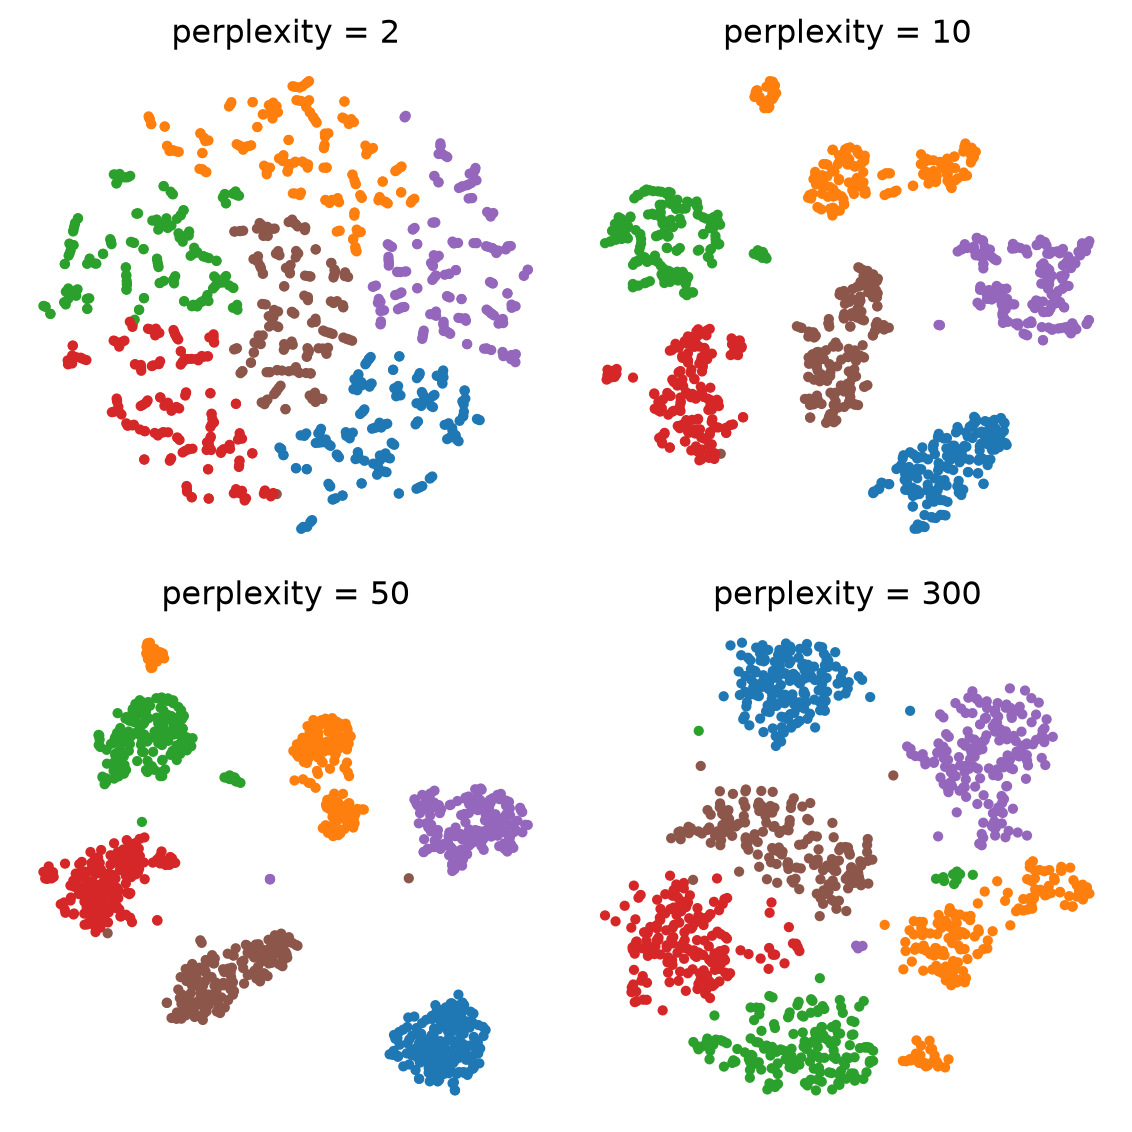
Discuss in pairs (2 min):
- Which perplexity would you show in a paper? Why?
- What goes wrong at 2? At 300?
- Change
random_state: what changes, what does not?
Exercise 2: is it real?
rng = np.random.default_rng(0)
noise = rng.normal(size=(500, 64))   # no structure
embs = {"PCA": PCA(2).fit_transform(noise)}
for p in [2, 5, 30]:
    embs[f"t-SNE, perplexity {p}"] = TSNE(
        perplexity=p, random_state=0).fit_transform(noise)
fig, axs = plt.subplots(2, 2, figsize=(6, 6))
for ax, (name, e) in zip(axs.ravel(), embs.items()):
    ax.scatter(e[:, 0], e[:, 1], s=8)
    ax.set_title(name); ax.axis("off")
plt.tight_layout()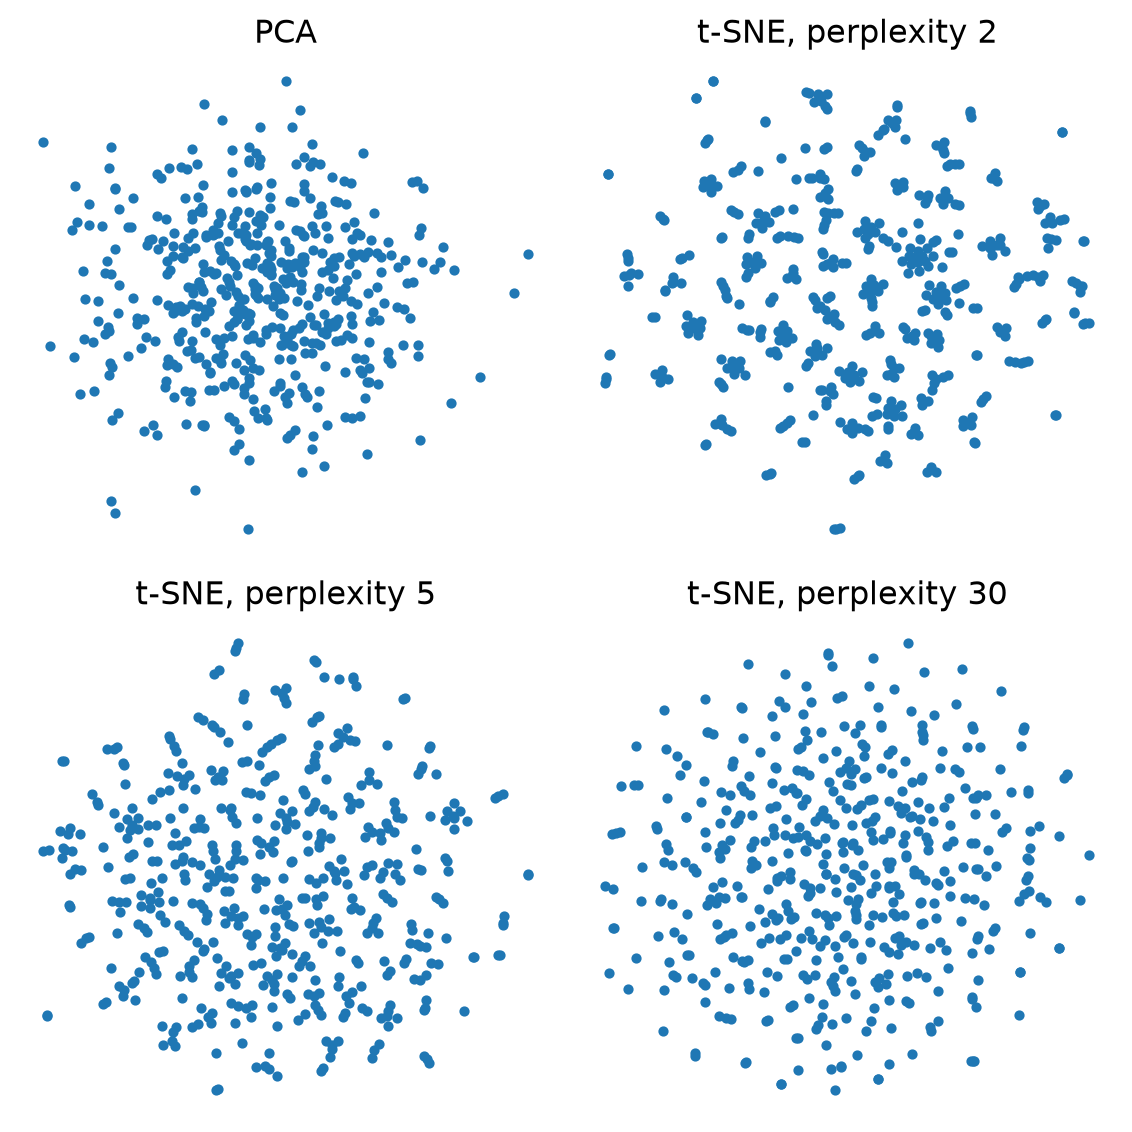
Discuss:
- The data is pure random noise. Do you see clusters?
- Which setting would have fooled you? What did every t-SNE panel lose?