## Project Overview **Visual Analytics for AI-Generated Urban Infrastructure Maps** :::: {.columns} ::: {.column width="50%"} ### The Goal Design and build visualization systems to help domain experts understand, debug, and analyze ML pipelines that generate urban infrastructure maps from aerial imagery. ### The Tool **Tile2Net**: A semantic segmentation system that extracts pedestrian networks from aerial imagery. ::: ::: {.column width="50%"} 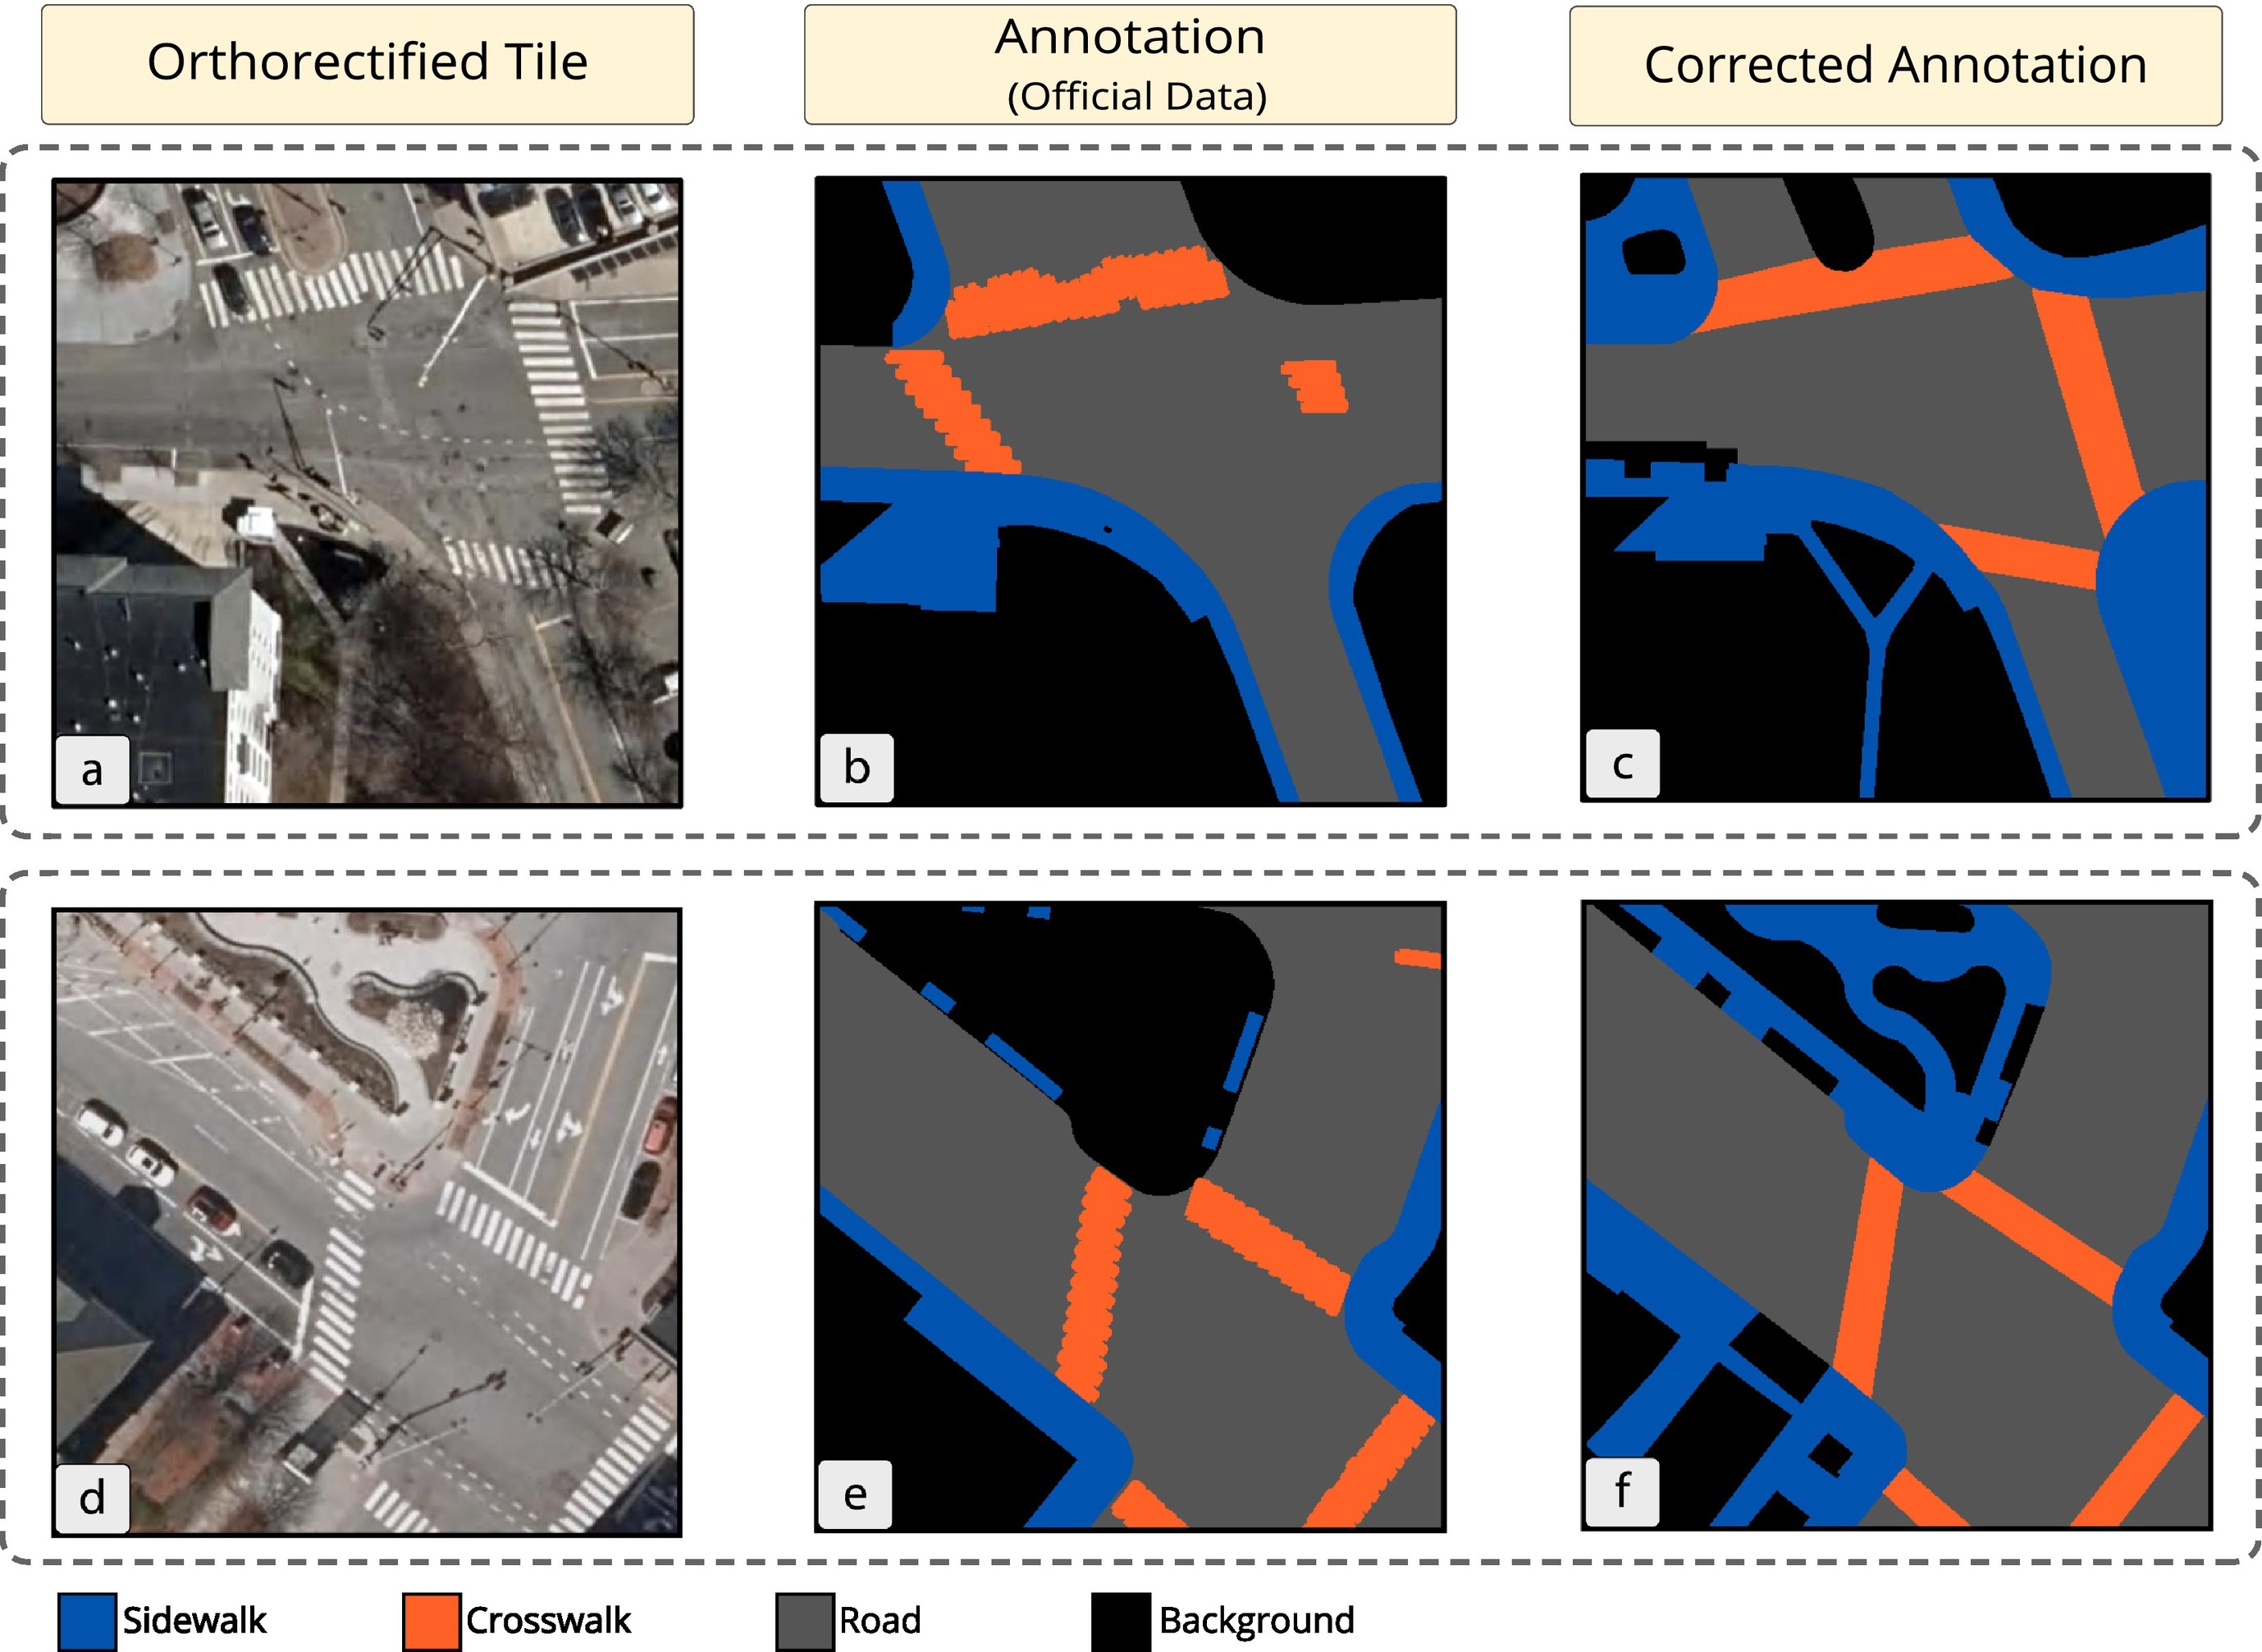 ::: :::: :::footer Hosseini, M., et al. (2023). [*Mapping the walk: A scalable computer vision approach for generating sidewalk network datasets from aerial imagery*](https://doi.org/10.1016/j.compenvurbsys.2023.101950). Computers, Environment and Urban Systems, 101, 101950. ::: # Motivation ## Why Urban Infrastructure Maps Matter :::: {.columns} ::: {.column width="50%"} ### Current Challenges - Manual mapping is **slow** and **expensive** - Data gaps in pedestrian infrastructure - Outdated city datasets - Accessibility planning requires detailed data ::: ::: {.column width="50%"} ### The Solution **Semantic Segmentation** + **Aerial Imagery** Automatically classify every pixel: - Roads - Buildings - Sidewalks - Crosswalks - Vegetation ::: :::: ## The Tile2Net Pipeline  **State-of-the-art tool** for extracting sidewalk and crosswalk networks from aerial imagery # The Challenge ## The Black Box is Brittle Multi-stage ML systems can introduce and compound errors at each stage: :::: {.columns} ::: {.column width="50%"} ### Stage 1: Image Ingestion - Different lighting conditions - Seasonal variations - Resolution mismatches ### Stage 2: Segmentation - Occlusions (trees, shadows) - Faded markings - Construction zones ::: ::: {.column width="50%"} ### Stage 3: Raster-to-Polygon - Geometric artifacts - Boundary smoothing errors - Feature simplification issues ### Stage 4: Polygon-to-Network - Disconnected components - Incorrect topology - Jagged centerlines ::: :::: ## The Problem :::: {.columns} ::: {.column width="60%"} ### Limited Reliability - Errors cascade through pipeline - Hard to identify failure points - Difficult to validate outputs - Reduced trust from urban planners ::: ::: {.column width="40%"} ### Your Mission Build **interactive visualization tools** to: - Understand model behavior - Debug pipeline stages - Analyze output quality - Increase trustworthiness ::: :::: # Project Ideas ## Three Potential Directions You can choose **one** direction or propose a hybrid/variation: ::: {.incremental} 1. **Idea A**: The Segmentation Detective - Diagnose pixel-level segmentation failures 2. **Idea B**: The Network Quality Inspector - Assess topological and geometric quality 3. **Idea C**: The Urban Time Traveler - Analyze infrastructure evolution over time ::: # Idea A: The Segmentation Detective ## Goal & Key Questions ### Goal Build a visual analytics tool to **diagnose and understand failures** of the semantic segmentation model at the pixel and tile level. ### Key Questions ::: {.incremental} - Where does the model **succeed** and where does it **fail**? - What visual features correlate with specific error types? - How does prediction **confidence** relate to **accuracy**? - How do environmental factors (shadows, tree cover) impact performance? ::: ## Potential Features :::: {.columns} ::: {.column width="50%"} ### Linked Views Dashboard - Original aerial image - Ground-truth annotations - Model predictions - Confidence maps ### Error Overlay - Highlight false positives - Highlight false negatives - Color-coded by error type ::: ::: {.column width="50%"} ### Interactive Tools - Filter by error type - Filter by confidence threshold - Isolate problem regions ### Magnification Lens - Focus on specific regions - View all layers simultaneously - Compare predictions vs. truth ::: :::: # Idea B: The Network Quality Inspector ## Goal & Key Questions ### Goal Create a visualization tool to assess the **topological and geometric quality** of the final pedestrian network graph. ### Key Questions ::: {.incremental} - Where are breaks or **disconnected components**? - Are **intersections** generated correctly? - Can we flag geometric **anomalies** automatically? - How does the network compare to **baselines** (e.g., OpenStreetMap)? ::: ## Potential Features :::: {.columns} ::: {.column width="50%"} ### Quality-Coded Map - Color edges/nodes by metrics - Connectivity indicators - Smoothness measures - Segment length analysis ### Automatic Flagging - Dead-end detection - Isolated subgraphs - Click to inspect imagery ::: ::: {.column width="50%"} ### Network Comparison - Diff view vs. OpenStreetMap - Diff view vs. city data - Overlay reference networks ### Graph Metrics - Node degree distribution - Betweenness centrality - Network connectivity - High-level quality overview ::: :::: # Idea C: The Urban Time Traveler ## Goal & Key Questions ### Goal Design a visual tool for analyzing the **evolution** of urban pedestrian infrastructure over time using historical aerial imagery. ### Key Questions ::: {.incremental} - How has the pedestrian network **changed** over the last decade? - Where have sidewalks/crosswalks been **added or removed**? - Can we correlate changes with city **planning initiatives**? - How do **walkability metrics** change over time? ::: ## Potential Features :::: {.columns} ::: {.column width="50%"} ### Visual Diff Map - Highlight changes between time periods - Show added paths (green) - Show removed paths (red) - Show modified paths (yellow) ### Timeline Animation - Slider control - Animate network evolution - Year-by-year transitions ::: ::: {.column width="50%"} ### Temporal Dashboard - Network map view - Linked time-series charts - Track metrics over time: - Total sidewalk length - Network density - Number of intersections ### Case Study Example Cambridge, MA: 23% change in crosswalks over 8 years ::: :::: # Getting Started ## Resources: Codebase & Data :::: {.columns} ::: {.column width="50%"} ### Primary Tool **Tile2Net** - Install and run the pipeline - [GitHub Repository](https://github.com/VIDA-NYU/tile2net) ### Aerial Imagery Sources - **NYC Planimetrics**: High-res imagery for multiple years - **USGS NAIP**: National aerial imagery - **Google Earth Engine**: Vast satellite/aerial catalog ::: ::: {.column width="50%"} ### Ground Truth Data **For Comparison & Validation:** - **OpenStreetMap (OSM)** - Crowd-sourced global data - Detailed pedestrian features - **City GIS Portals** - Official sidewalk data - Street centerlines - Planning datasets ::: :::: :::footer NYC Open Data: [https://opendata.cityofnewyork.us/](https://opendata.cityofnewyork.us/) | USGS EarthExplorer: [https://earthexplorer.usgs.gov/](https://earthexplorer.usgs.gov/) ::: # Deliverables ## What You Need to Submit ### 1. Project Proposal (Due Oct 21) - **Length**: 1-2 pages - **Content**: Chosen direction, research questions, datasets, timeline ### 2. Final Report (Due Dec 11) - **Length**: 4-6 pages (conference paper format, e.g., IEEE VIS) - **Sections**: Motivation, related work, system design, implementation, case study ## What You Need to Submit (cont.) ### 3. Source Code - **GitHub repository** with well-documented code - Setup instructions - Dependencies listed - Example usage ### 4. Demo Video - **Length**: 3-5 minutes - **Content**: - System features showcase - Walk through usage scenario - Highlight key insights # Summary ## Your Mission :::: {.columns} ::: {.column width="50%"} ### The Challenge Multi-stage ML pipelines for urban mapping are powerful but brittle. ### The Solution Build **visual analytics tools** to: - Diagnose failures - Validate outputs - Build trust - Enable exploration ::: ::: {.column width="50%"} ### Choose Your Path - **Idea A**: Debug segmentation models - **Idea B**: Inspect network quality - **Idea C**: Track urban evolution ### Impact Help urban planners make data-driven decisions with **trustworthy AI-generated maps**. ::: :::: ## Questions? ### Next Steps 1. Review Tile2Net documentation 2. Explore available datasets 3. Choose your project direction 4. Start drafting your proposal :::footer Tile2Net: [https://github.com/VIDA-NYU/tile2net](https://github.com/VIDA-NYU/tile2net) :::
