Color Theory for Visualization
DS-GA 3001 - Fall 2026
2026-09-15
Color
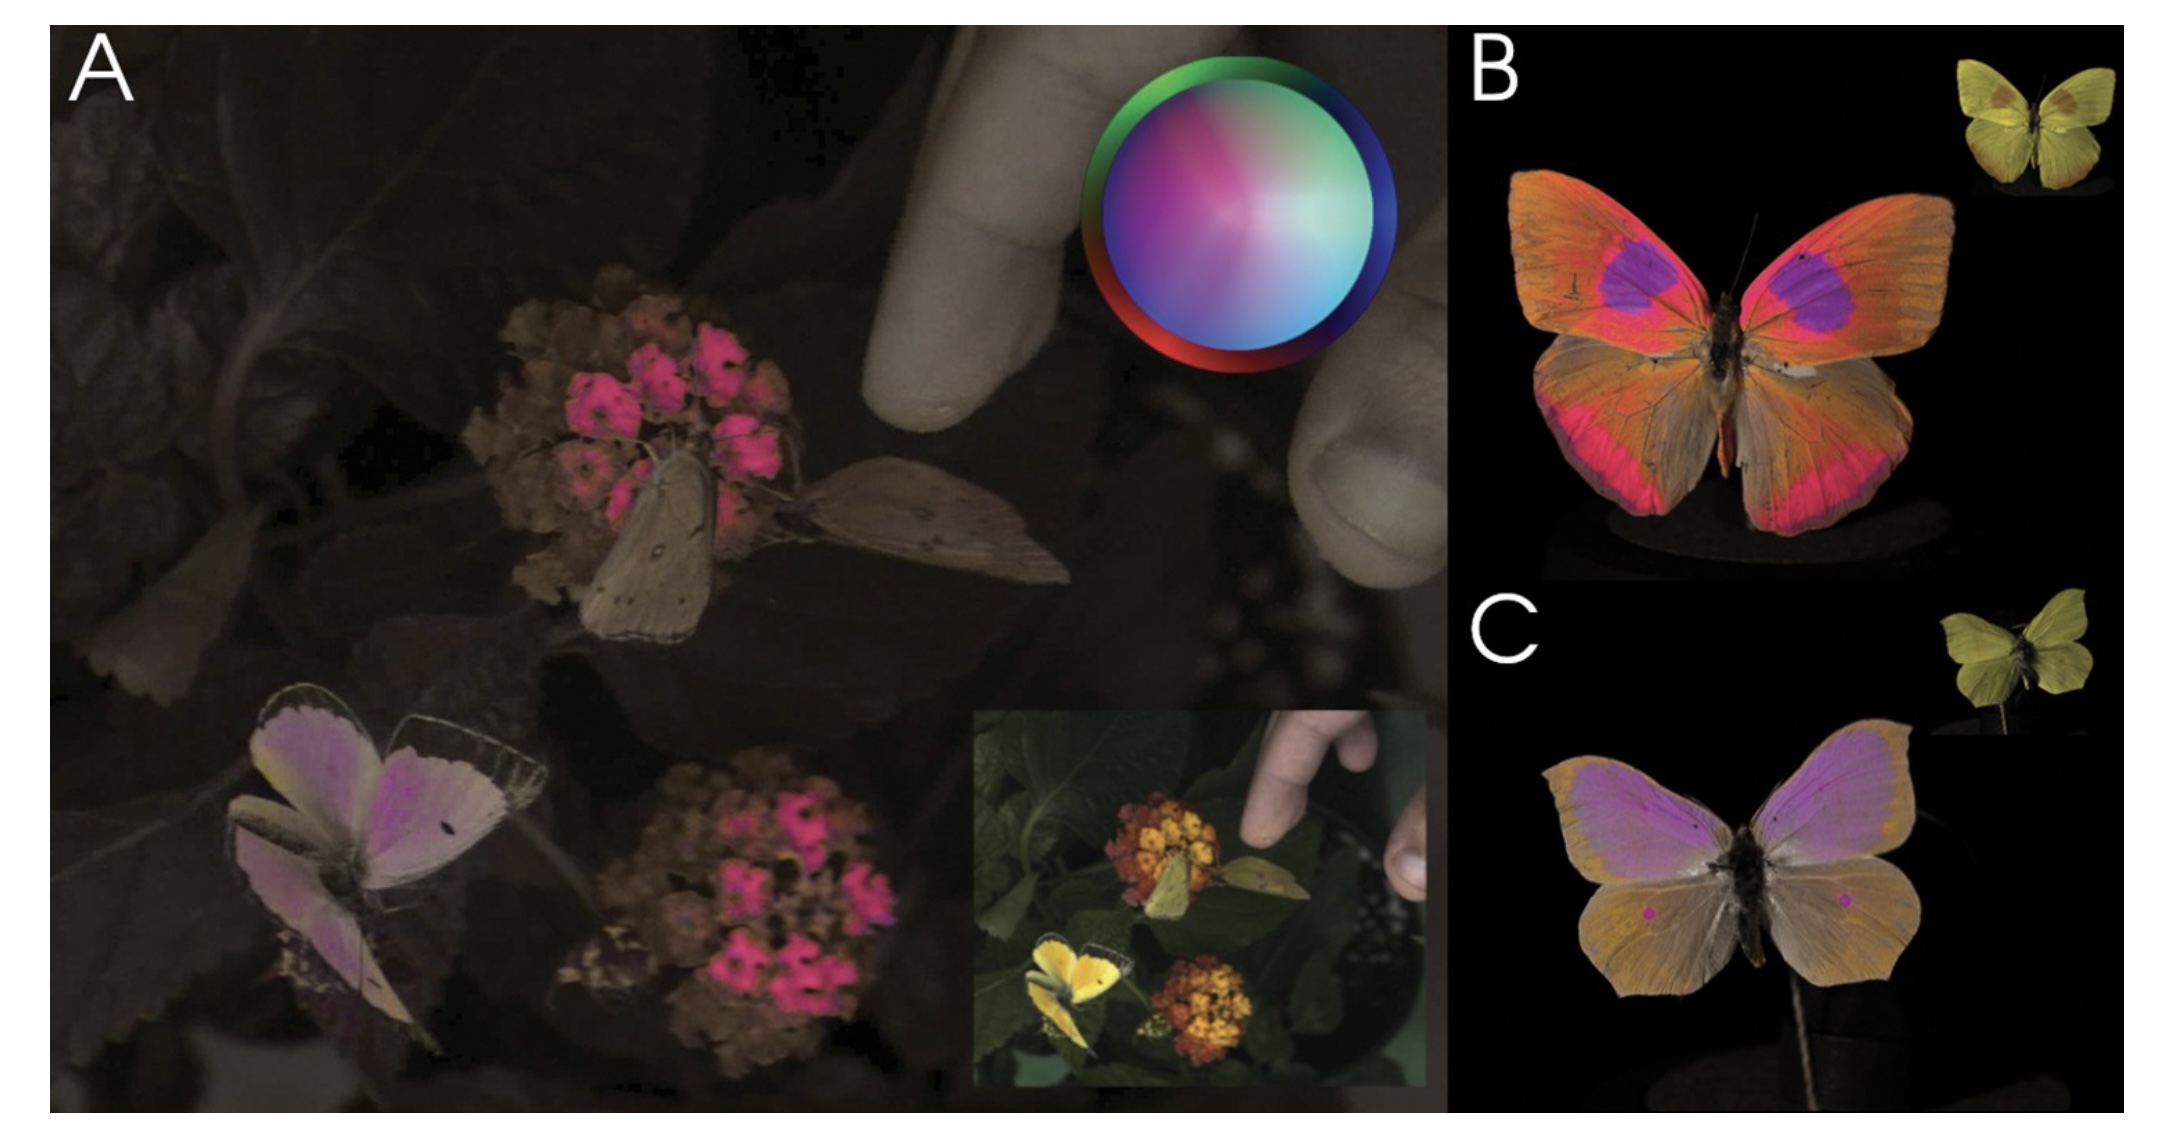
Vasas et al, PLOS Biology, 2024
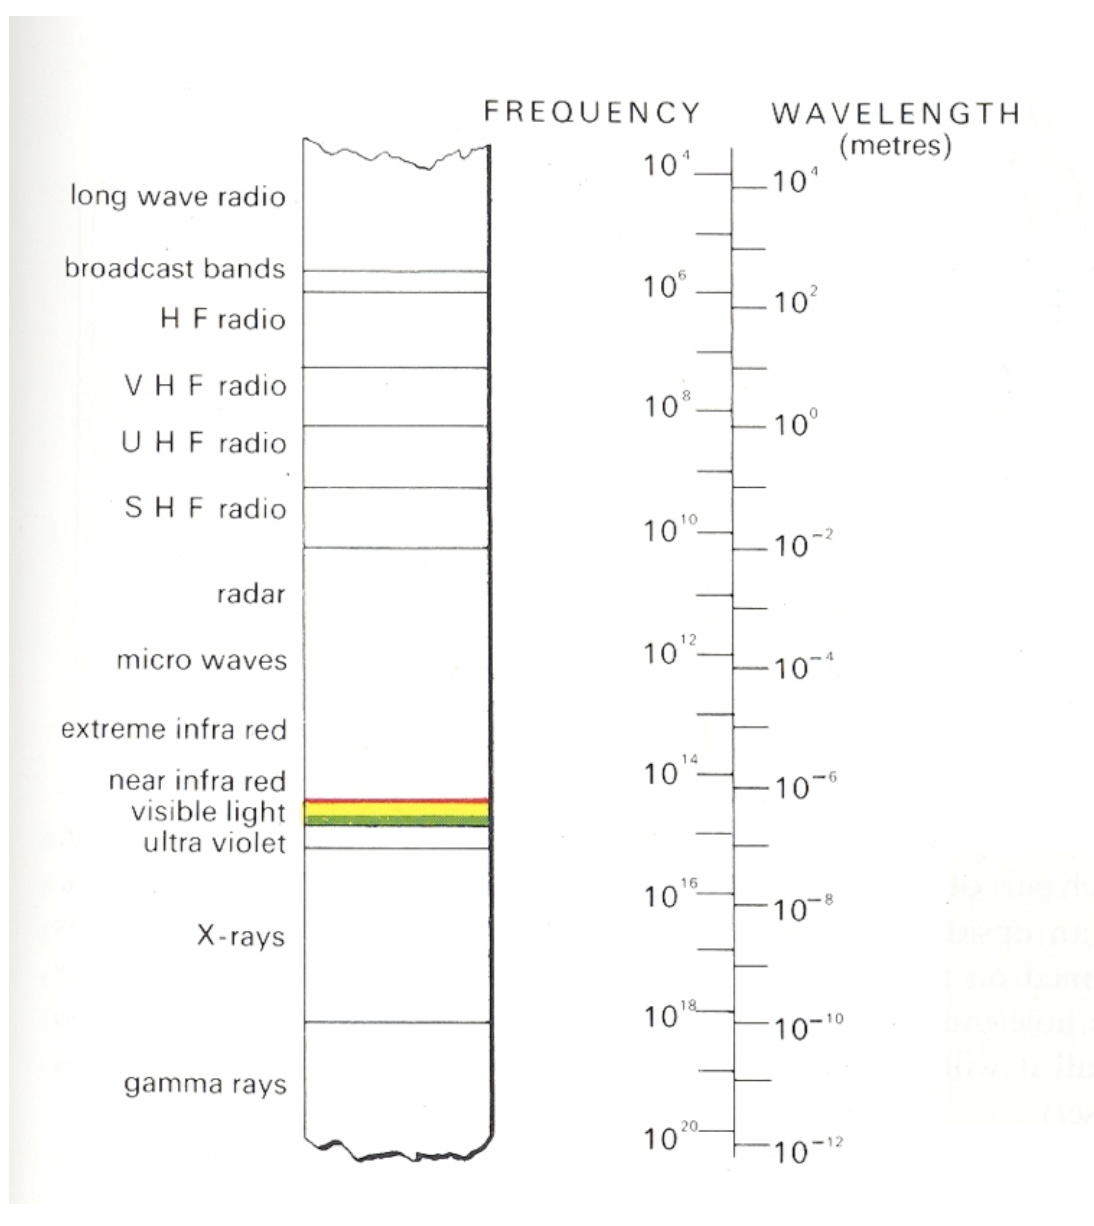
Visible Spectrum
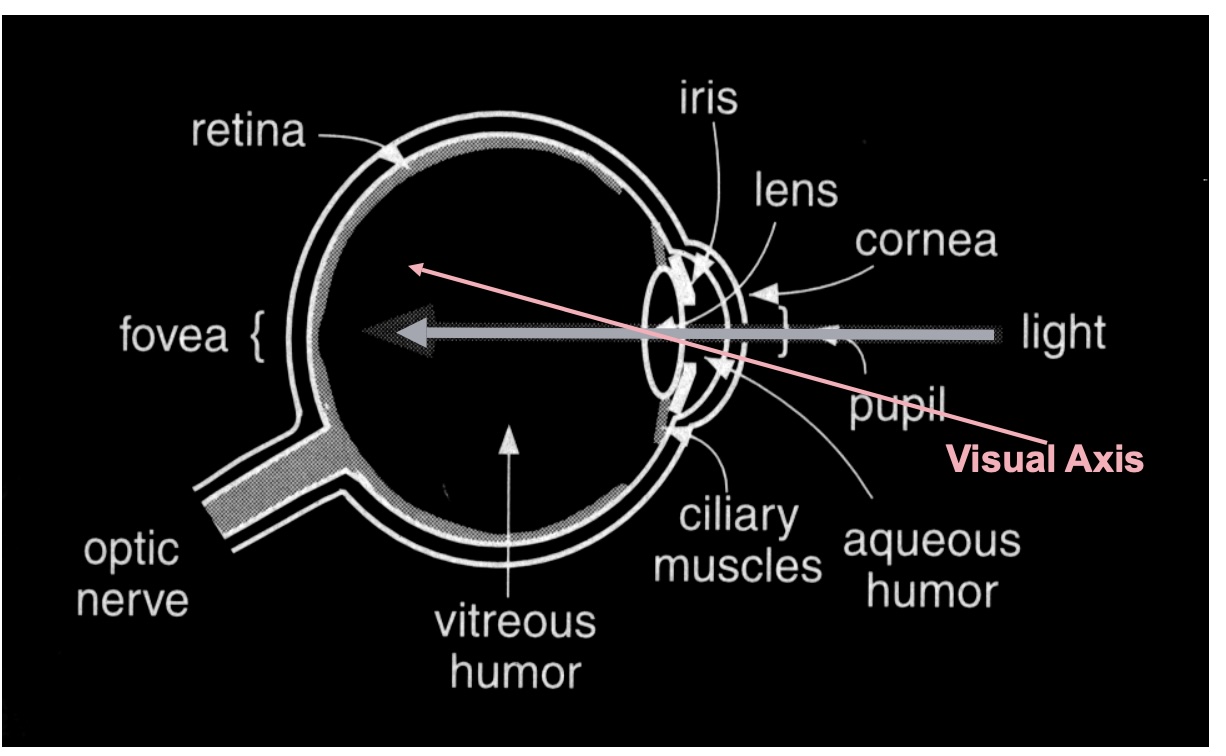
Physiology of the Eye
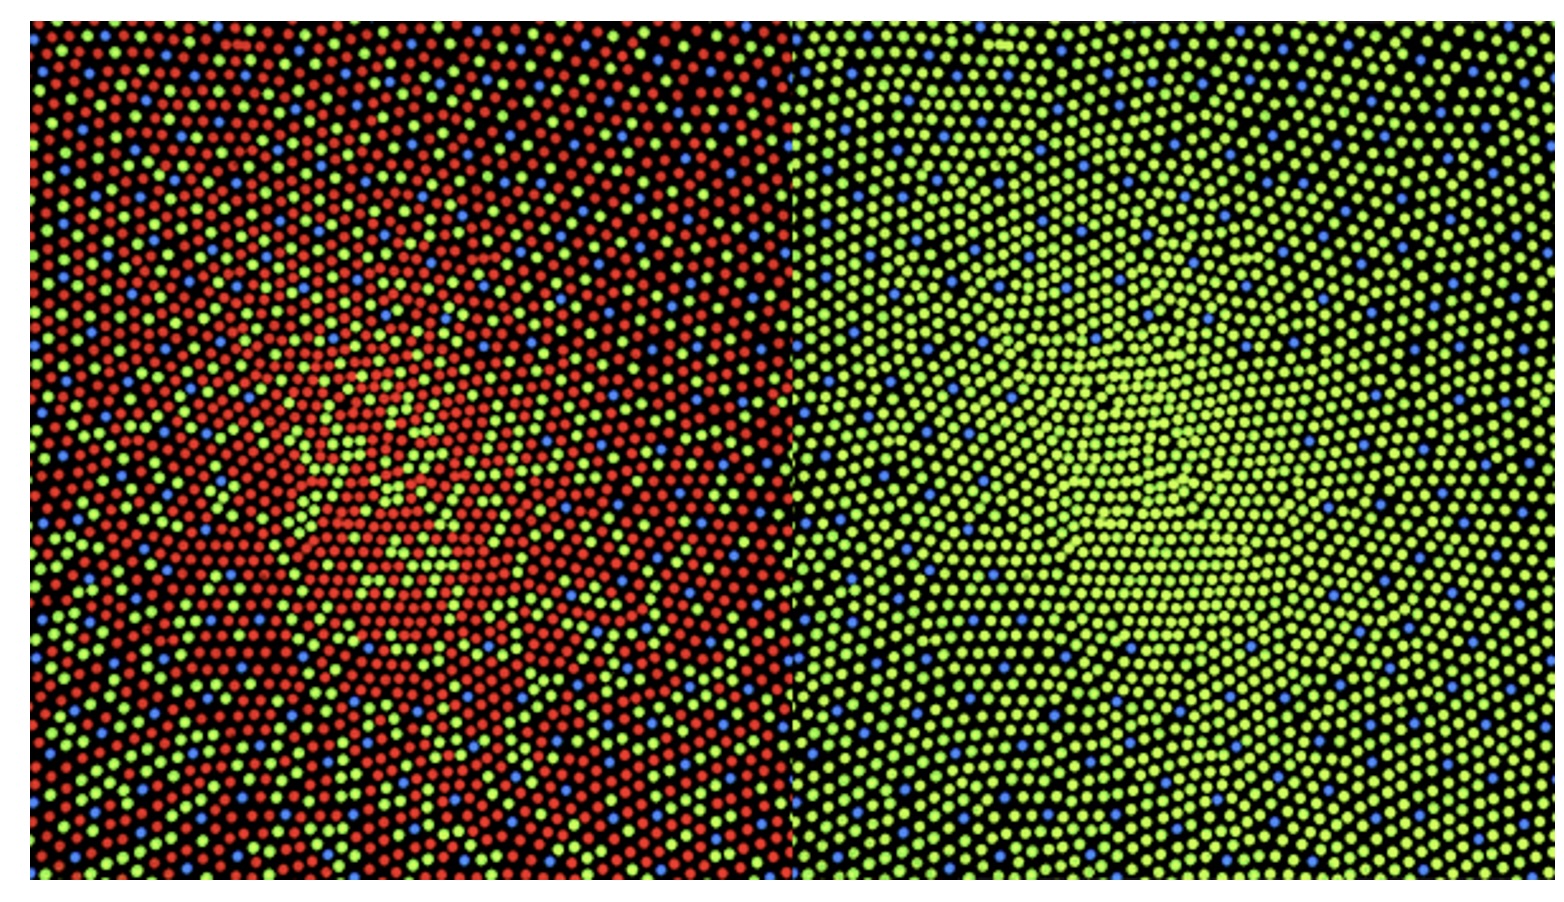
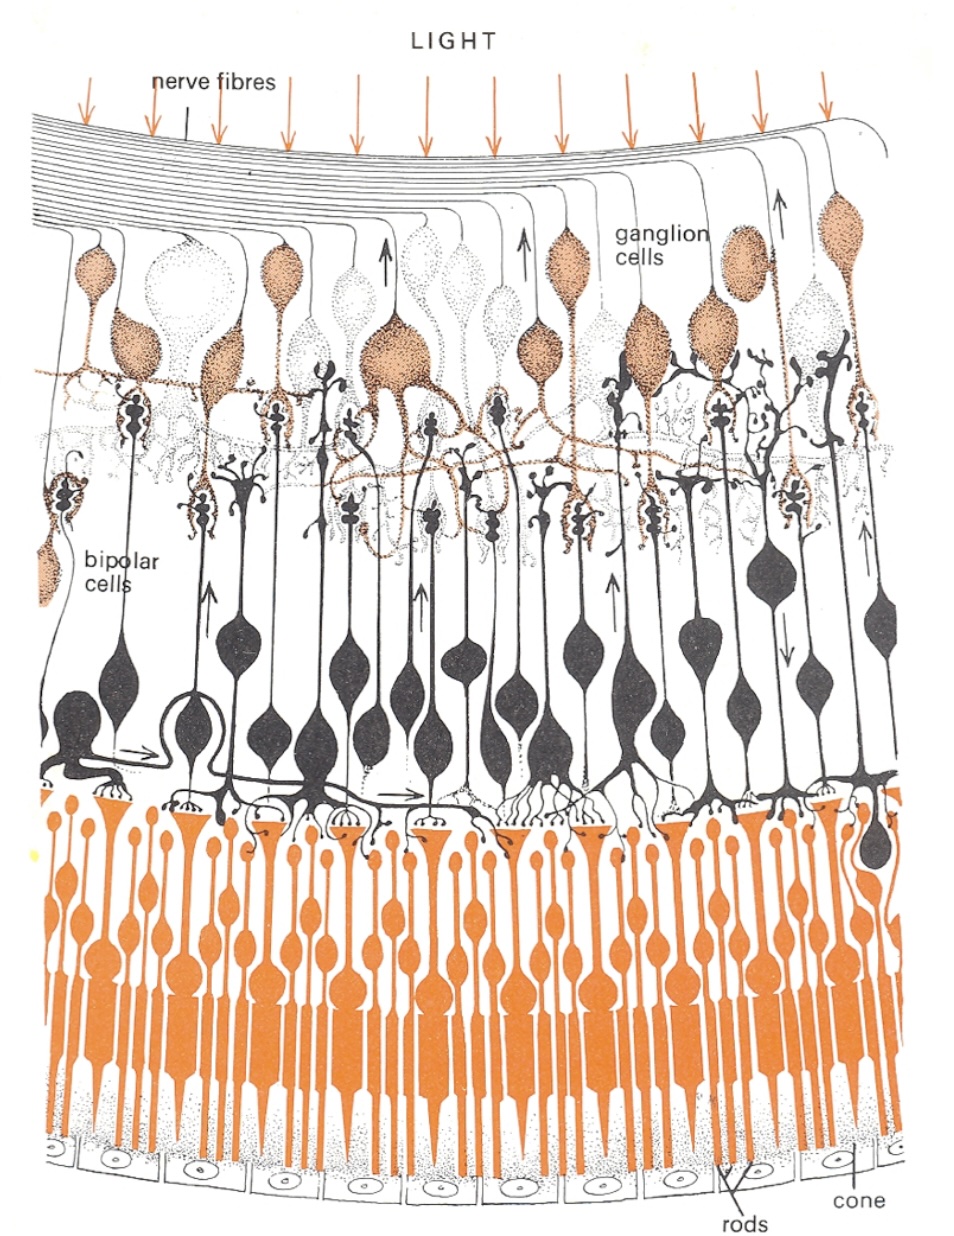
The Retina
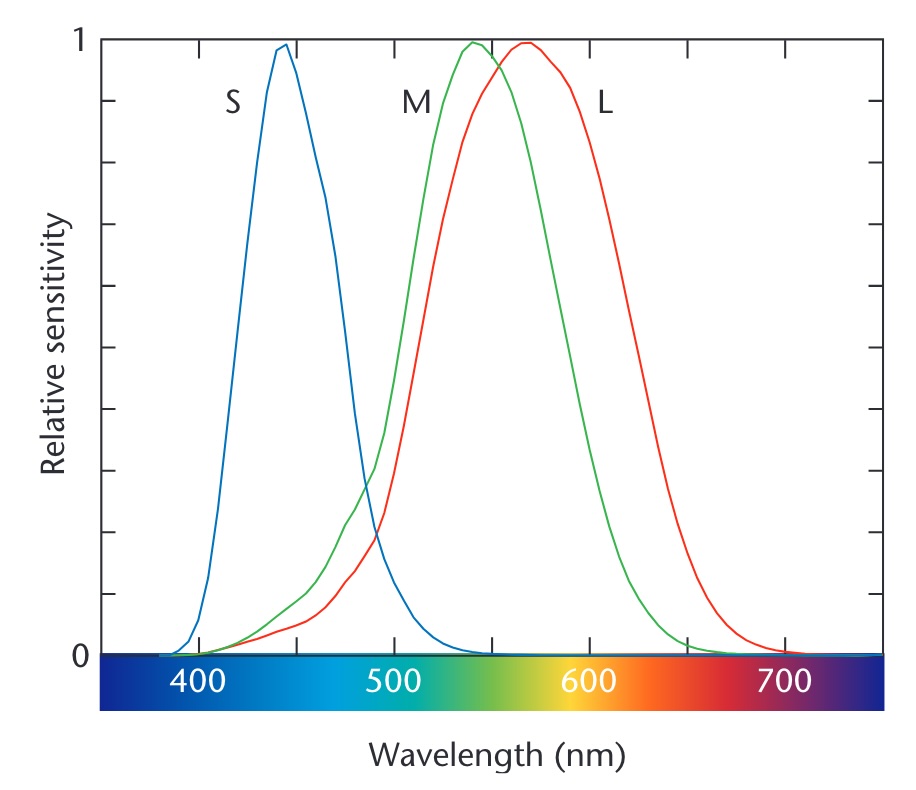
Cone Sensitivity
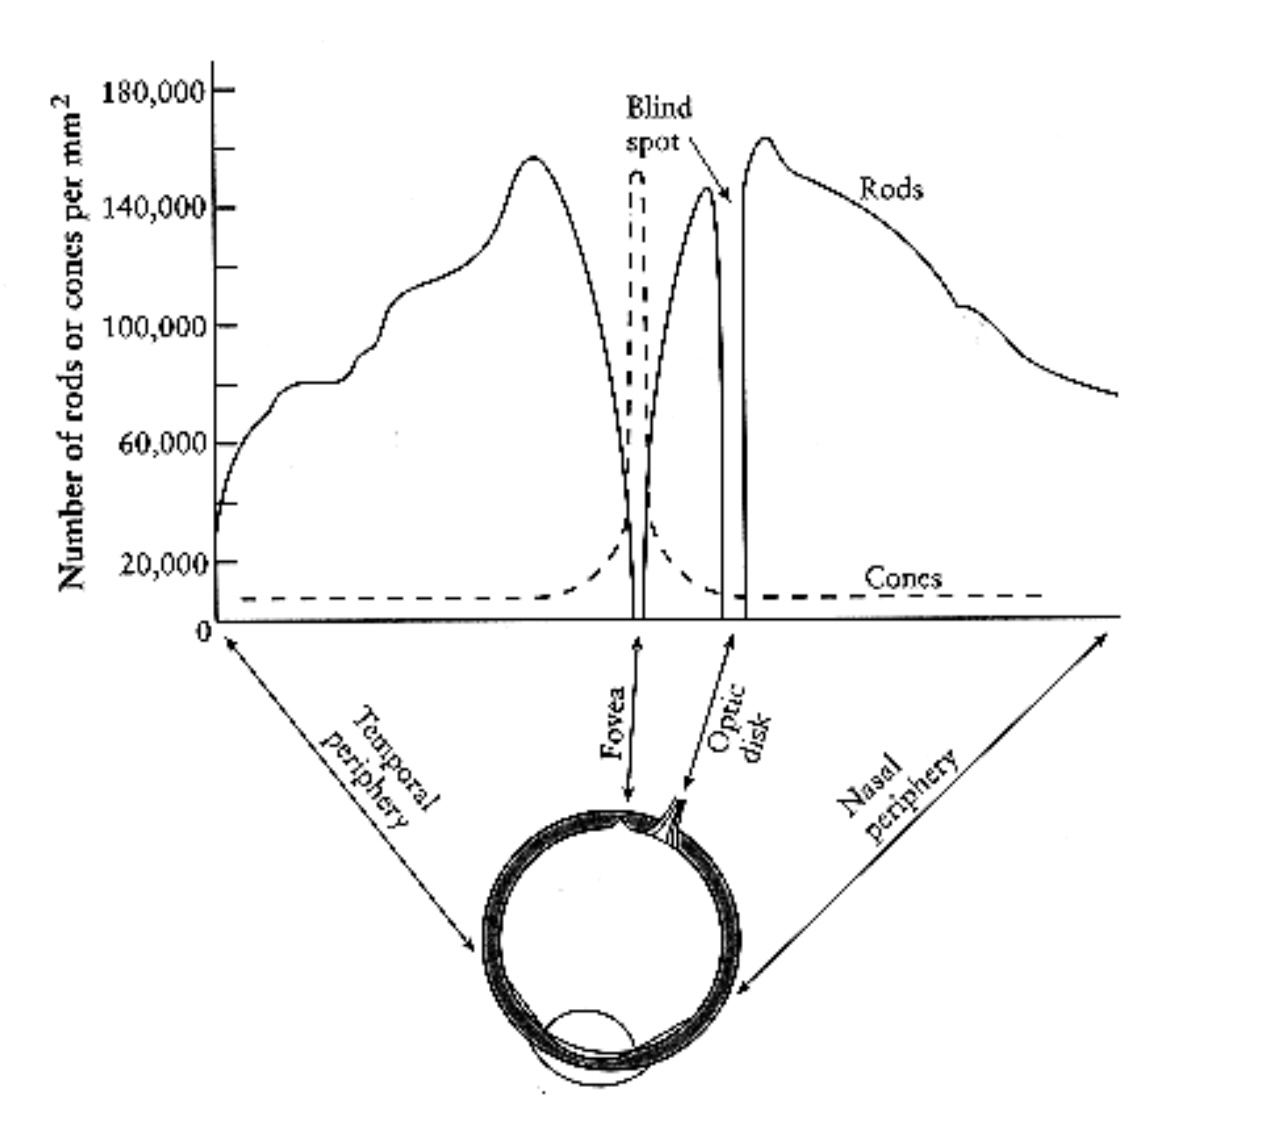
Density of Cones
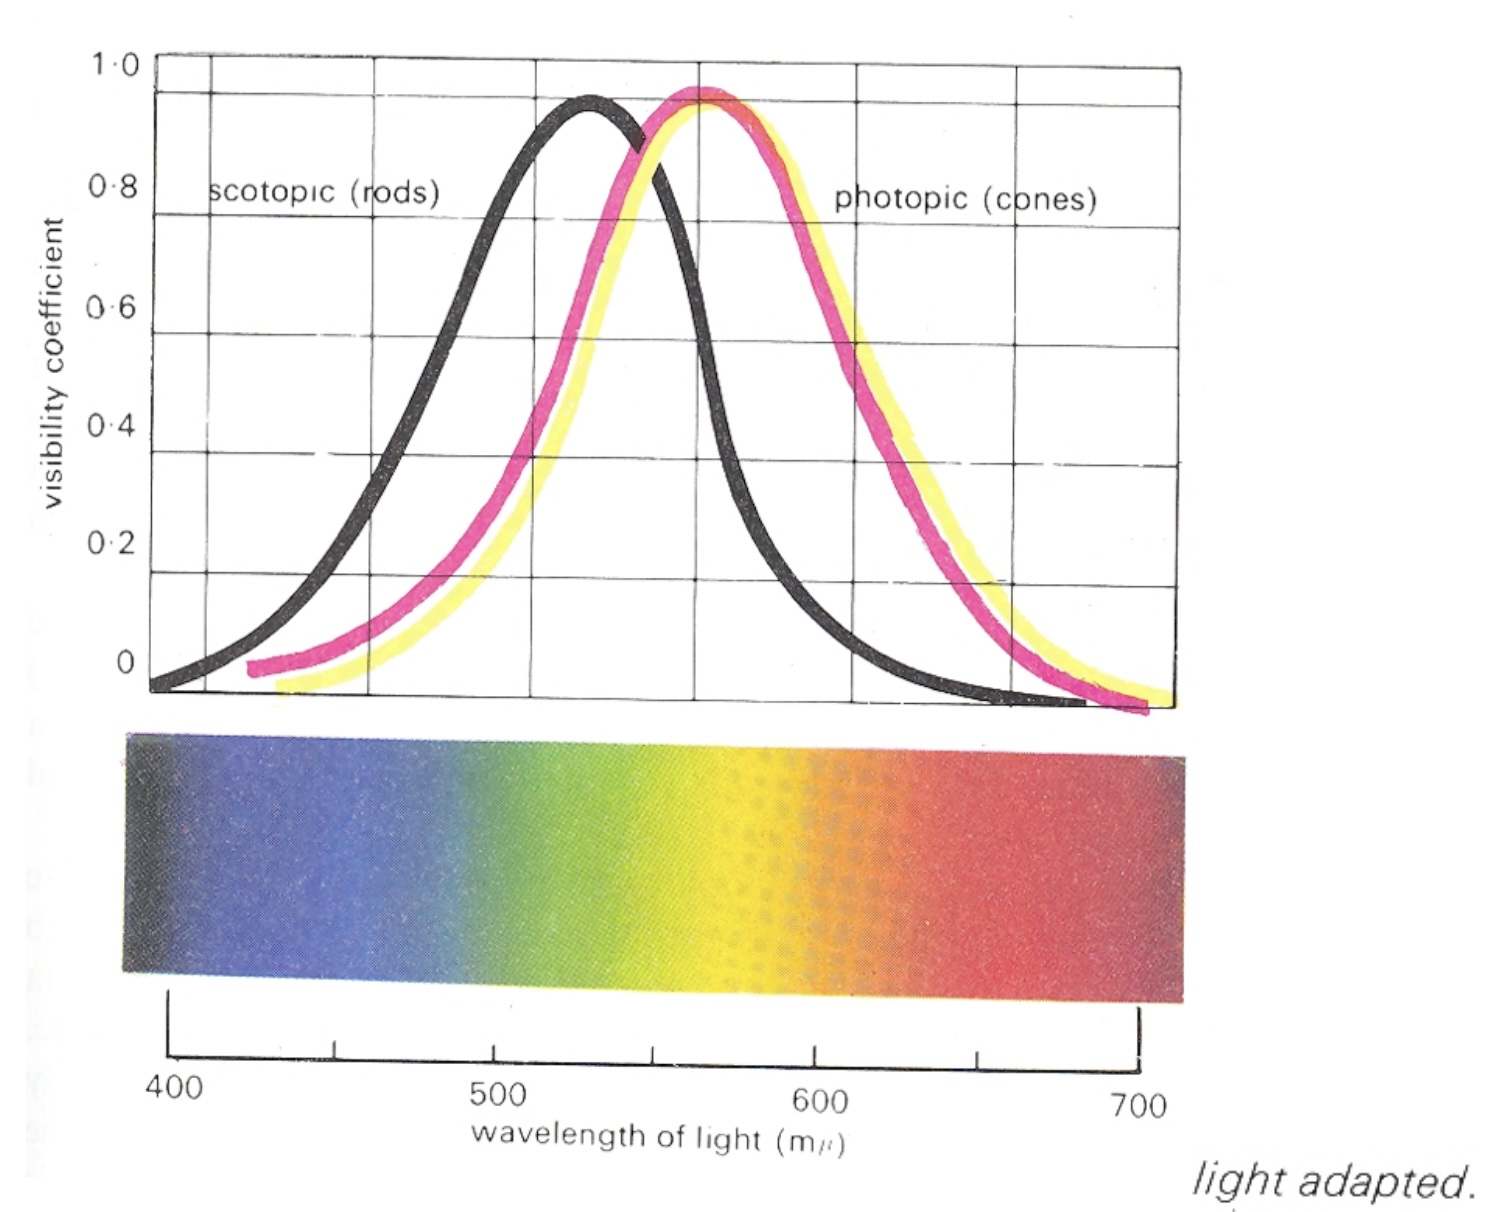
Cones and Rods
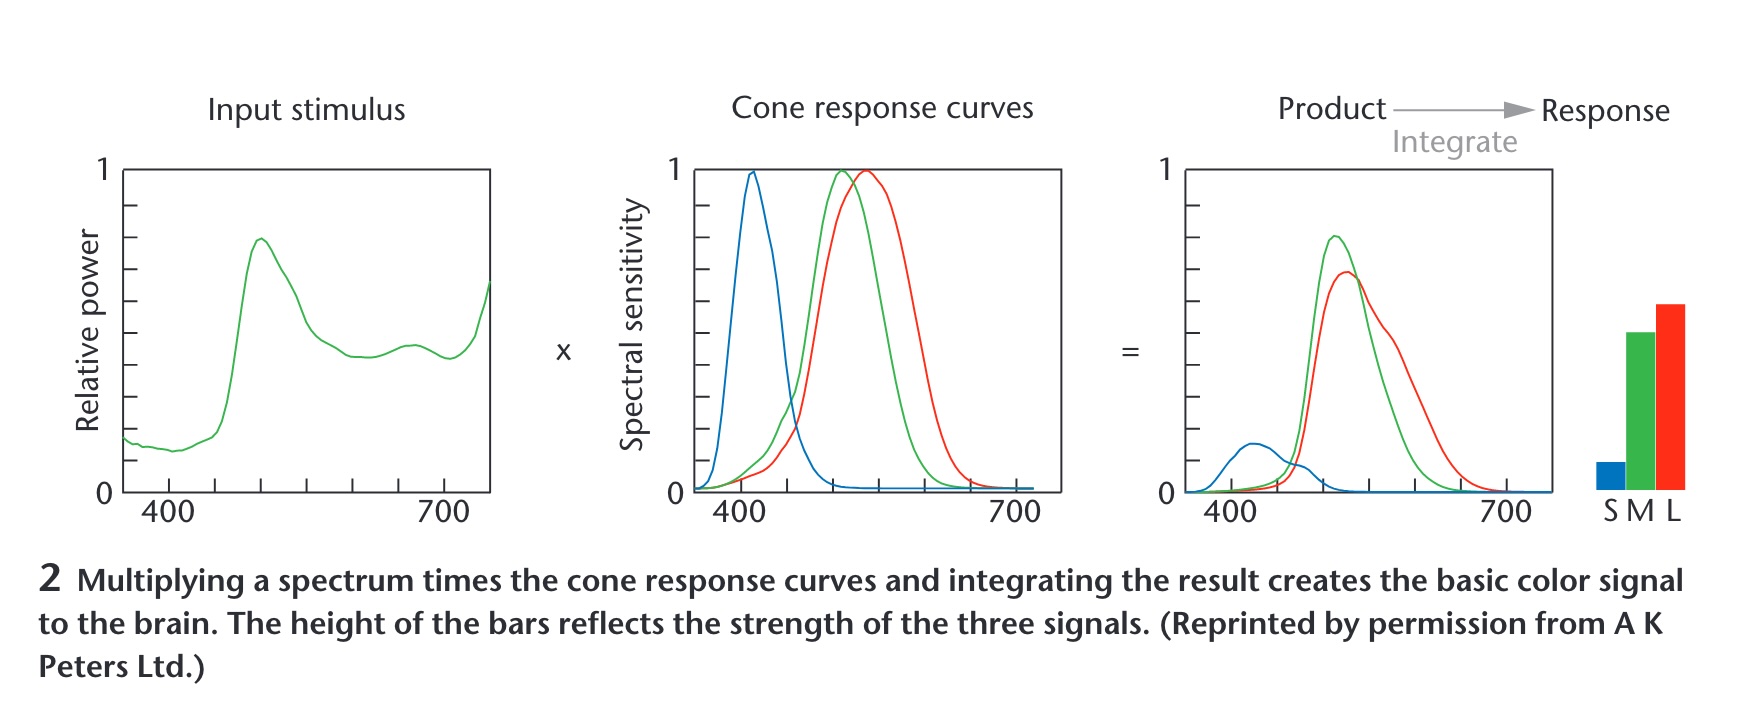
Color Stimulus
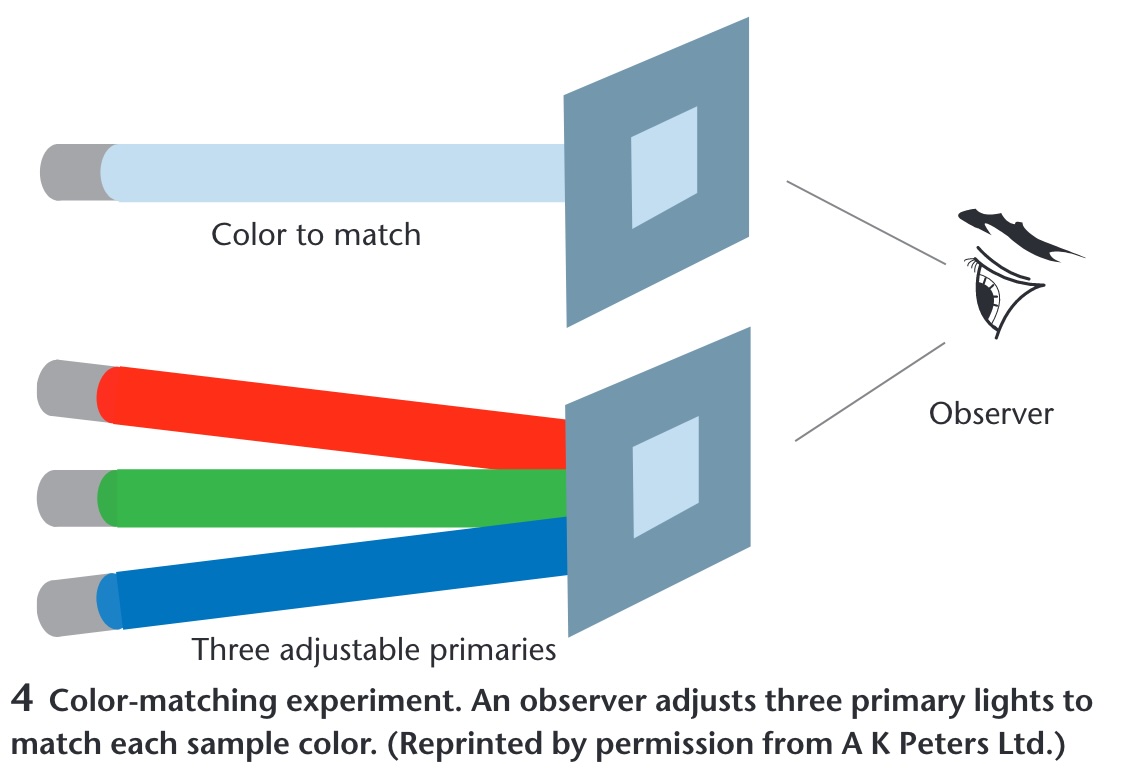
Color Matching Experiments
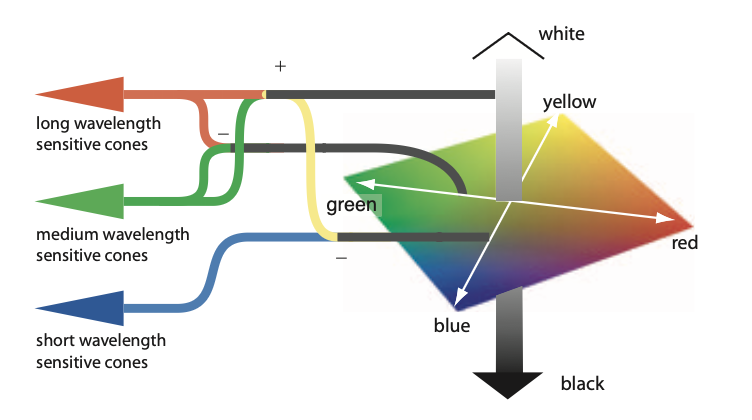
Opponent Process Theory
Three cone signals are re-coded into three opponent channels
Black ↔︎ White — luminance: L + M
Red ↔︎ Green — L - M
Blue ↔︎ Yellow — S - (L + M)
No “reddish green” or “bluish yellow”: each pair shares one channel
Afterimages appear in the opponent hue
Quantify

Label
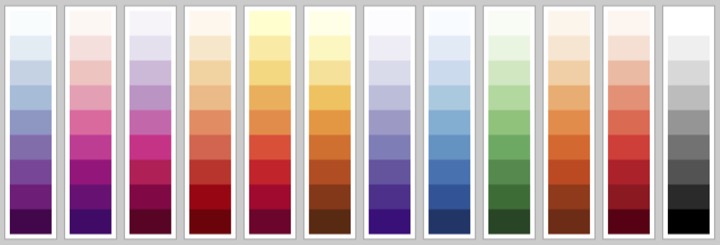
Single Hue Sequential Scales
- Choose one hue
- Map value to luminance
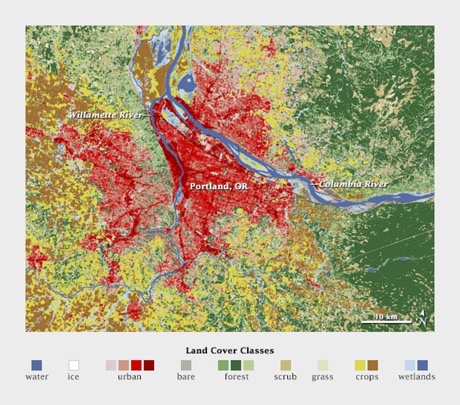
Categorical Color Scales
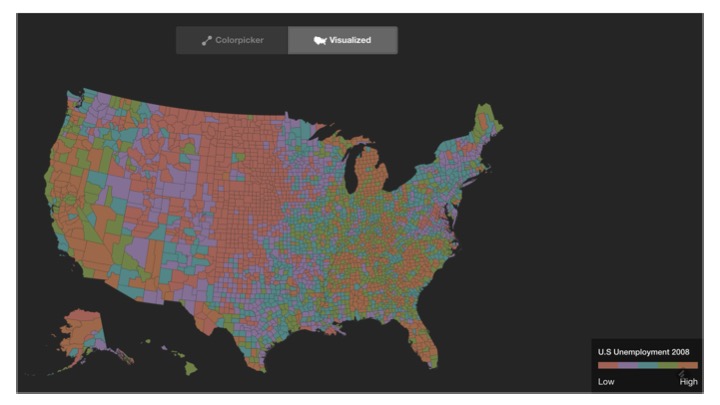
- Properties:
- Uniformity (uniform saliency / nothing stands out)
- Discriminability (as many distinct values as possible)
Diverging Color Scales
- Sometimes useful/necessary to distinguish values above and below a threshold.
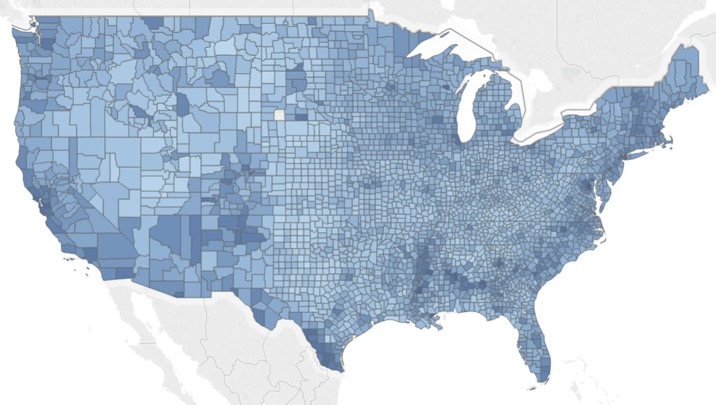

Created using these data: link
Color Blindness
- Missing or defective photoreceptors:
- 10% male and 1% female have some color deficiencies
Oliveira, Manuel. “Towards More Accessible Visualizations for Color-Vision-Deficient Individuals.” Comput. Sci. Eng., 2013.