White-box Model Interpretation
DS-GA 3001 - Fall 2026
2026-09-29
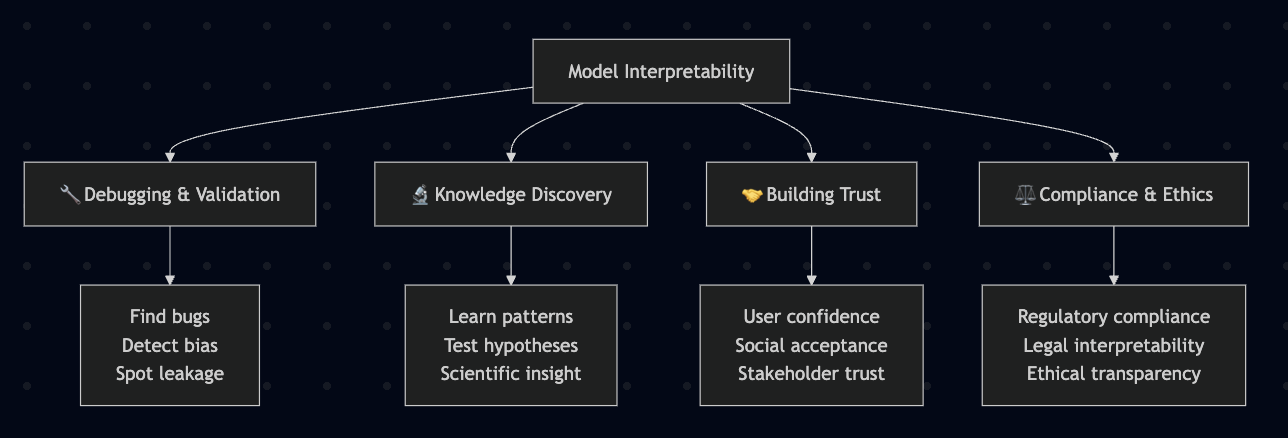
Why Model Interpretation & Explanation?
Four Key Functions:
🔧 Debugging & Validation
- Detect bugs, biases, data leakage
- Identify spurious correlations
🔬 Knowledge Discovery
- Learn patterns, generate hypotheses
- Extract scientific insights
🤝 Building Trust
- Increase confidence, social acceptance
- Enable stakeholder buy-in
⚖️ Compliance & Ethics
- Meet legal/ethical requirements
- Conduct fairness audits
Machine-learning-assisted materials discovery using failed experiments
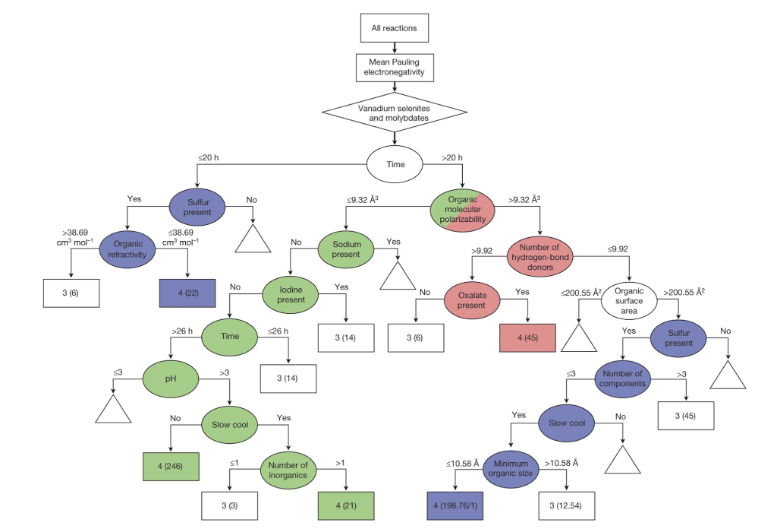
- Researchers firstly built a database of chemistry experiments (new material).
- Then they train an SVM to predict whether a new chemistry experiment will be successful.
- Then they train a surrogate DT to explain the model to learn more about the experiment.
Why Model Interpretation & Explanation?
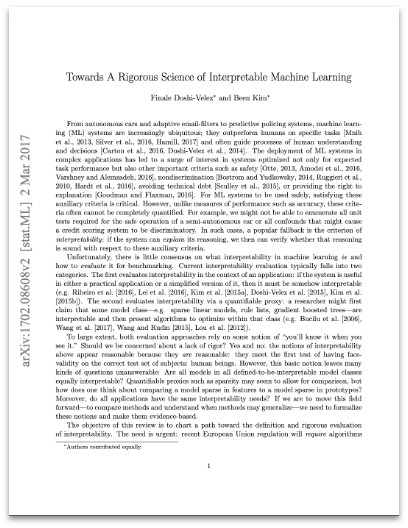
- Fairness
- Privacy
- Reliability or Robustness
- Causality
- Trust
Linear Regression
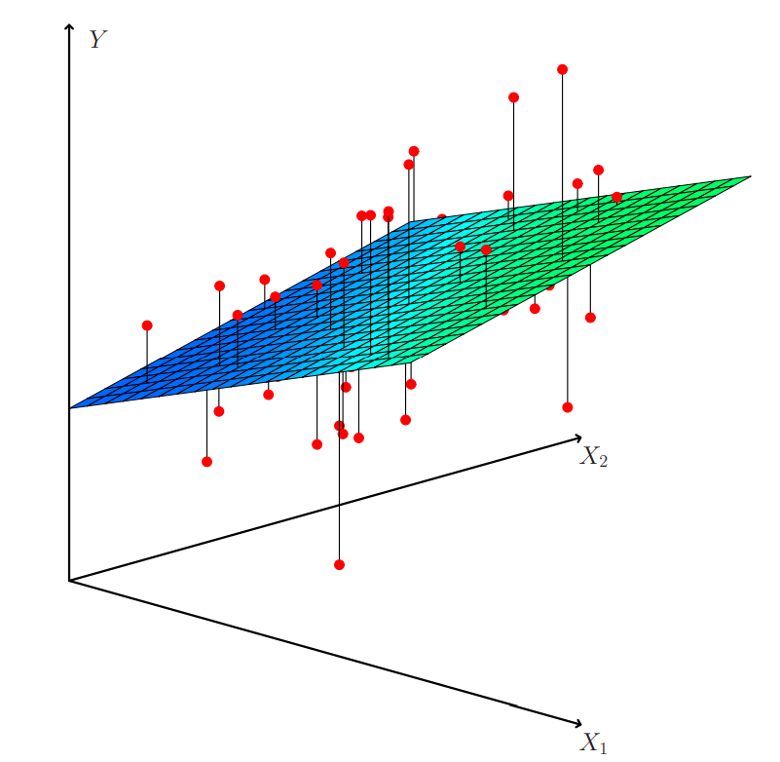
Linear Regression: An Example of Housing Price
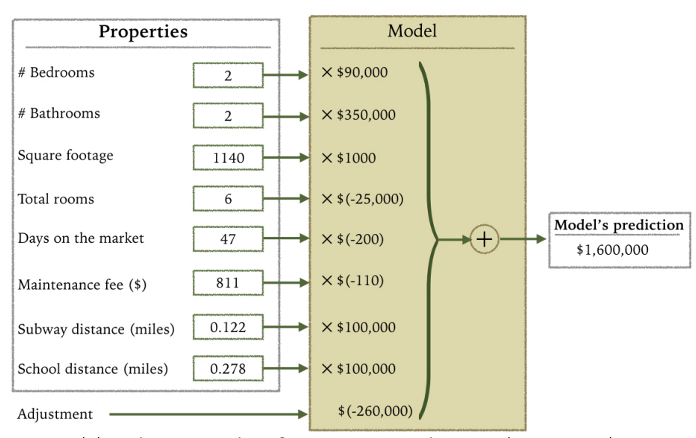
How do you interpret the influence of each property on the prediction of housing price?
Visual Analytics (VA) Systems for Linear Regression
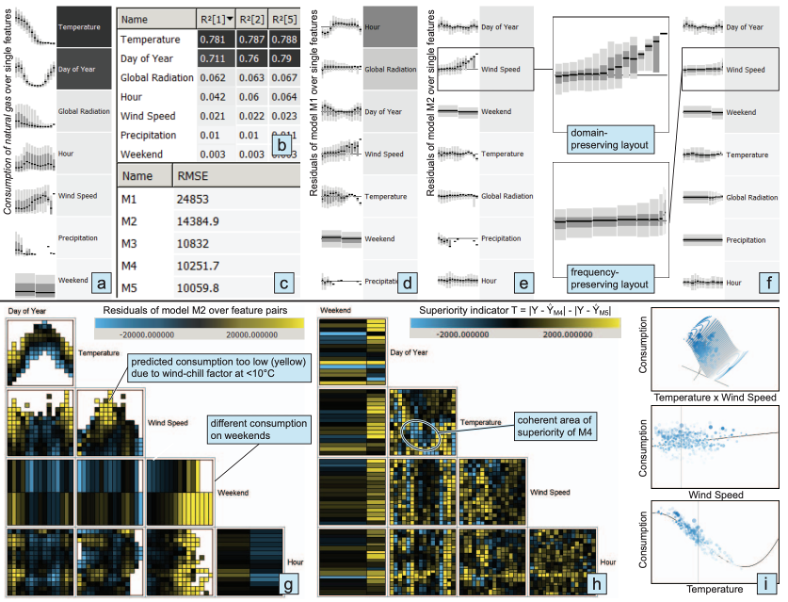
Core Visualizations:
- Scatterplot Matrix: Explore feature relationships and partitions
- Parallel Coordinates: Analyze high-dimensional patterns
- Interactive Partitioning: Split data to test model stability
Key Insights:
- Trade-off between model complexity and accuracy
- Feature ranking and selection
- Model validation across partitions
Generalized Additive Models (GAMs): An Example
\[\begin{equation} Wage = f(year, age, education) = b_0 + f_1(year) + f_2(age) + f_3(education) \end{equation}\]
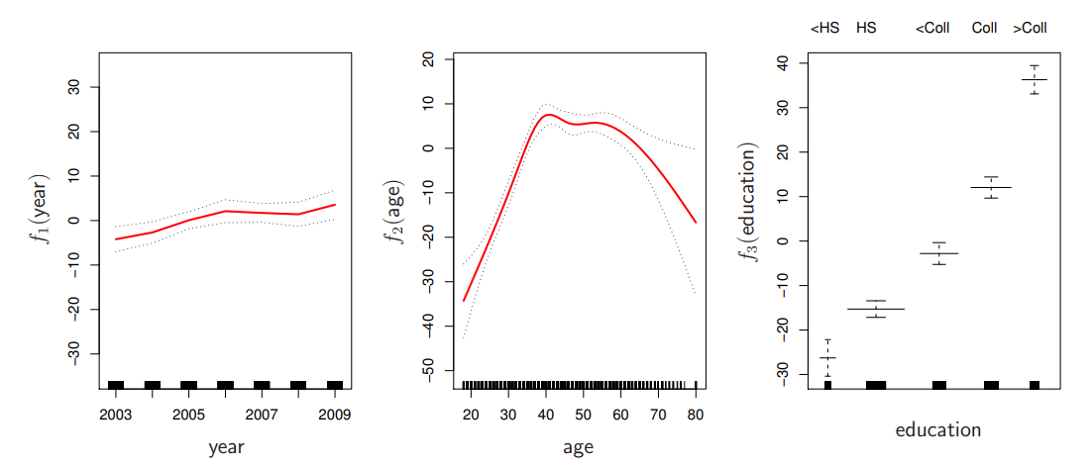
Partial Dependence Plots (PDPs)
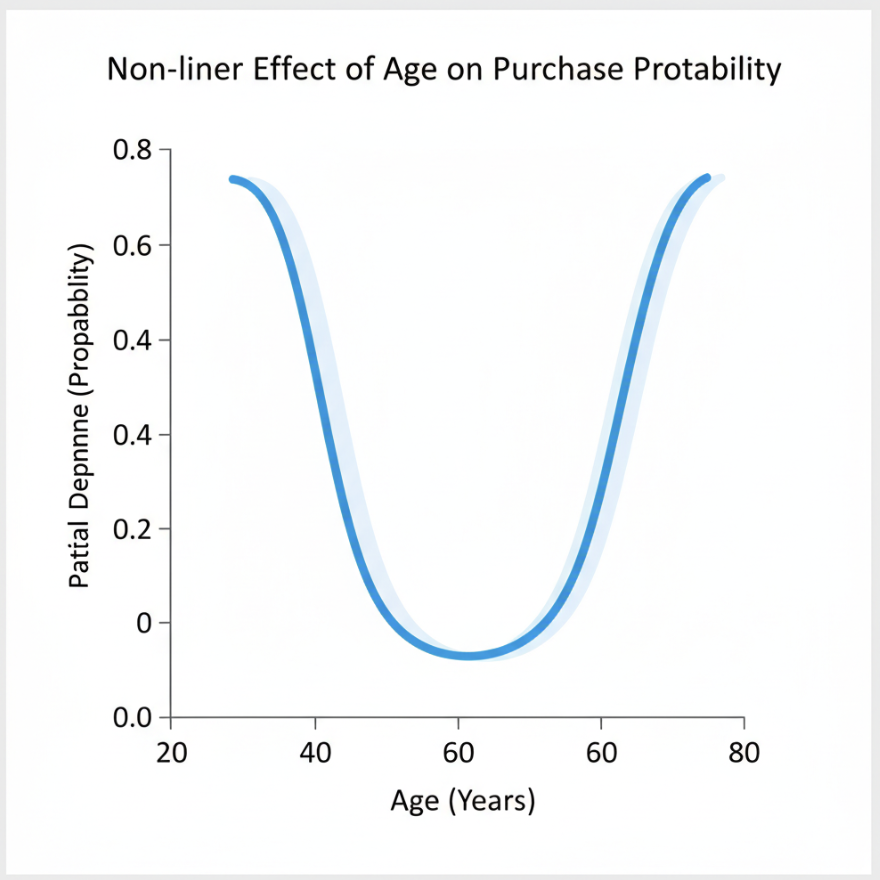
What PDPs show: The marginal effect of a feature on the predicted outcome
Mathematical idea: Average the model’s predictions across all data points while varying one feature
- Y-axis: Change in prediction (relative to baseline)
- X-axis: Feature values
- Curve shape: Reveals linear, monotonic, or complex relationships (U-shaped in example)
Visualizing EBMs (or GAMs)
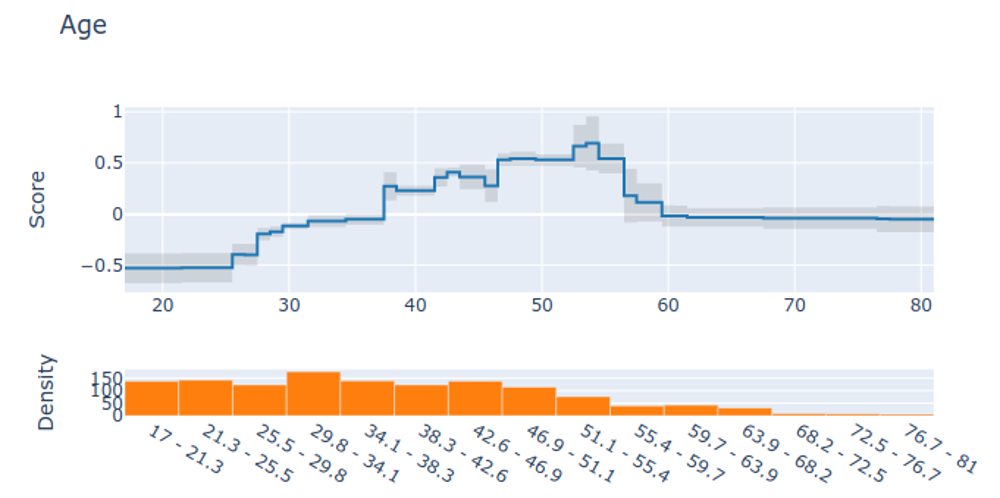
Partial dependency plot
Visualizing EBMs (or GAMs)
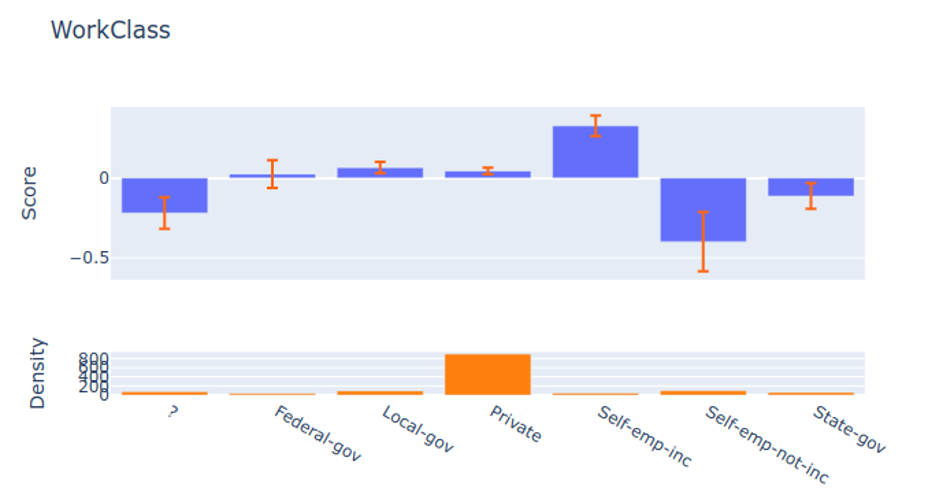
Partial dependency plot
Visualizing EBMs (or GAMs)
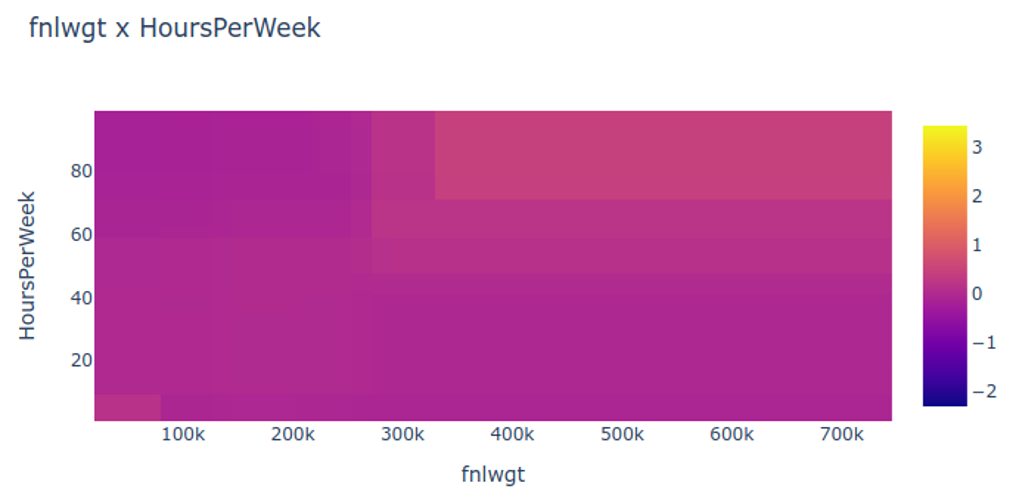
Partial dependency plot
Visualizing EBMs (or GAMs)
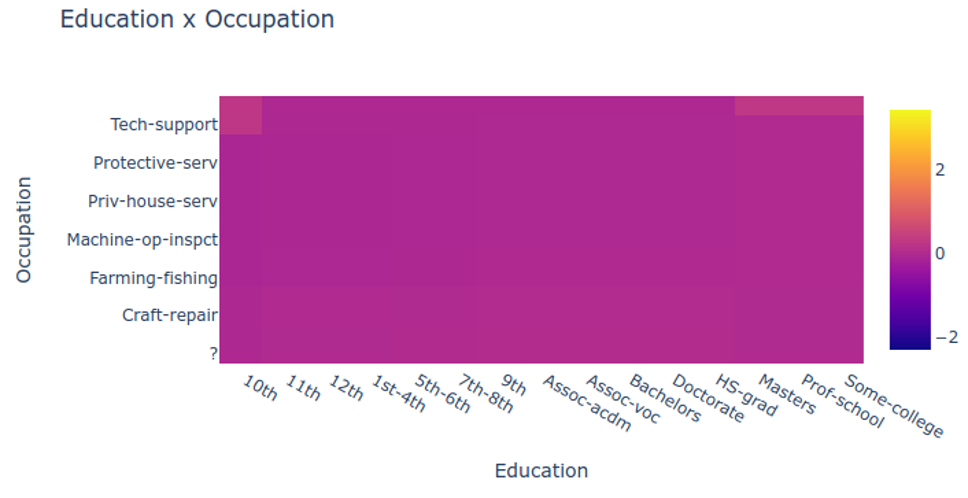
Partial dependency plot
Visual Analytics (VA) Systems Using GAMs
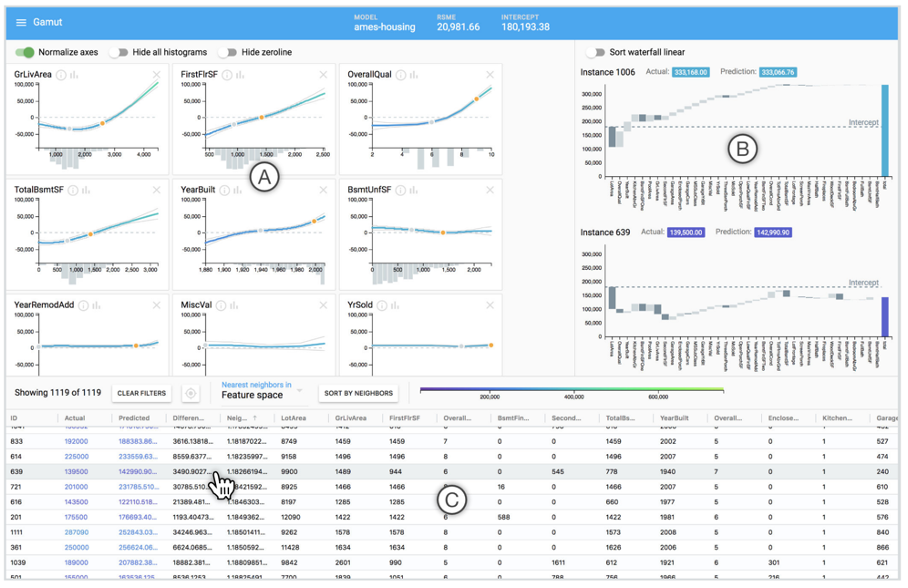
Visual Analytics (VA) Systems Using GAMs

GAM Changer: Injecting Domain Knowledge via Interactive Editing
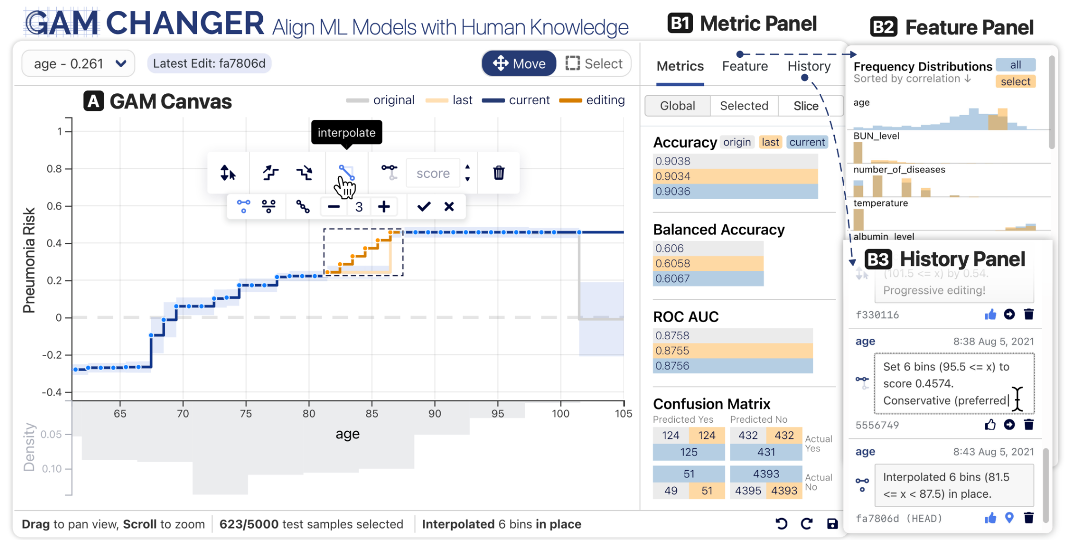
Human-in-the-Loop Features:
- Edit shape functions to encode domain knowledge
- Enforce monotonicity where business logic requires
- Smooth noisy patterns to improve generalization
- Real-time feedback on model performance
Key Innovation: Bridges data-driven learning with expert knowledge through interactive visualization
Decision Trees: How They Work
Decision trees recursively split data based on feature thresholds:
- Internal nodes: Tests on features
- Branches: Test outcomes (Yes/No)
- Leaf nodes: Final predictions
- Algorithm: CART
Prediction: Follow path from root to leaf
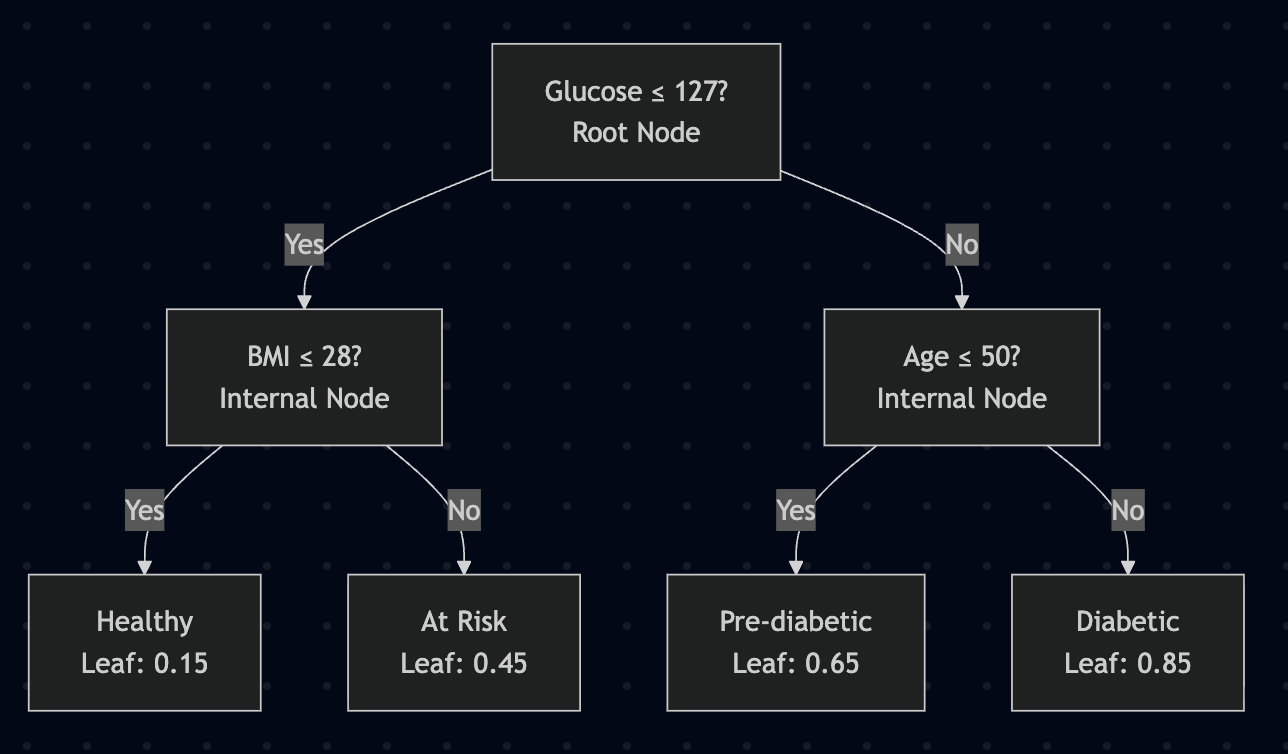
Example: 3 splits, 4 leaves, depth 2
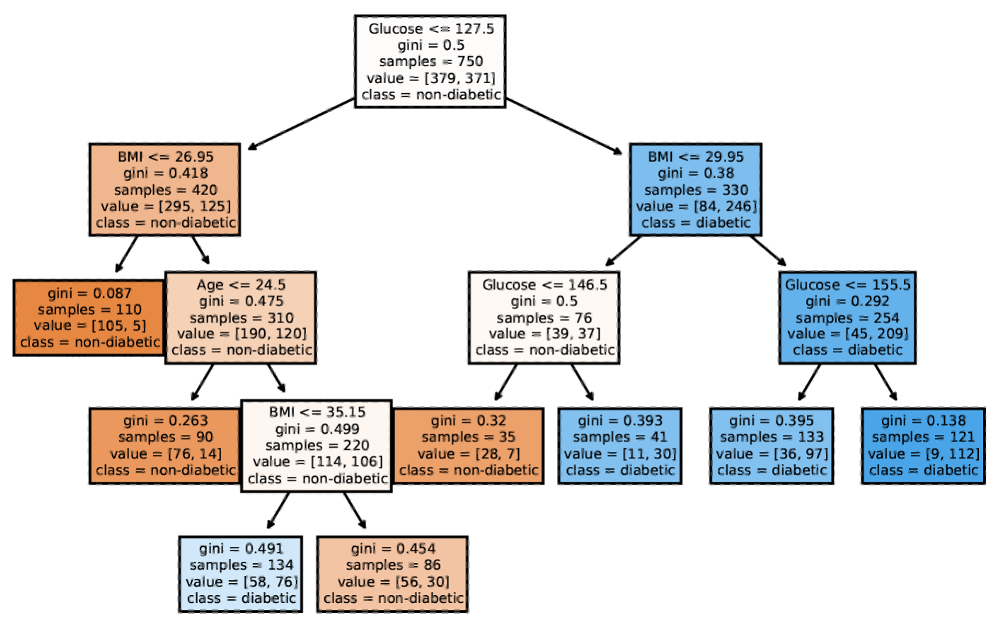
Tree-based Models: Example
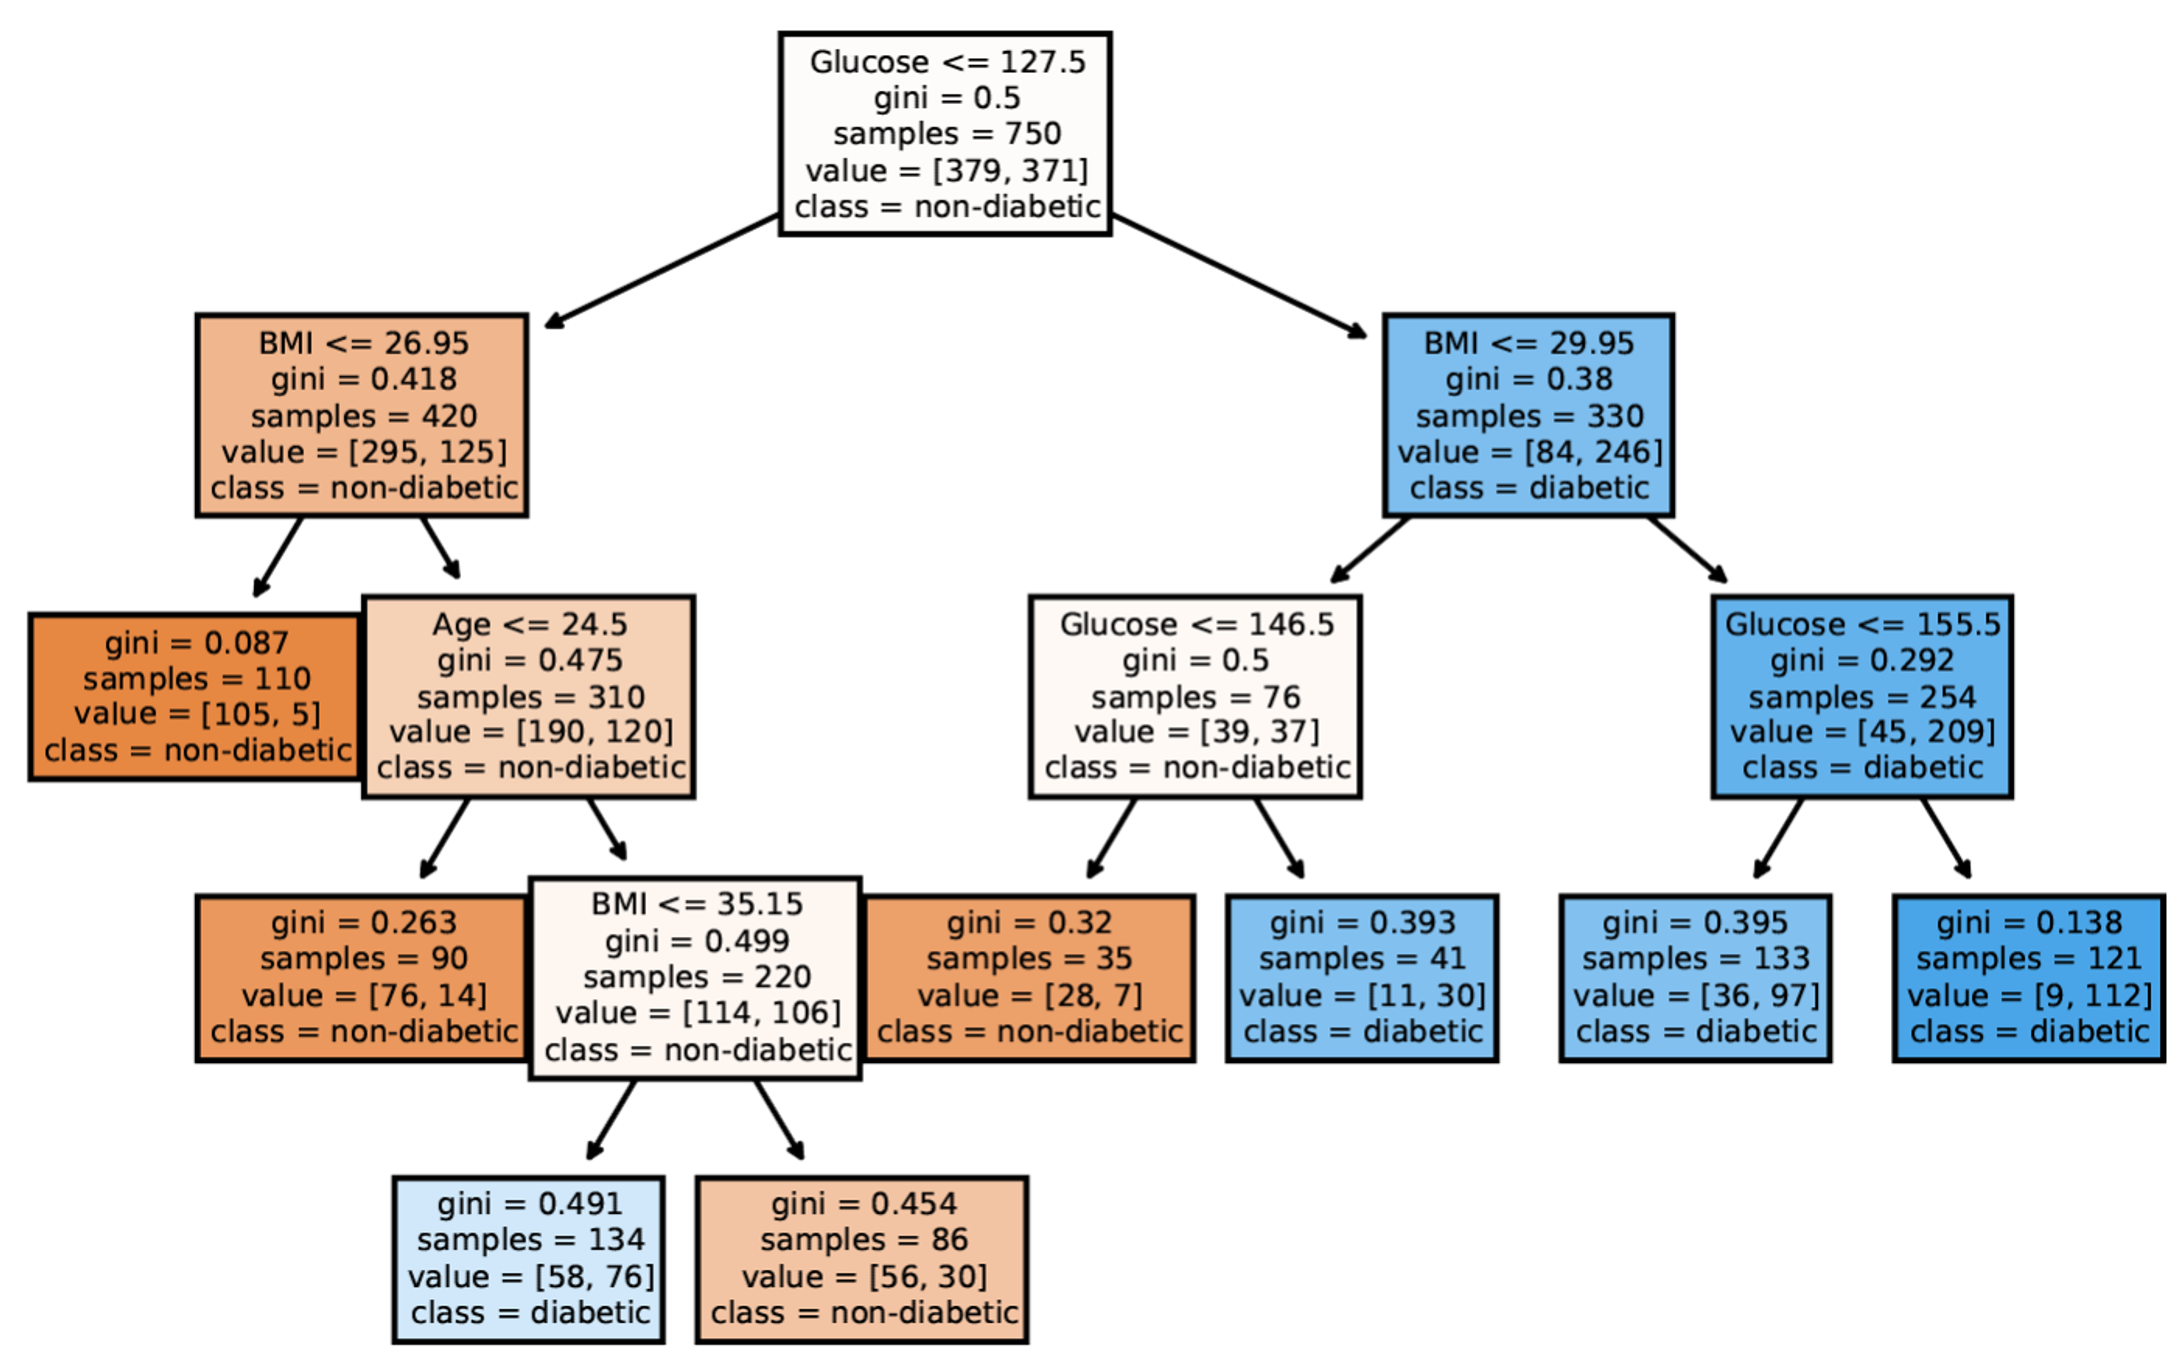
A decision tree of diabetes diagnosis
VA Systems Using Tree-based Models
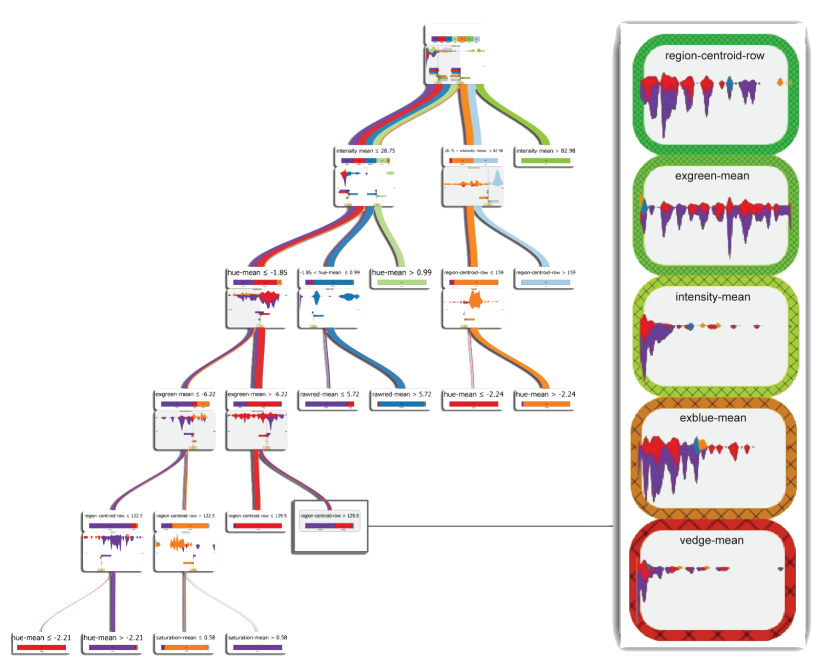
It shows the flow of different class, and the class distribution along the feature values.
VA Systems Using Tree-based Models
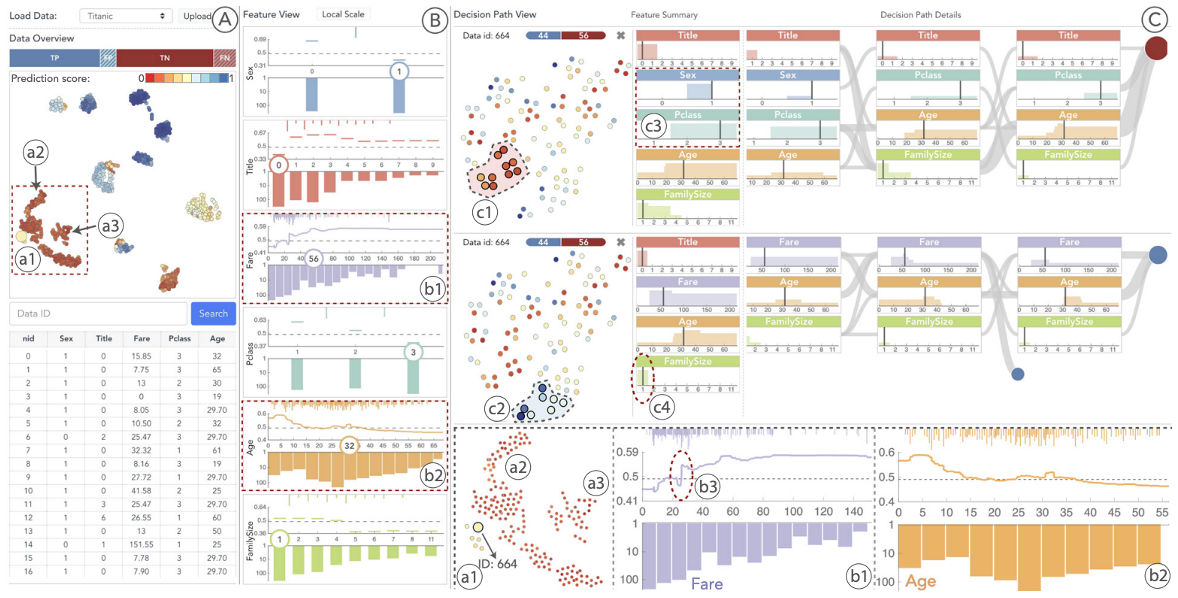
iForest
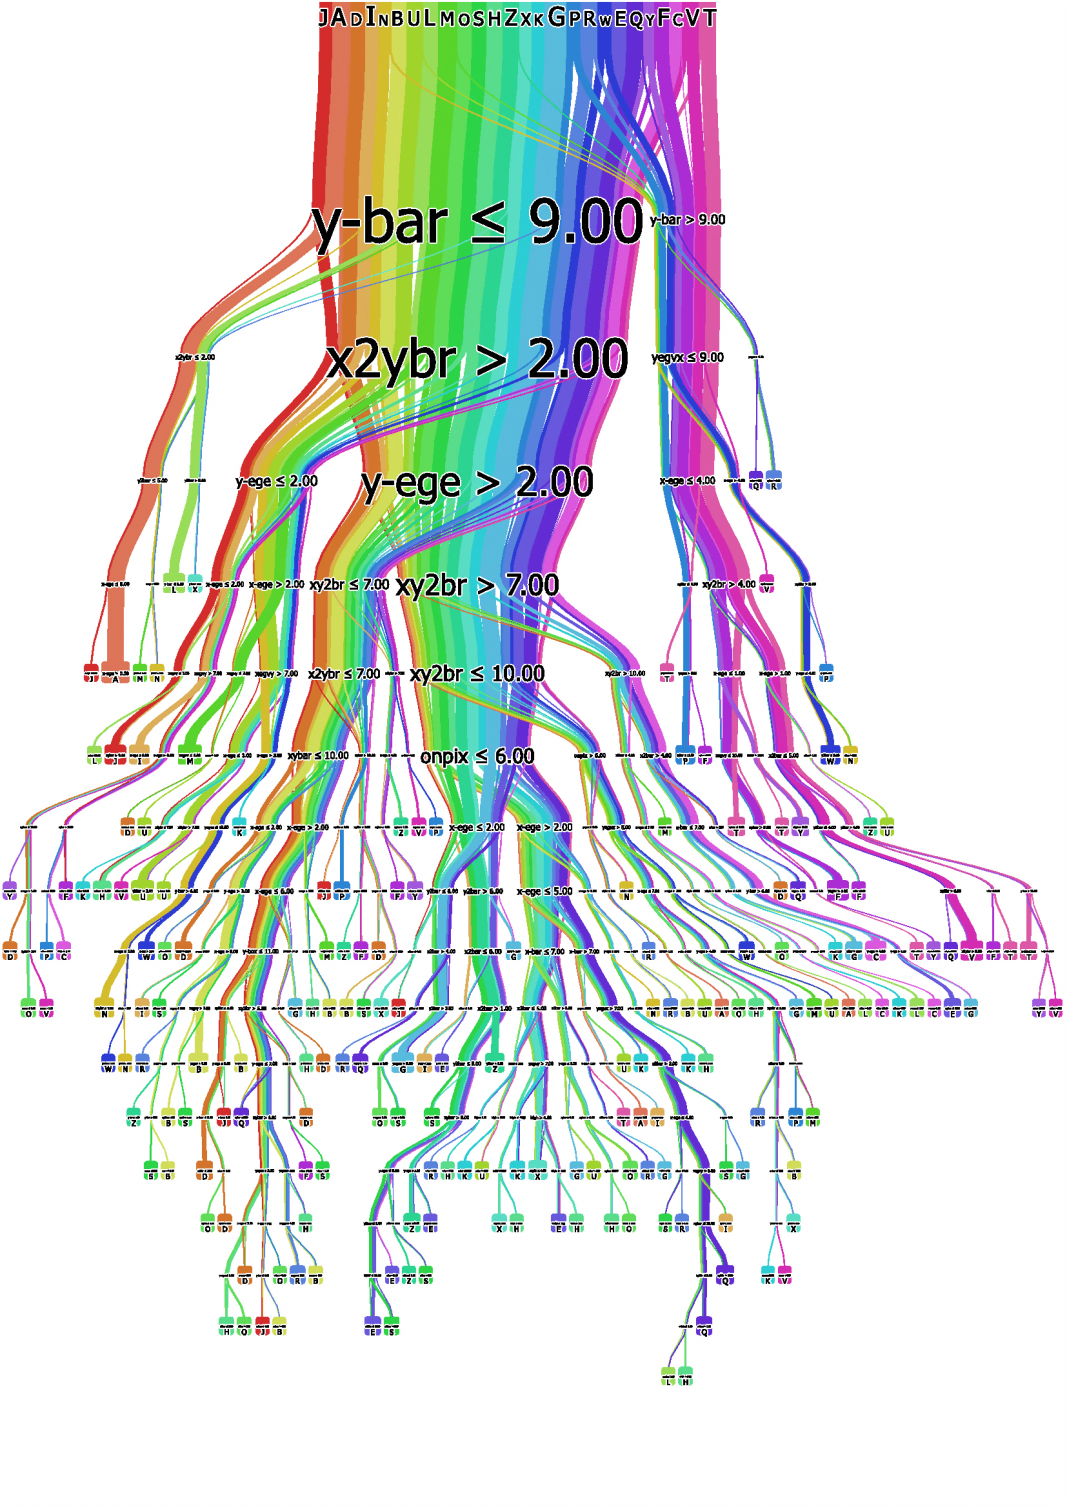
Interactive Construction and Analysis of Decision Trees
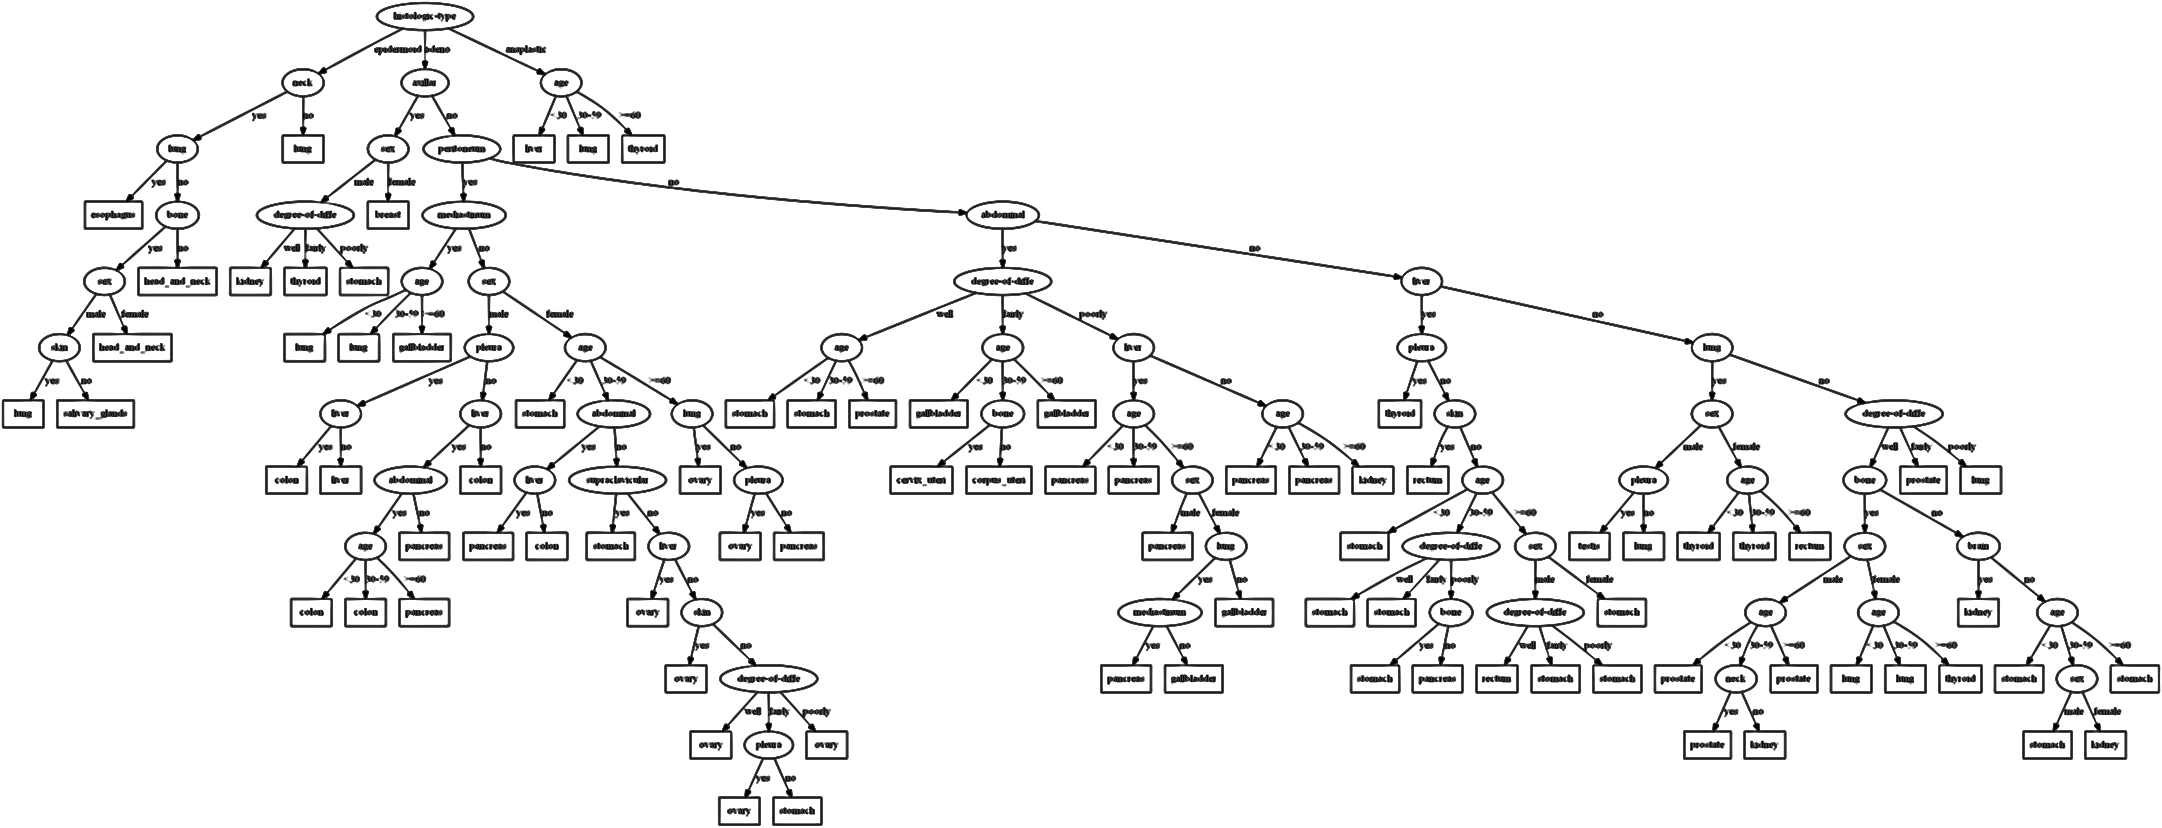
- Novel node-link visualization for very large decision trees
- Interactive construction: users can split nodes, prune branches
- Multiple views: overview, detail, rules
Interactive Construction: Colored Flow Visualization
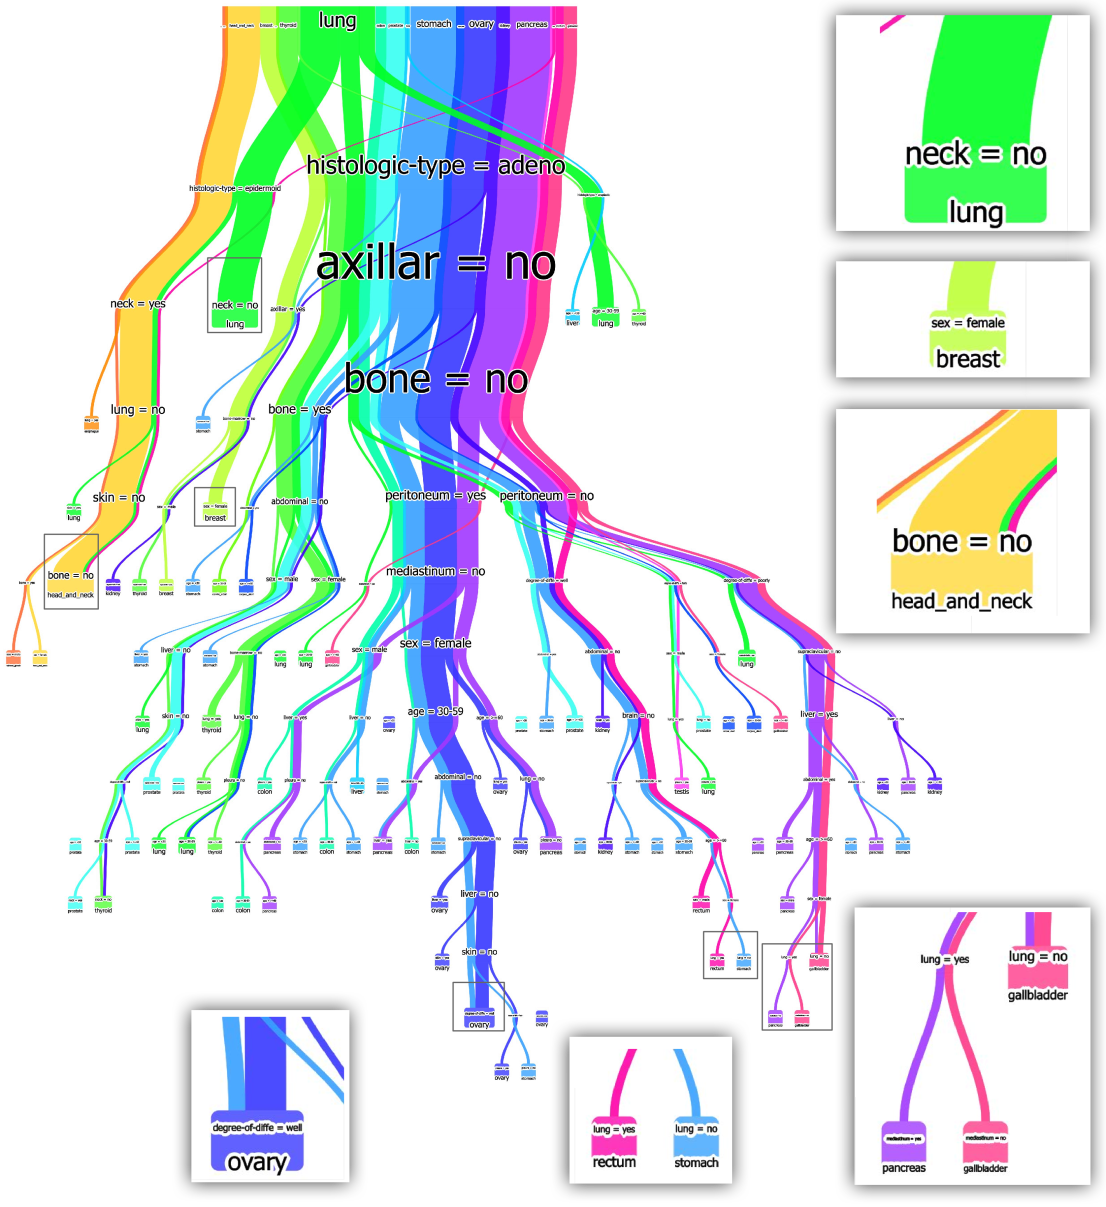
Decision paths colored by class and features
Interactive Construction: Rule Visualization
Decision rules with feature splits
Decision Rules: Different Structures
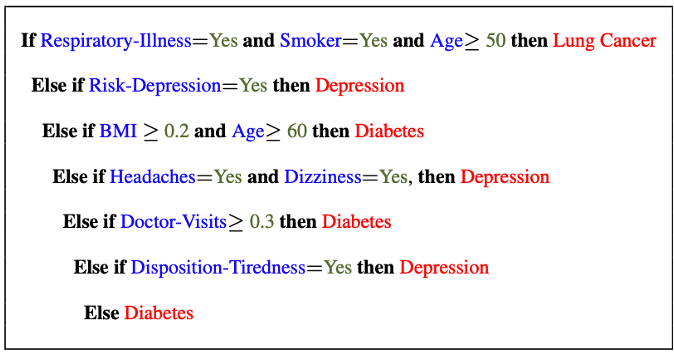 Clearly see how the decision is made and which rule is more important.
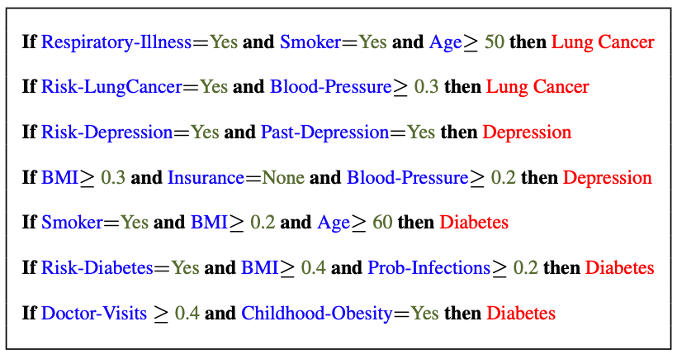
The final decision is made based on a voting mechanism.
A recent user study shows that “if-then structure without any connecting else statements enables users to easily reason about the decision boundaries of classes.”
Decision Rules: Different Structures
Disjunctive normal form (DNF, OR-of-ANDs) Conjunctive normal form (CNF, AND-of-ORs)
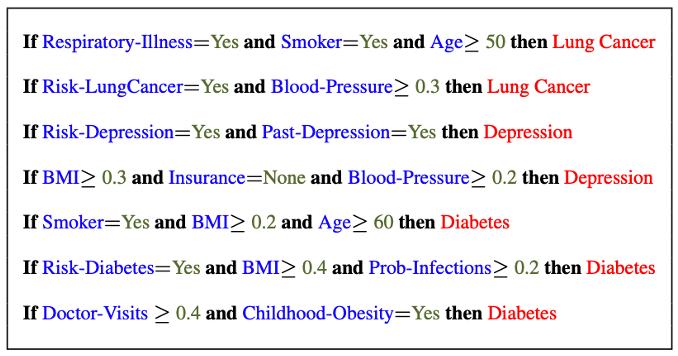
What form does this rule set follow?
Decision Rules: Visual Factors Influence Rule Understanding
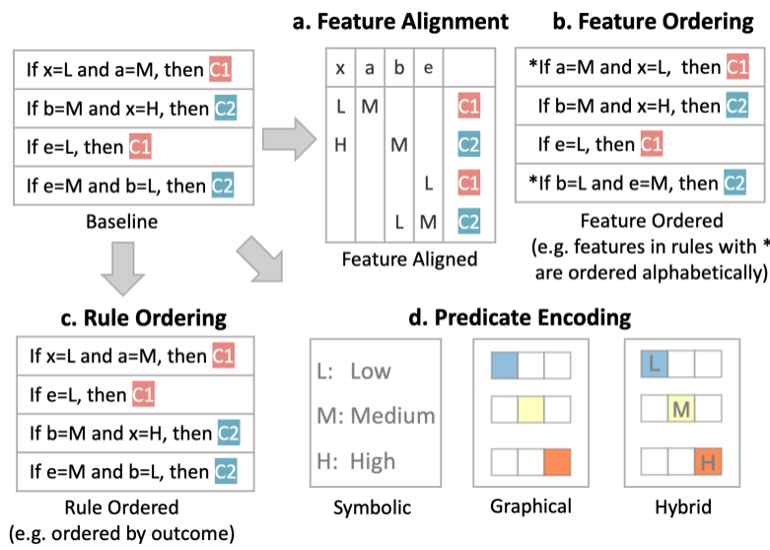
Research Questions:
Can different visualizations of rules lead to different levels of understanding?
What visual factors influence understanding and how do they affect rule comprehension?
Key findings: Visual encoding choices significantly impact interpretability
Global Surrogate
Imagine that we have a black-box model (too complex to understand the internal structure), can we use white-box models to help us understand the model behavior of the black-box model?
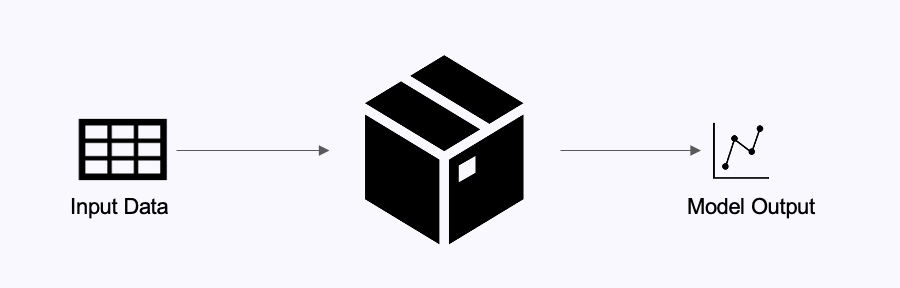
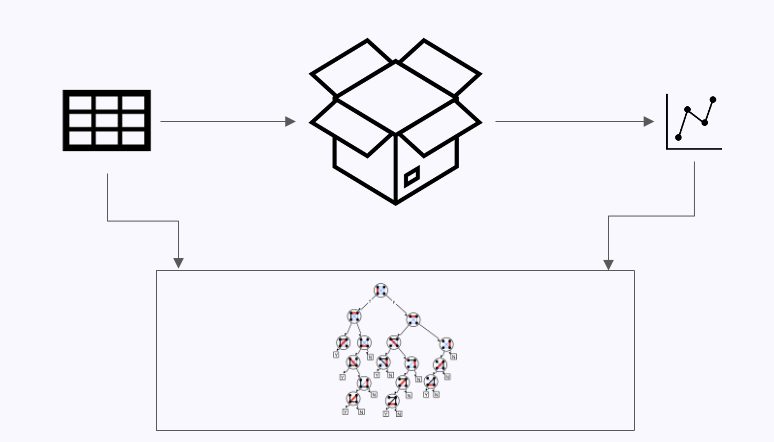
Global Surrogate
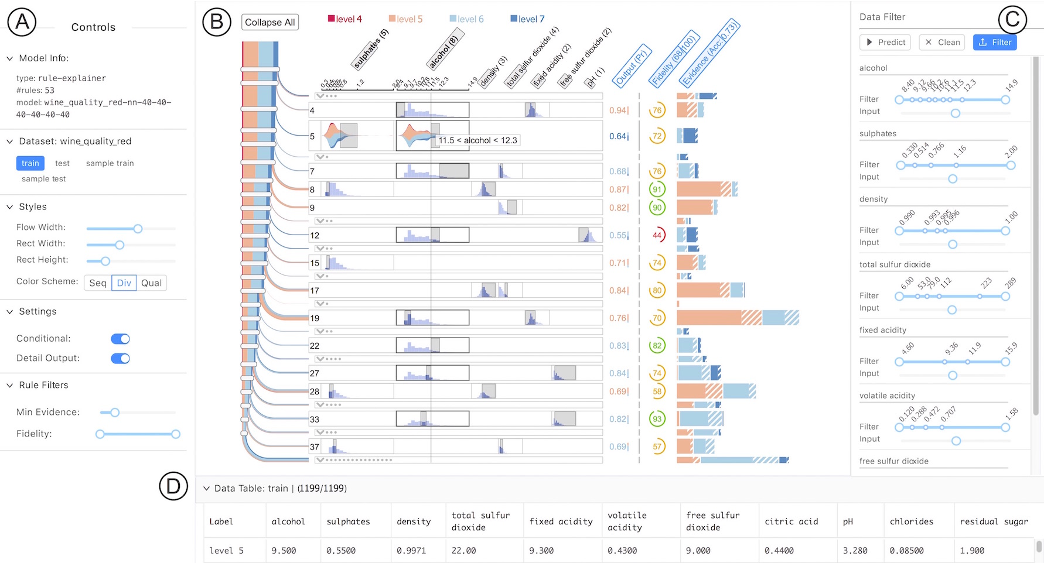
Open the black box by understanding a “surrogate model” that approximate the behavior of the original black-box model.
The Fidelity-Interpretability Trade-off
The Fidelity-Interpretability Trade-off: A fundamental challenge in XAI where increasing model interpretability often decreases fidelity to the original model’s behavior
What you want:
Simple, interpretable surrogate with high fidelity to the black-box model
What you get:

Either low fidelity (simple but inaccurate) or low interpretability (accurate but complex)
VA System for Rule List
RuleMatrix
VA Systems for Rules in Random Forest
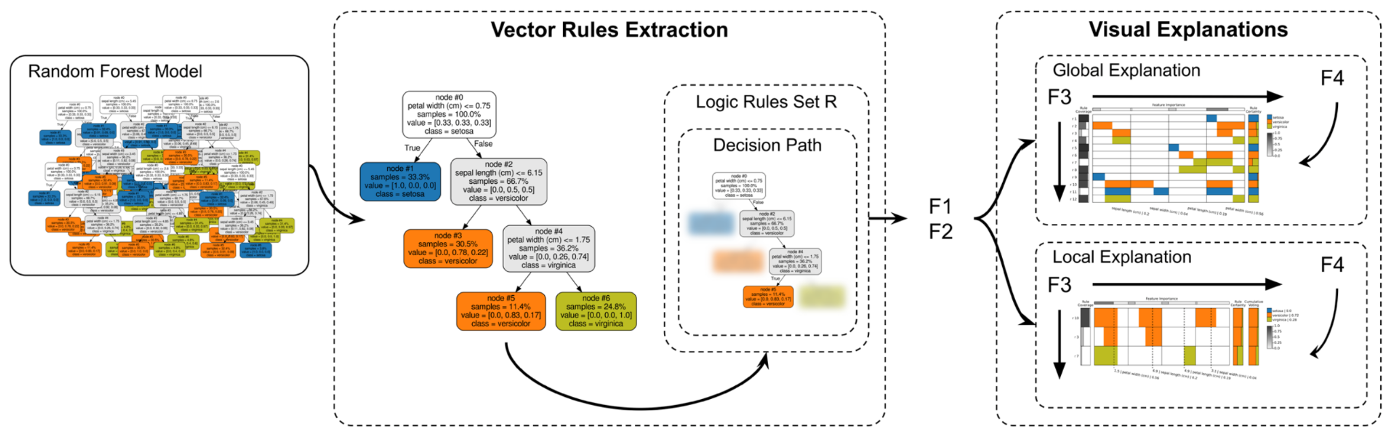
Explainable Matrix
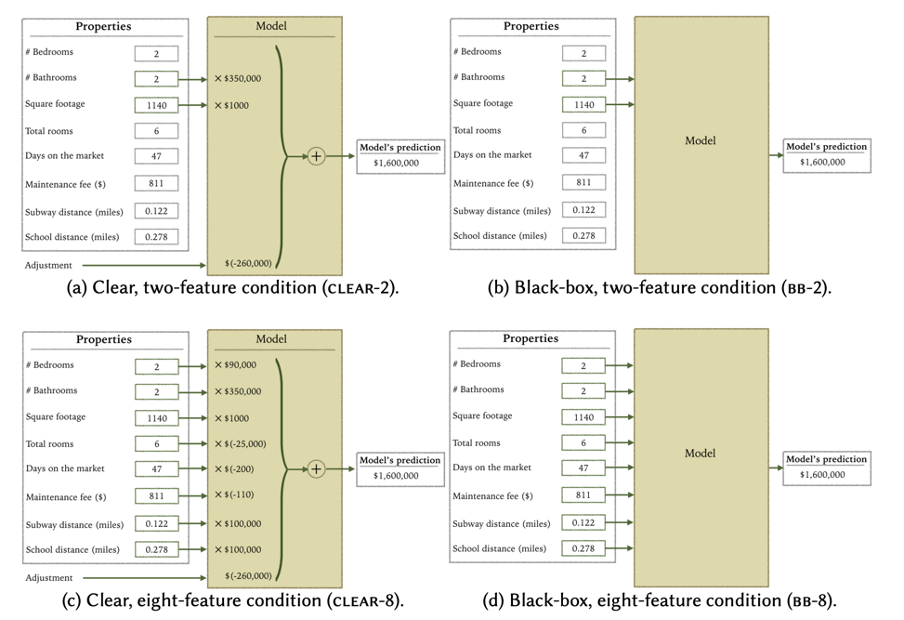
Manipulating and Measuring Model Interpretability
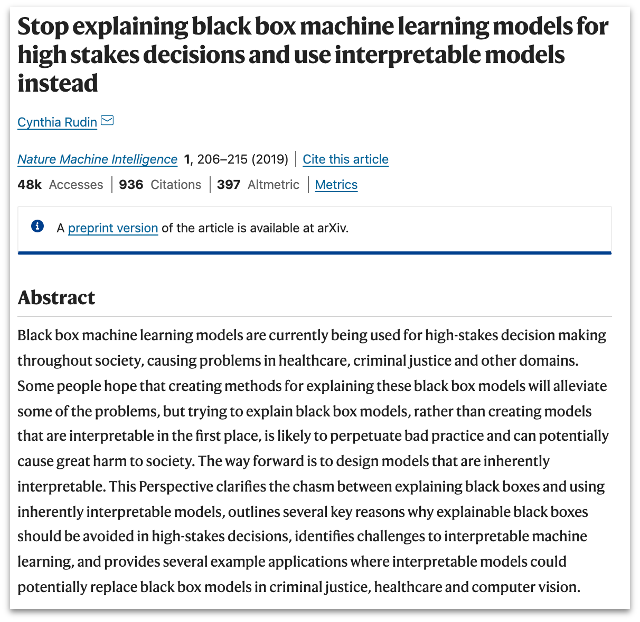
Stop explaining black box machine learning models for high stakes decisions
Slice Finder: Automated Data Slicing for Model Validation
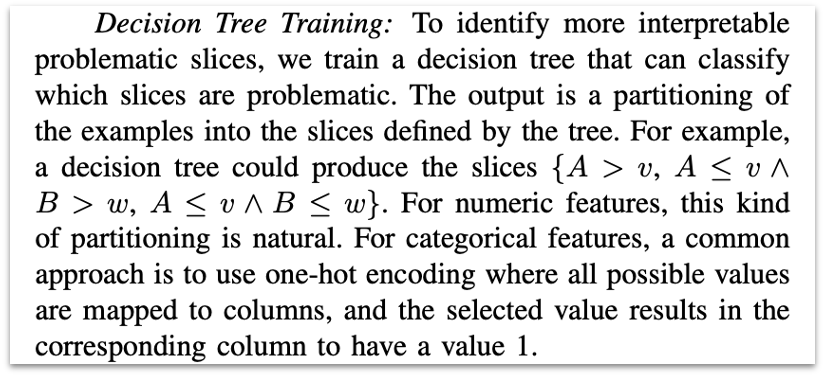
How about we use whether the model prediction is wrong or not to train a “surrogate tree”?