## L1 · Full-bleed figure — wide figures (AR ≥ 1.8), no body text 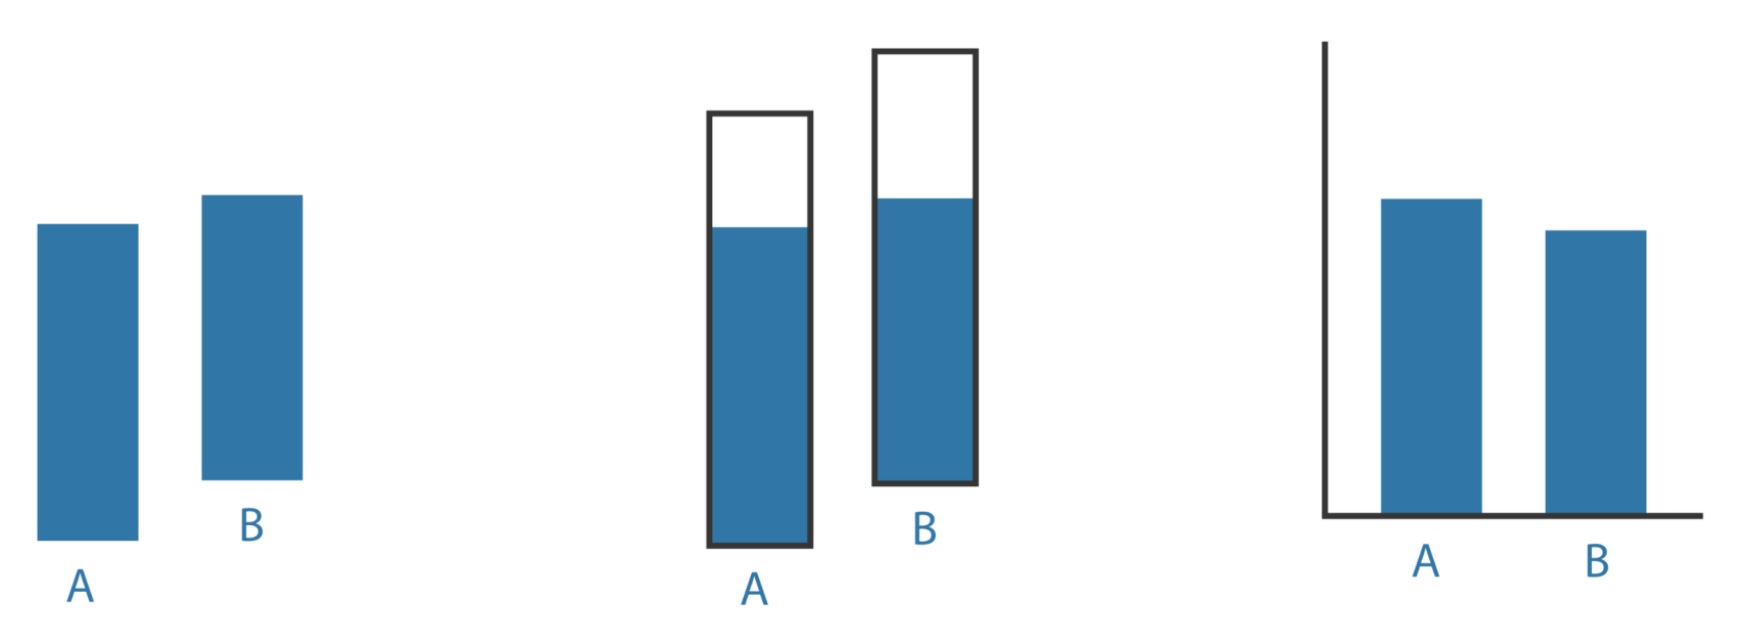{fig-align="center"} ::: footer L1 · one image, nothing else; Quarto auto-stretches it to the remaining height ::: ## L2 · Statement + figure — wide/landscape figure, ONE line of text **Visual thinking is a series of acts of attention, eye movements, and pattern finding.** 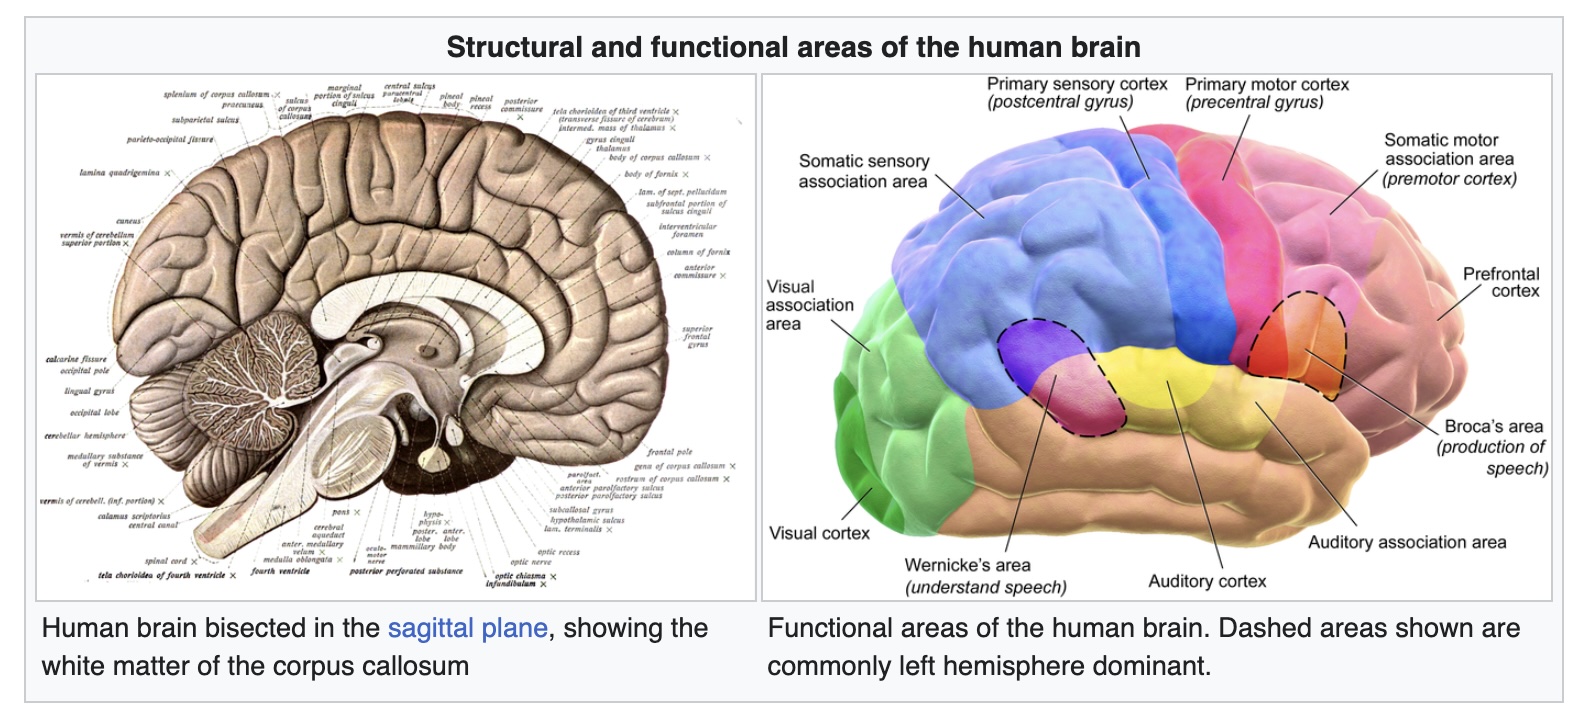{fig-align="center"} ::: footer L2 · exactly one bold line above; everything else goes to speaker notes ::: ## L3 · Text beside figure — square/tall figure with bullets (40 / 60) :::: {.columns} ::: {.column width="40%"} * We complete incomplete shapes * Implication: a visualization can mislead by accident * Conversely: a sparse set of marks is enough to carry a trend ::: ::: {.column width="60%"} {height="760" fig-align="center"} ::: :::: ::: footer L3 · height="760" caps the figure whatever its shape; columns disable auto-stretch ::: ## L4 · Centred figure — square figure, no text worth a column 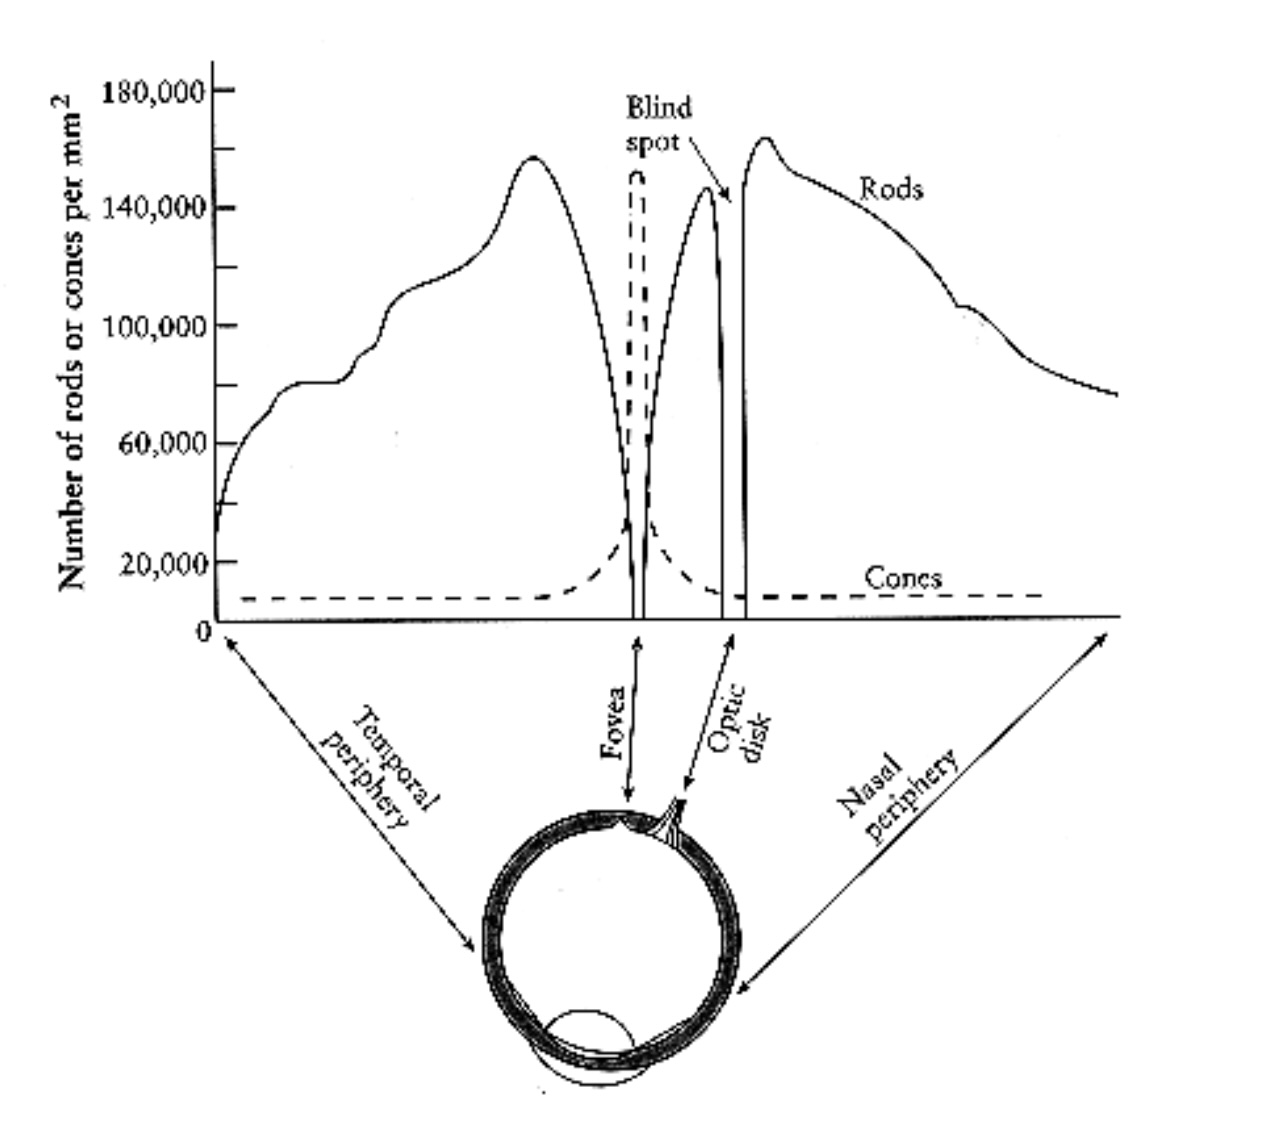{.nostretch width="50%" fig-align="center"} ::: footer L4 · .nostretch is required, otherwise width= is overridden at runtime ::: ## L5 · Comparison — two figures, one caption :::: {.columns} ::: {.column width="50%"} 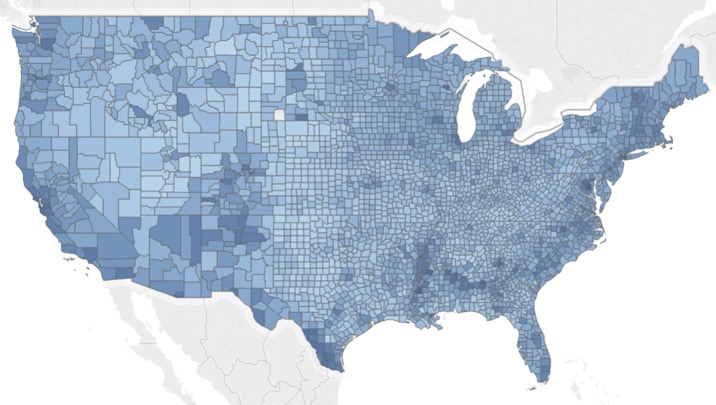{width="100%"} ::: ::: {.column width="50%"} 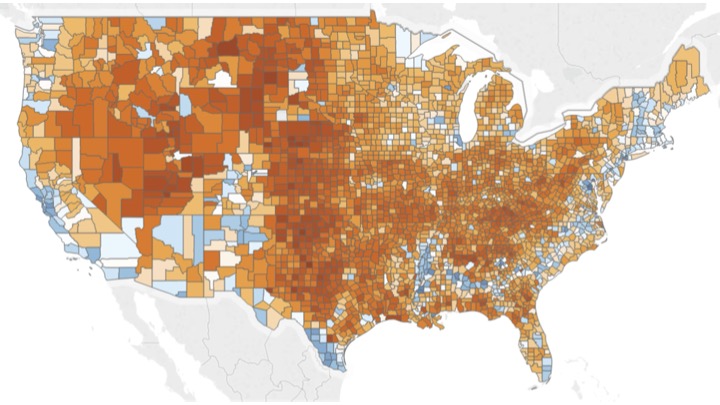{width="100%"} ::: :::: **Same counties, same data — sequential hides the threshold, diverging shows it.** ::: footer L5 · 50/50; stacked variant: two .nostretch images at width 100% then ~62%, centred ::: ## L6 · Text only — up to six bullets, or two columns of ≤ 4 in .smaller :::: {.columns .smaller} ::: {.column width="50%"} * Null values * Empty strings * Placeholder values (999, −1) * Incomplete records ::: ::: {.column width="50%"} * Different formats * Duplicate records * Conflicting values * Unit mismatches ::: :::: ::: footer L6 · one column for ≤ 6 bullets; split at 7+ so nothing shrinks below .smaller :::
