Interactivity in Information Visualization
A Dialogue with Data - CS-GY 6313 - Fall 2025
Beyond Static Pictures
So far, we’ve treated visualizations as static images.
- They are powerful…
- But they only answer the questions the designer thought to ask
Interaction changes this:
- Turns visualization from a presentation into an exploration tool
- Enables a dialogue with data
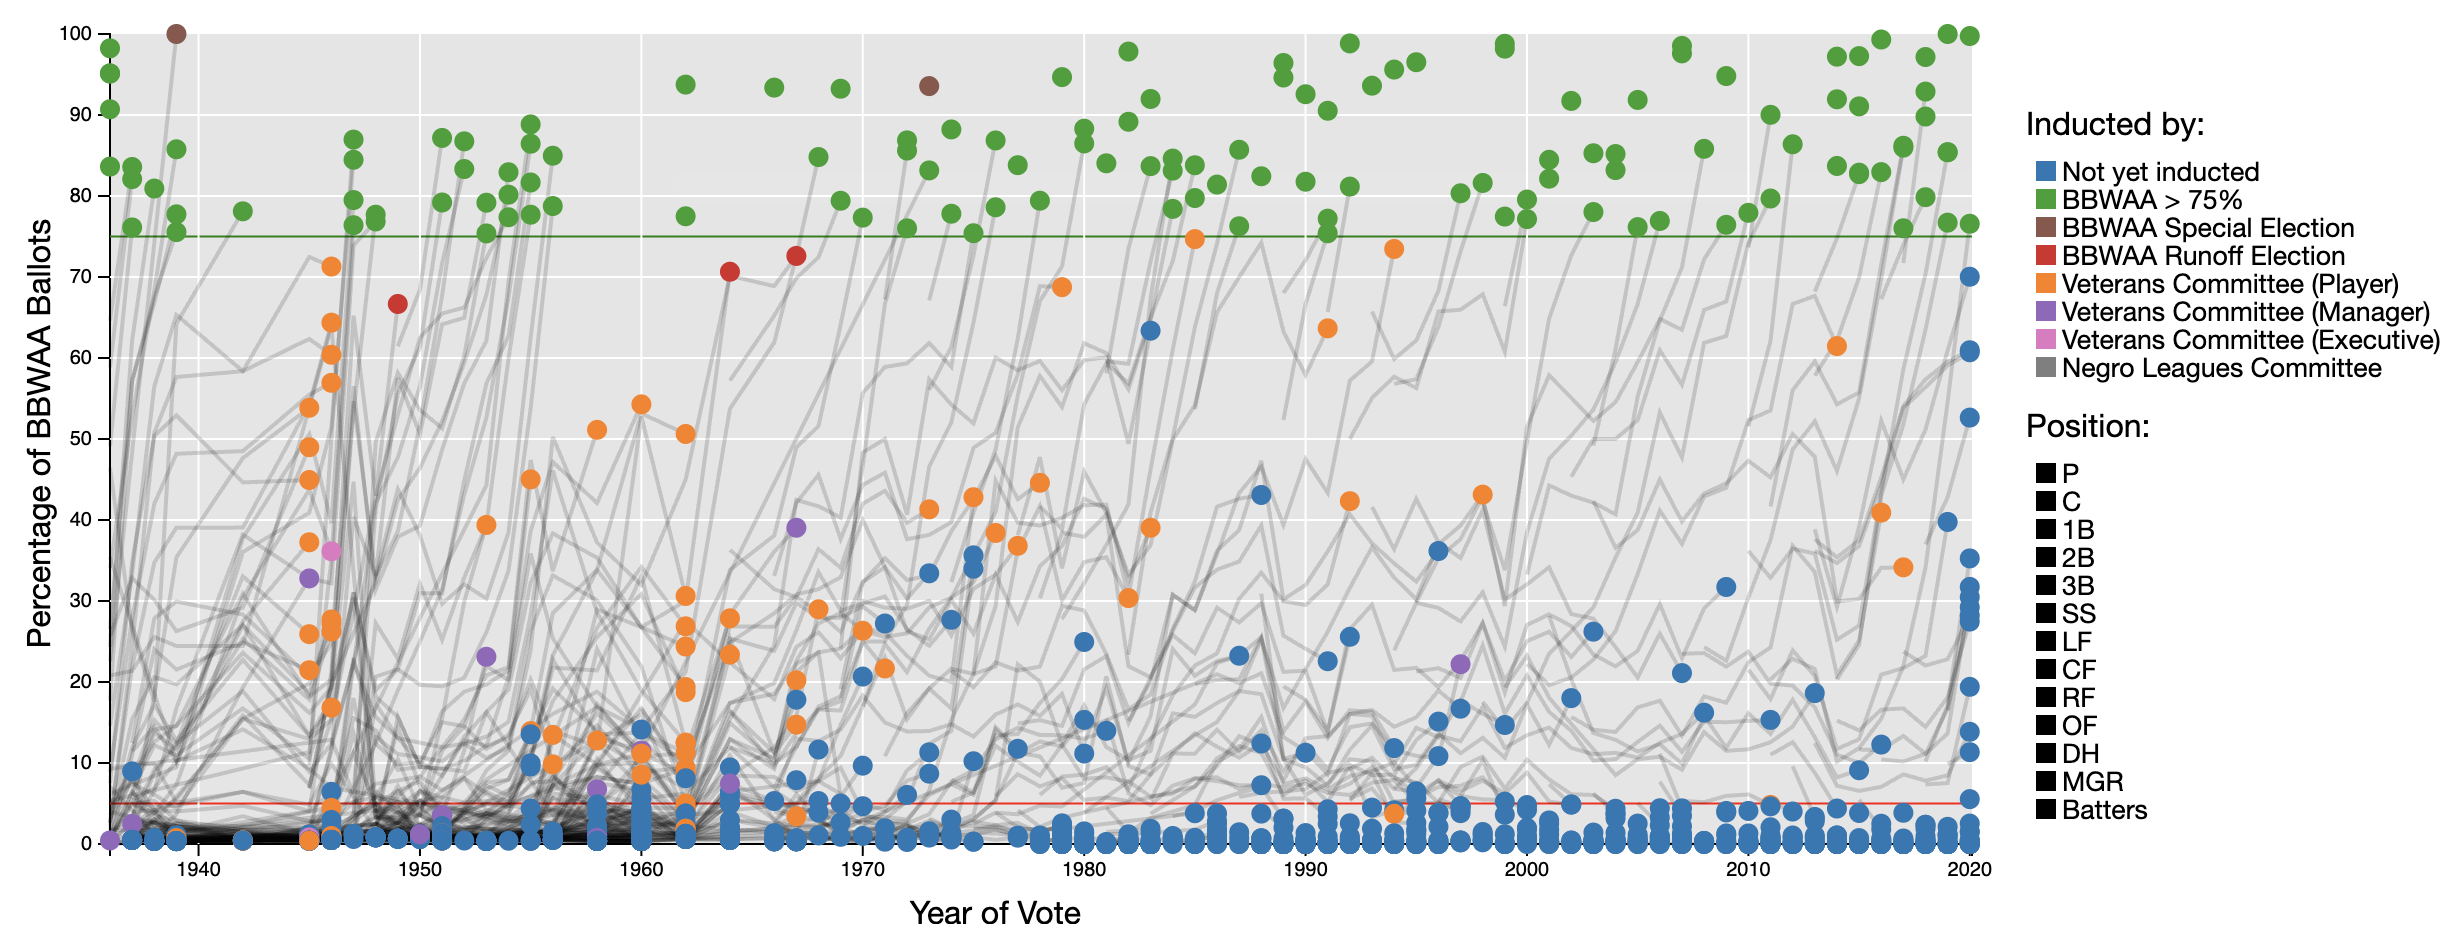
Question: What questions can you answer? What questions can’t you answer without touching it?
Bridging the Gulfs
Key HCI Concept: Donald Norman’s Gulfs
Gulf of Execution
- “How do I make the visualization do what I want?”
- User’s challenge to specify intent to the system
Gulf of Evaluation
- “What did the visualization just do?”
- “What does this view mean?”
- User’s challenge to understand system response
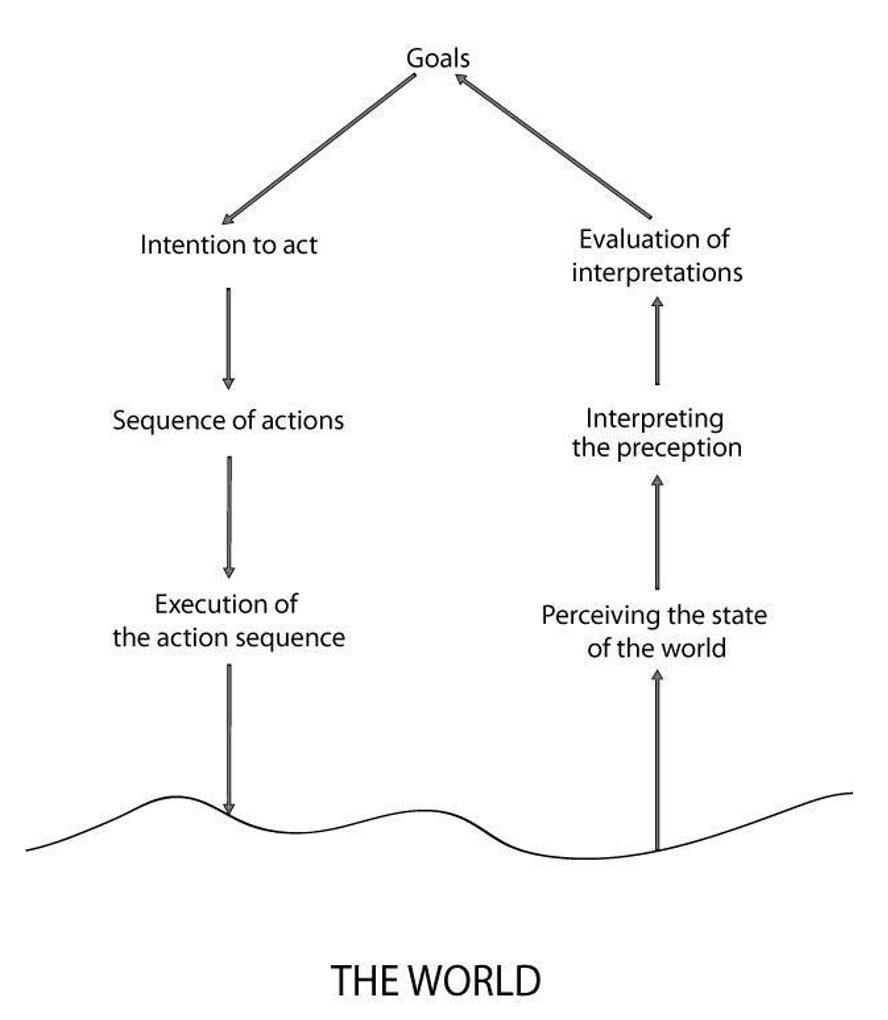
Good interaction design bridges these gulfs - making the tool feel like an extension of your thought process.
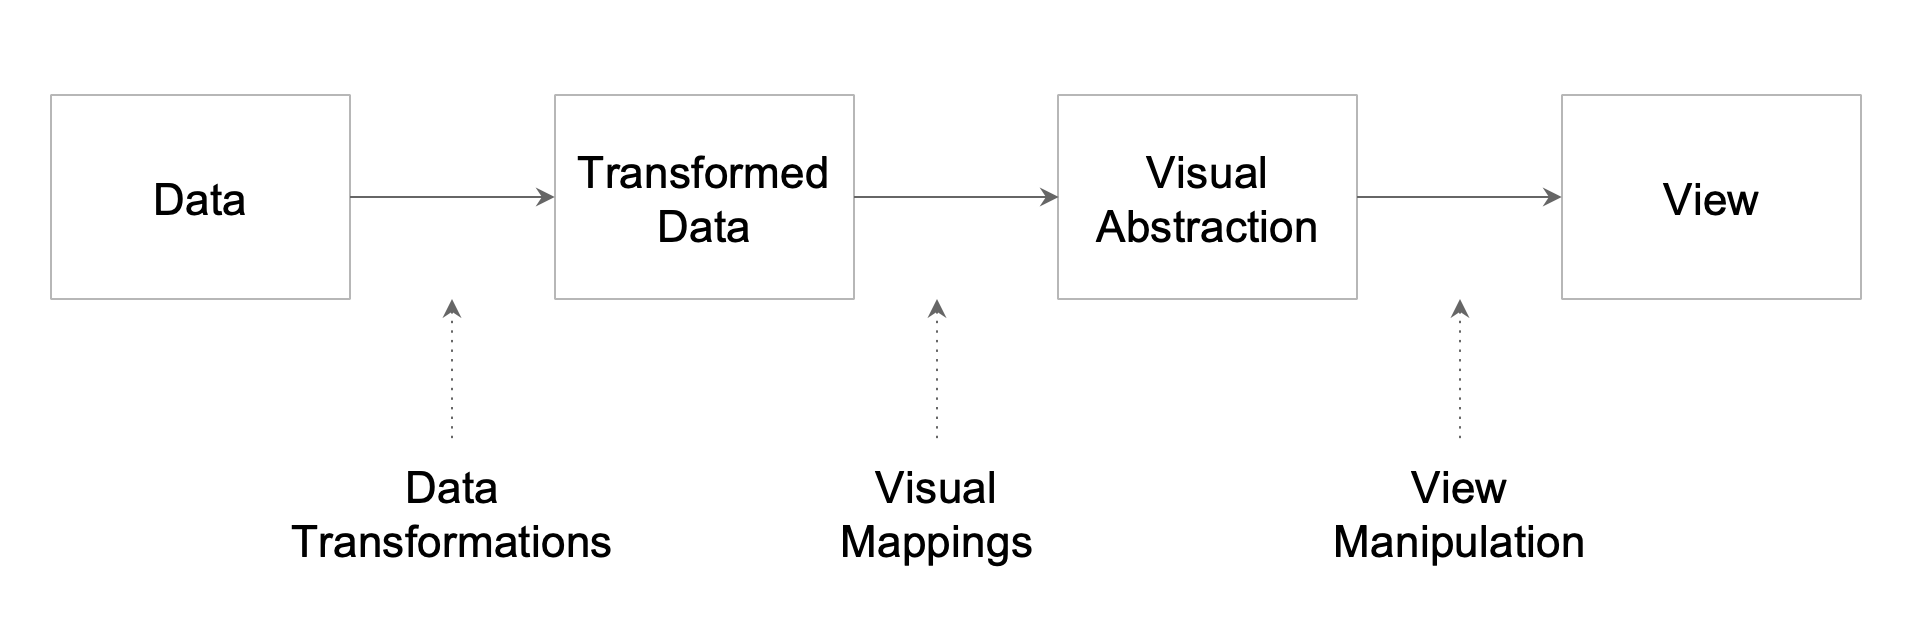
The Information Visualization Pipeline
Interaction isn’t one thing - it’s a set of manipulations at different stages:
- Manipulating Data
- Filtering, deriving new fields
- Manipulating Visual Mapping
- Swapping axes, changing color scales
- Manipulating the View
- Panning, zooming, rotating
Mantra in Action: FilmFinder
Overview
- All films shown as dots
- Full view of the database
- Color-coded by genre
Zoom and Filter
- Dynamic query sliders (year, rating, length)
- Real-time visual feedback
- Immediate filtering on the display
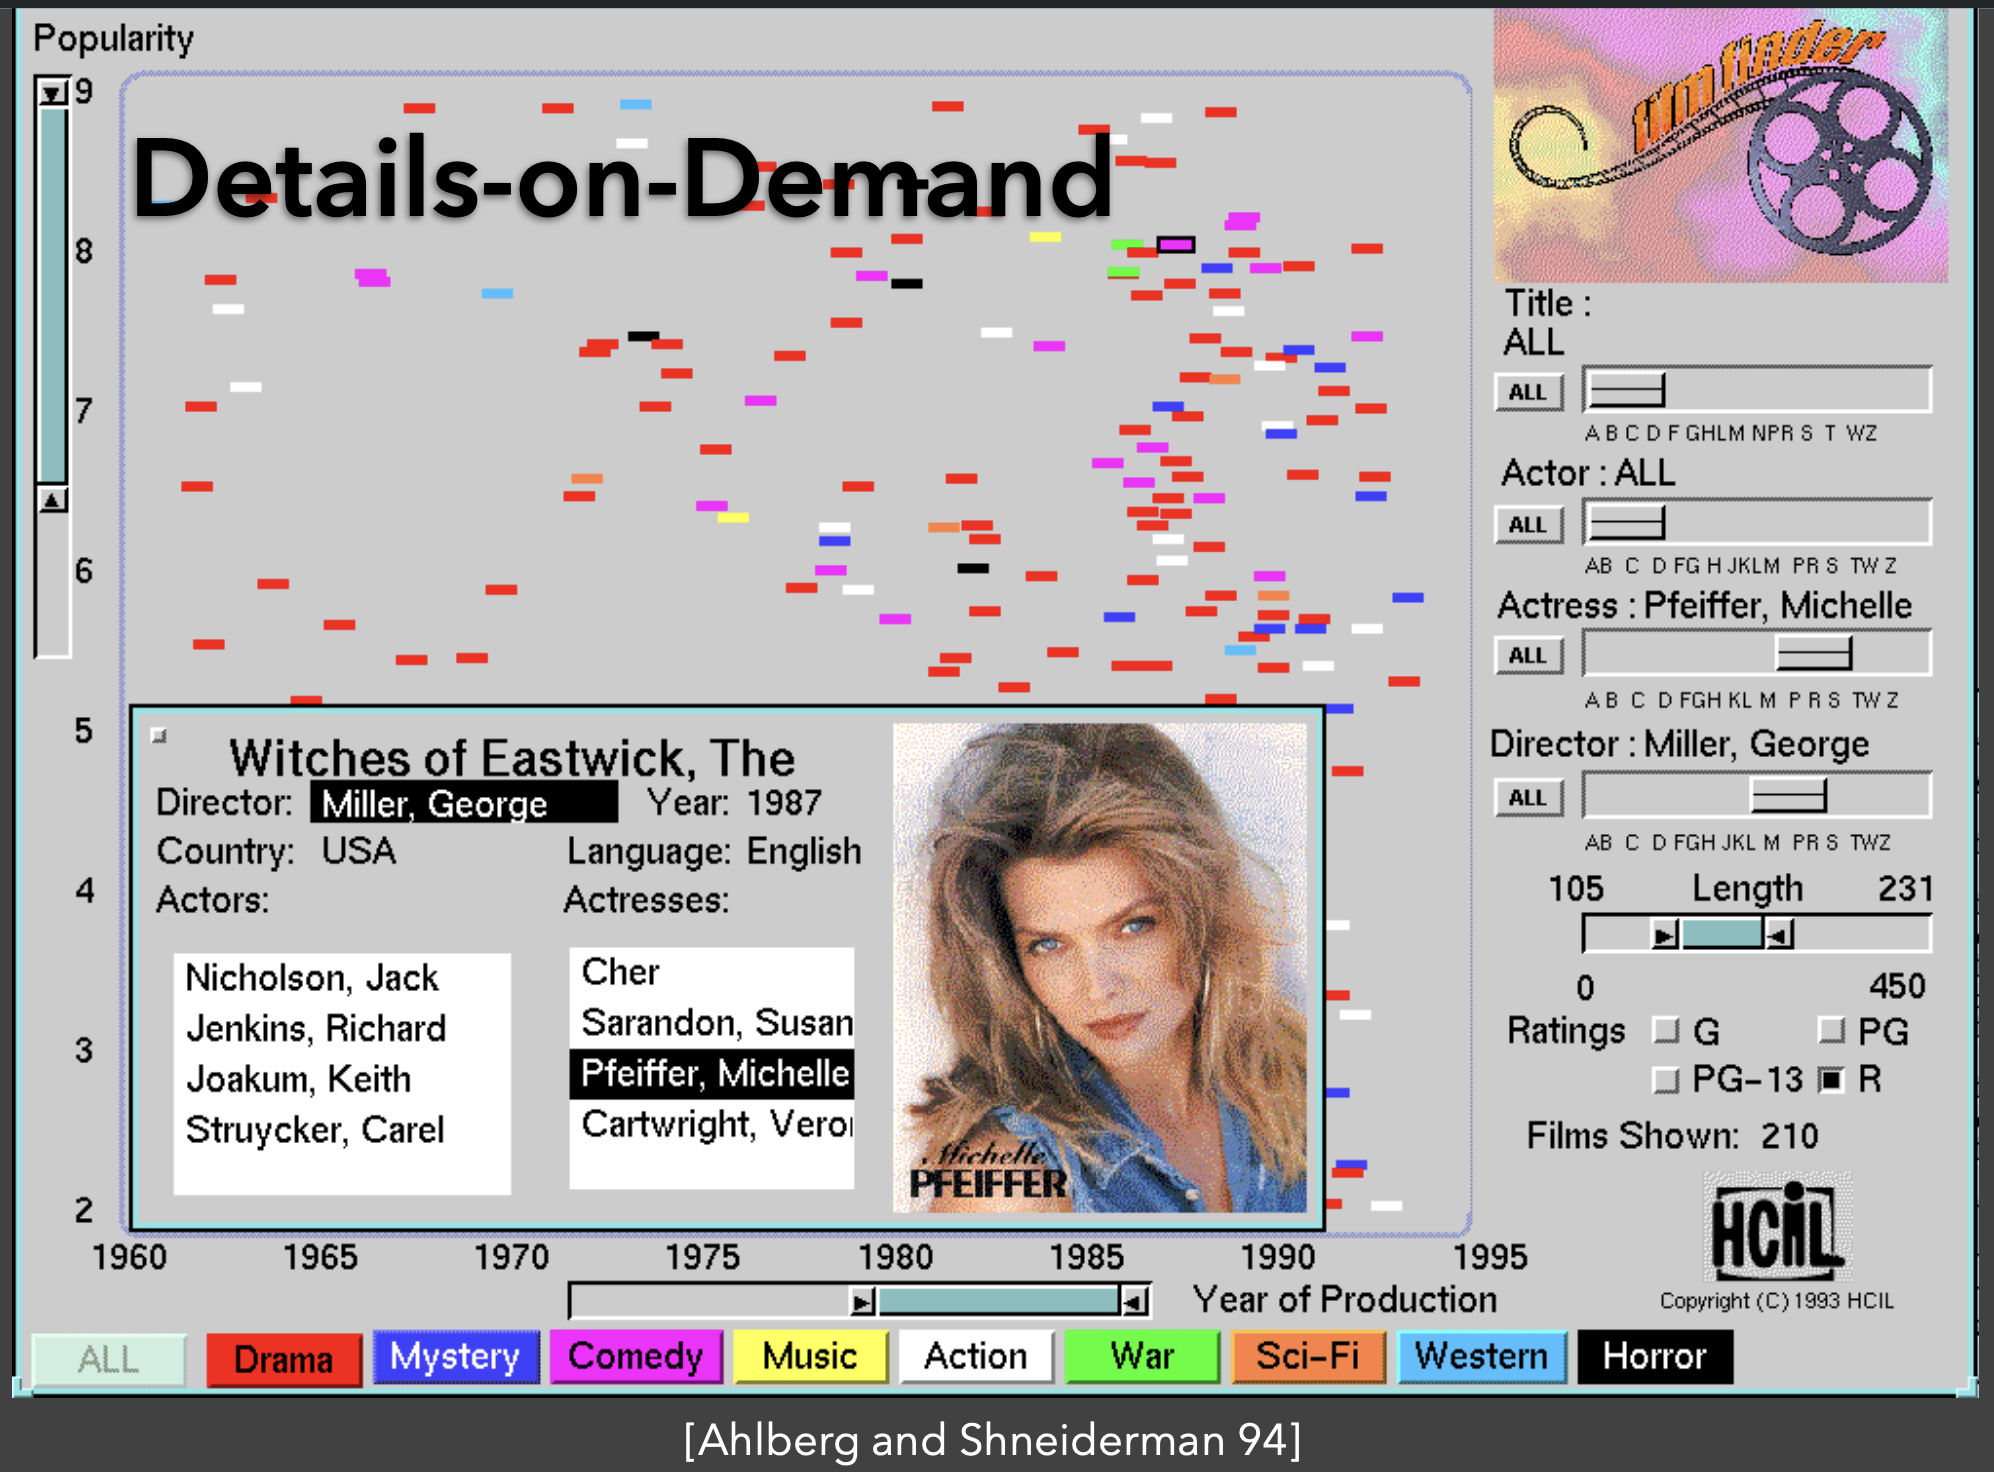
Details-on-demand
- Click on a film
- Full details appear (title, actors, director)
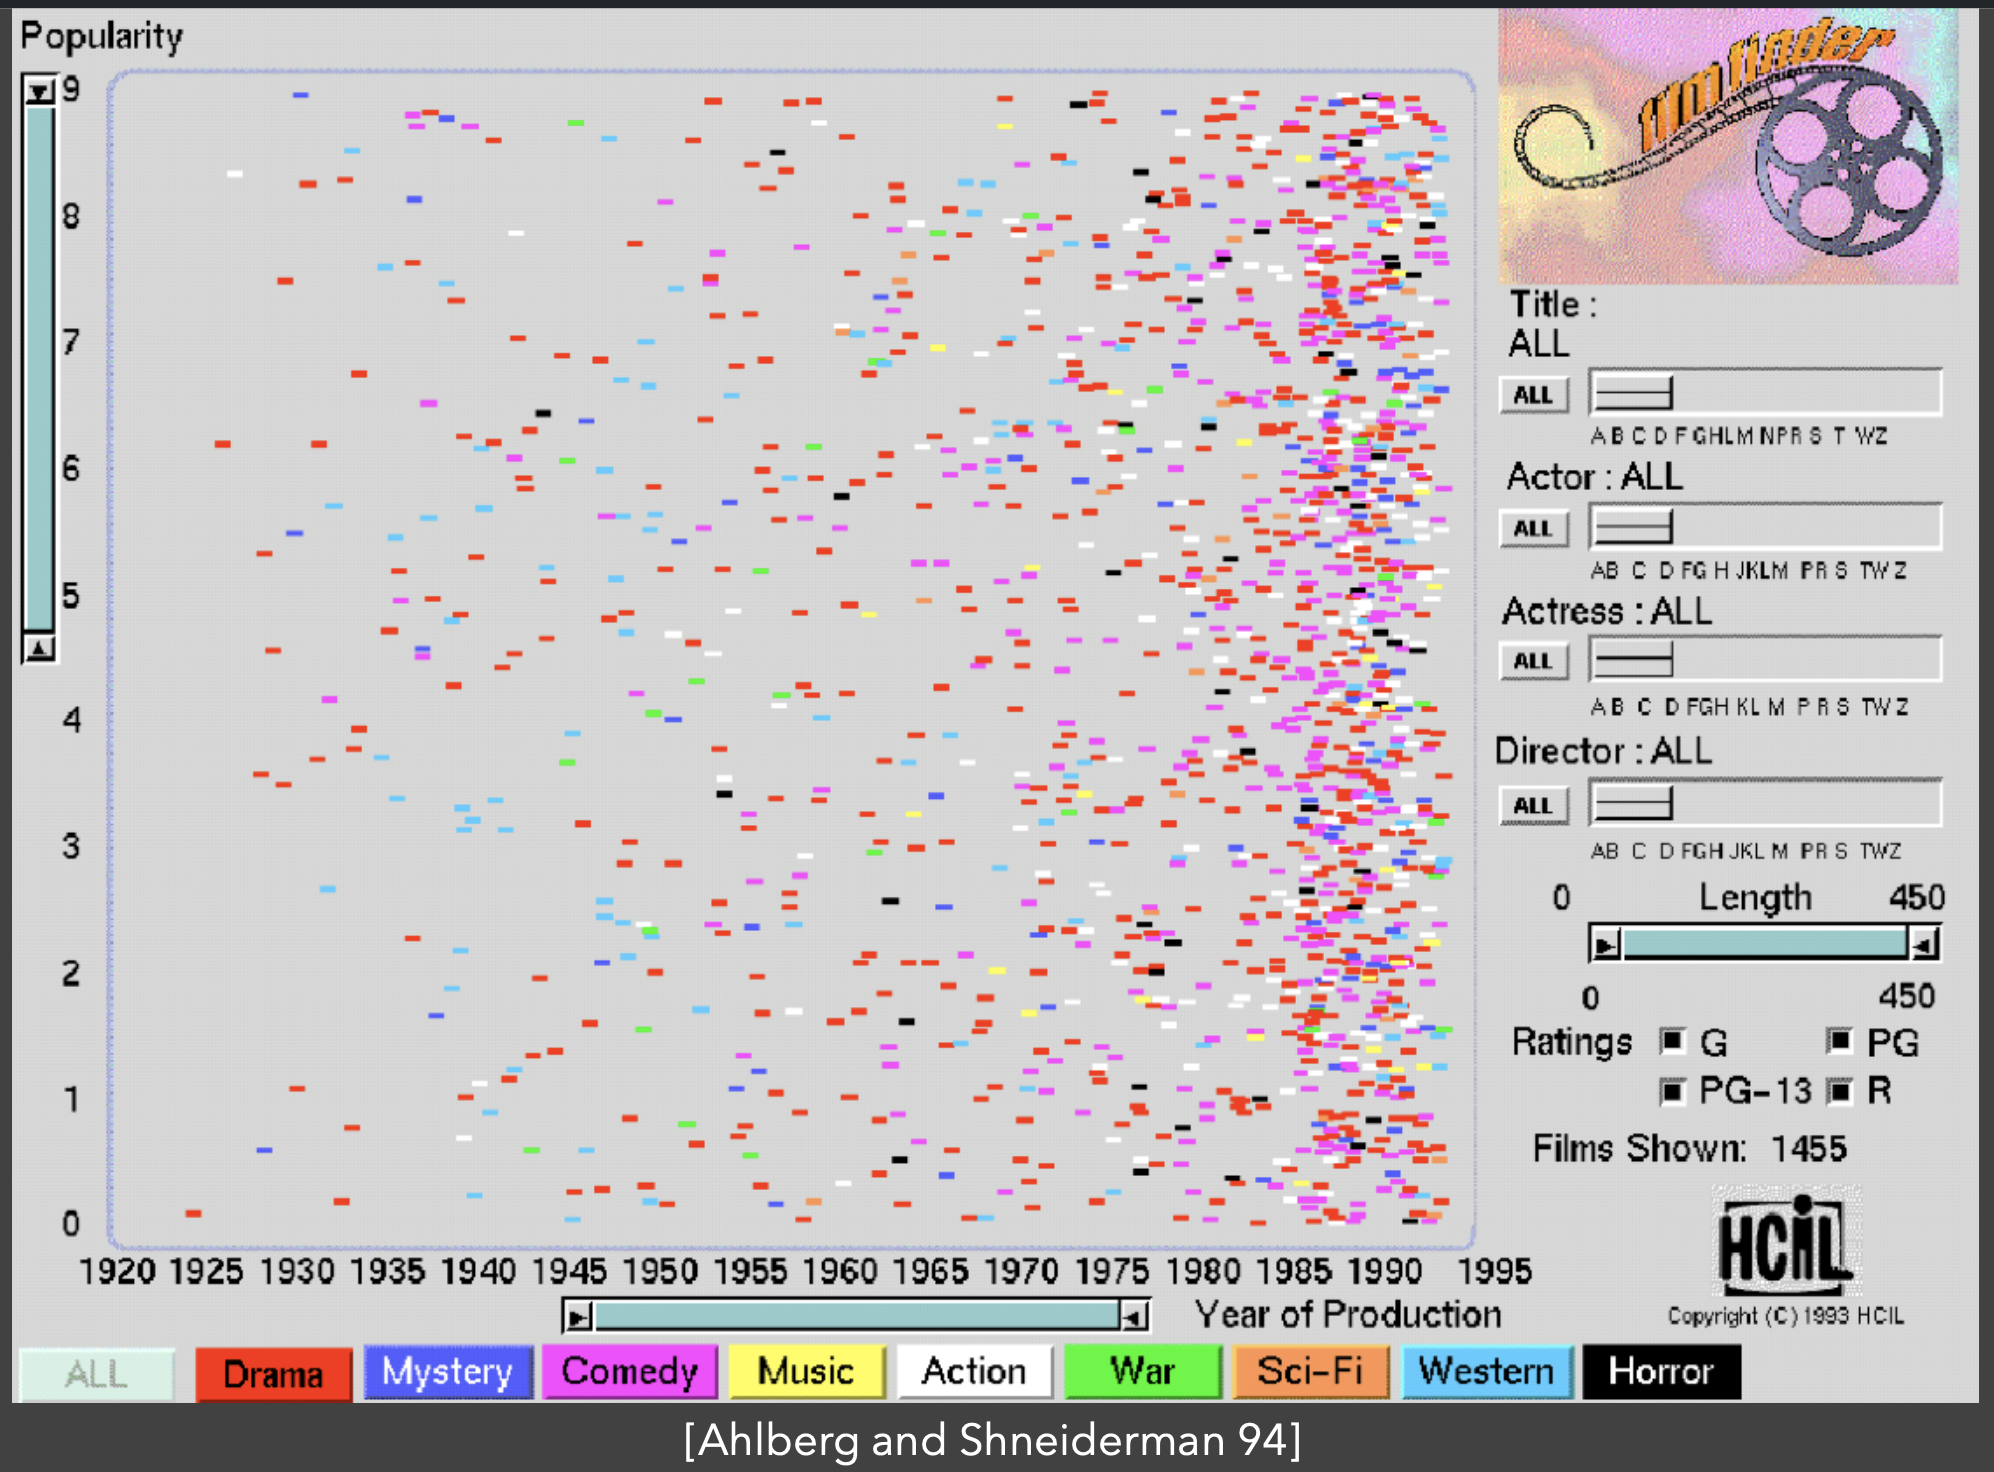
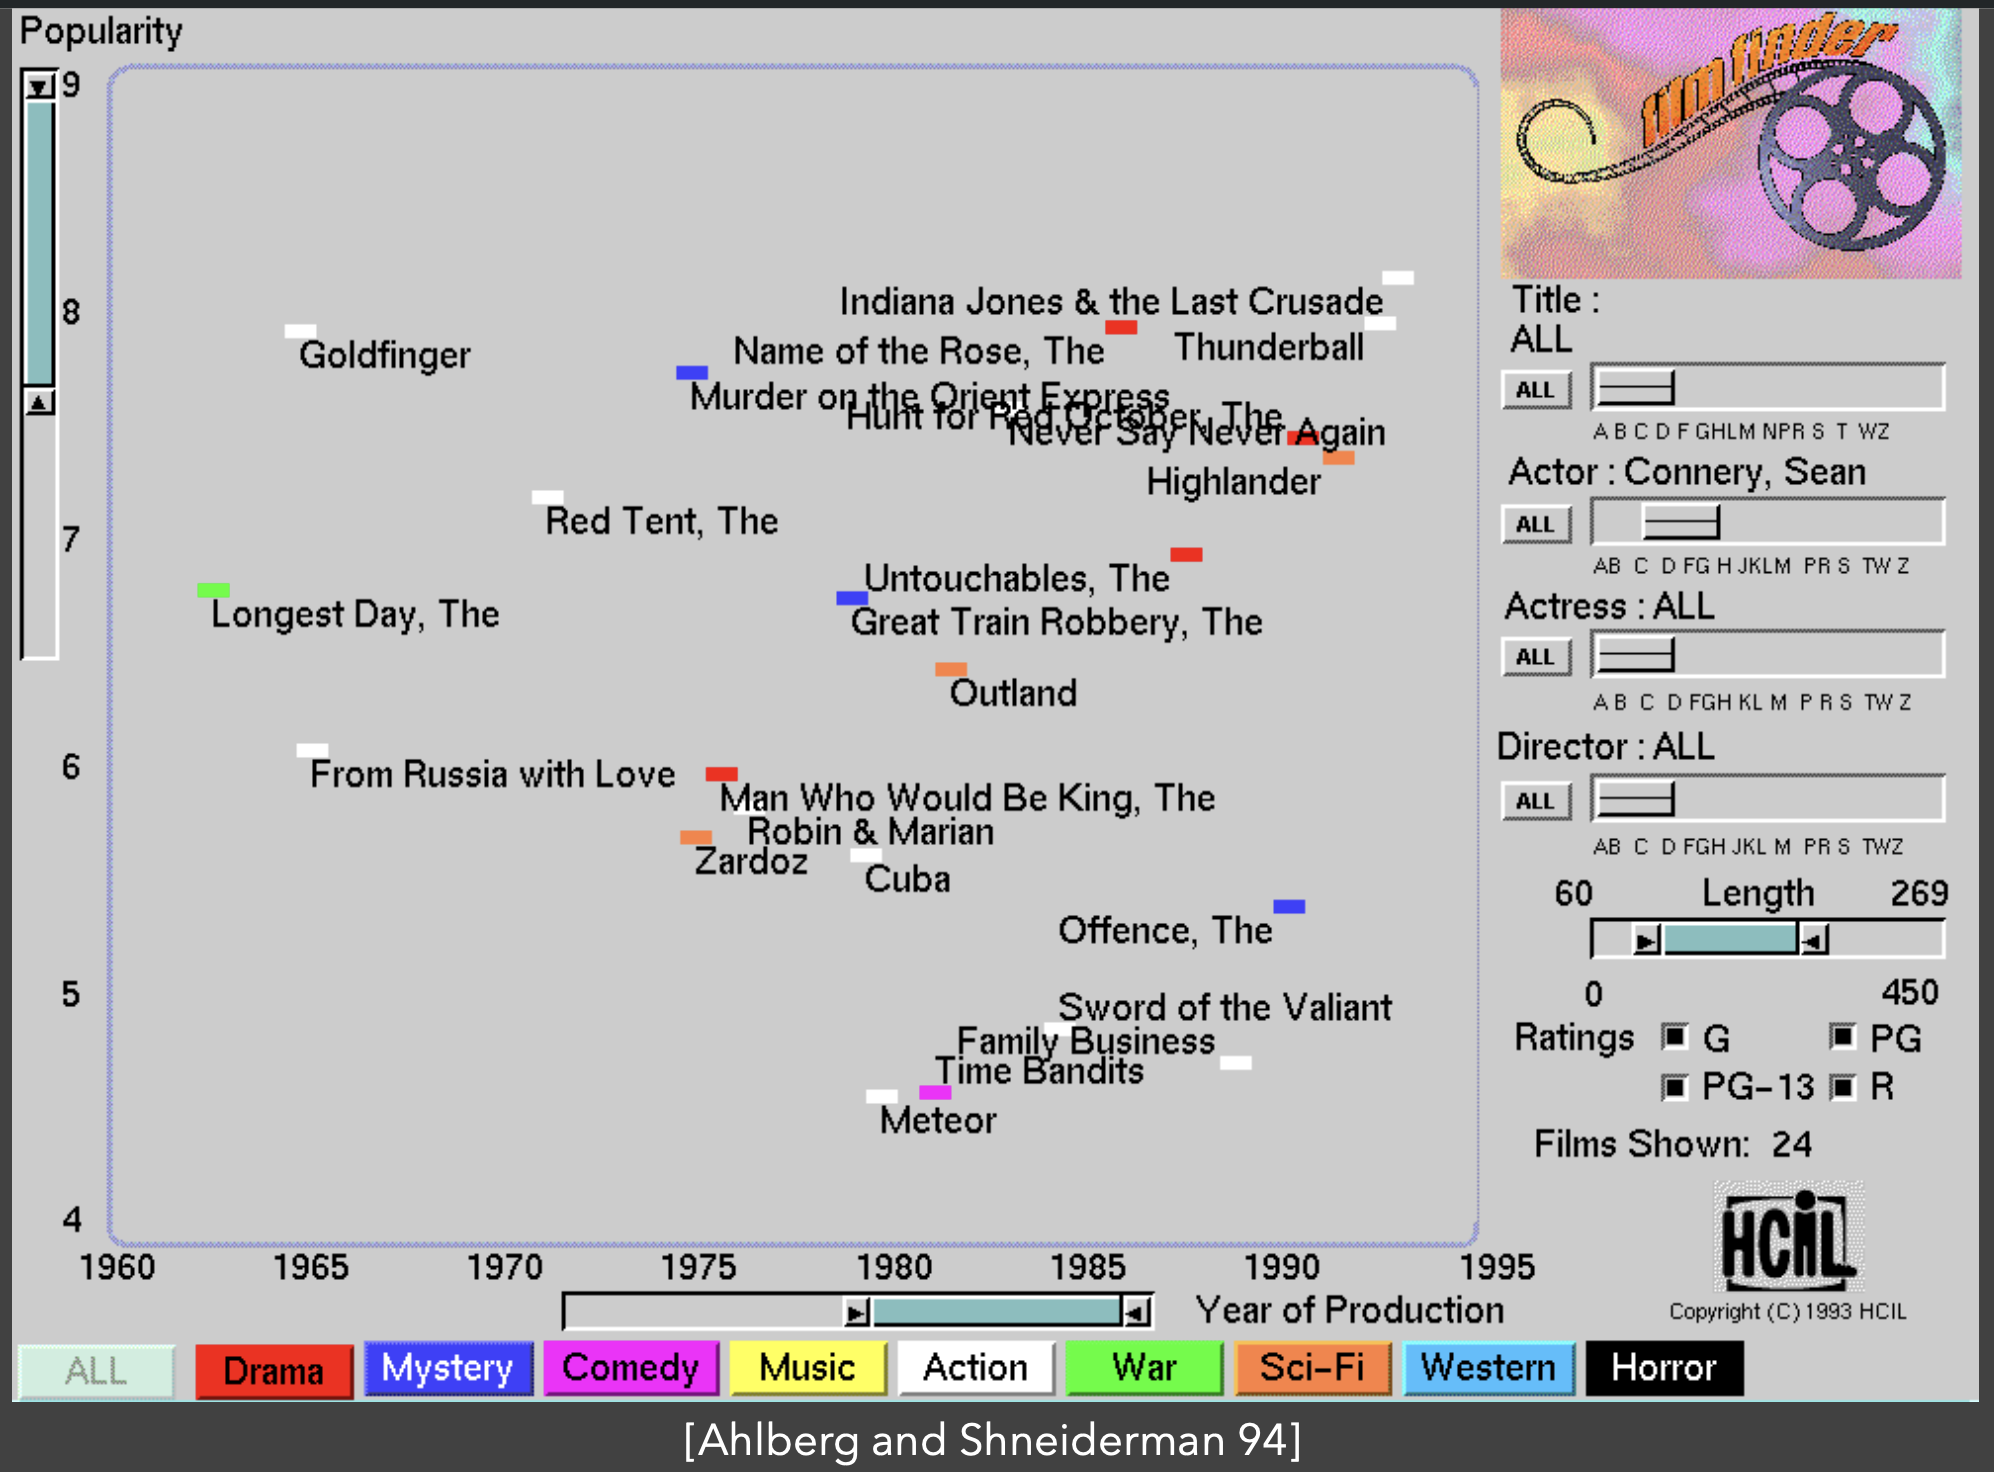
Key Innovation: Dynamic queries - immediate visual feedback as you adjust sliders.
A Modern Framework
Jeffrey Heer & Ben Shneiderman (2012)
“Interactive Dynamics for Visual Analysis”
Three High-Level Categories:
- Data & View Specification
- Controlling what you see
- View Manipulation
- Controlling how you see it
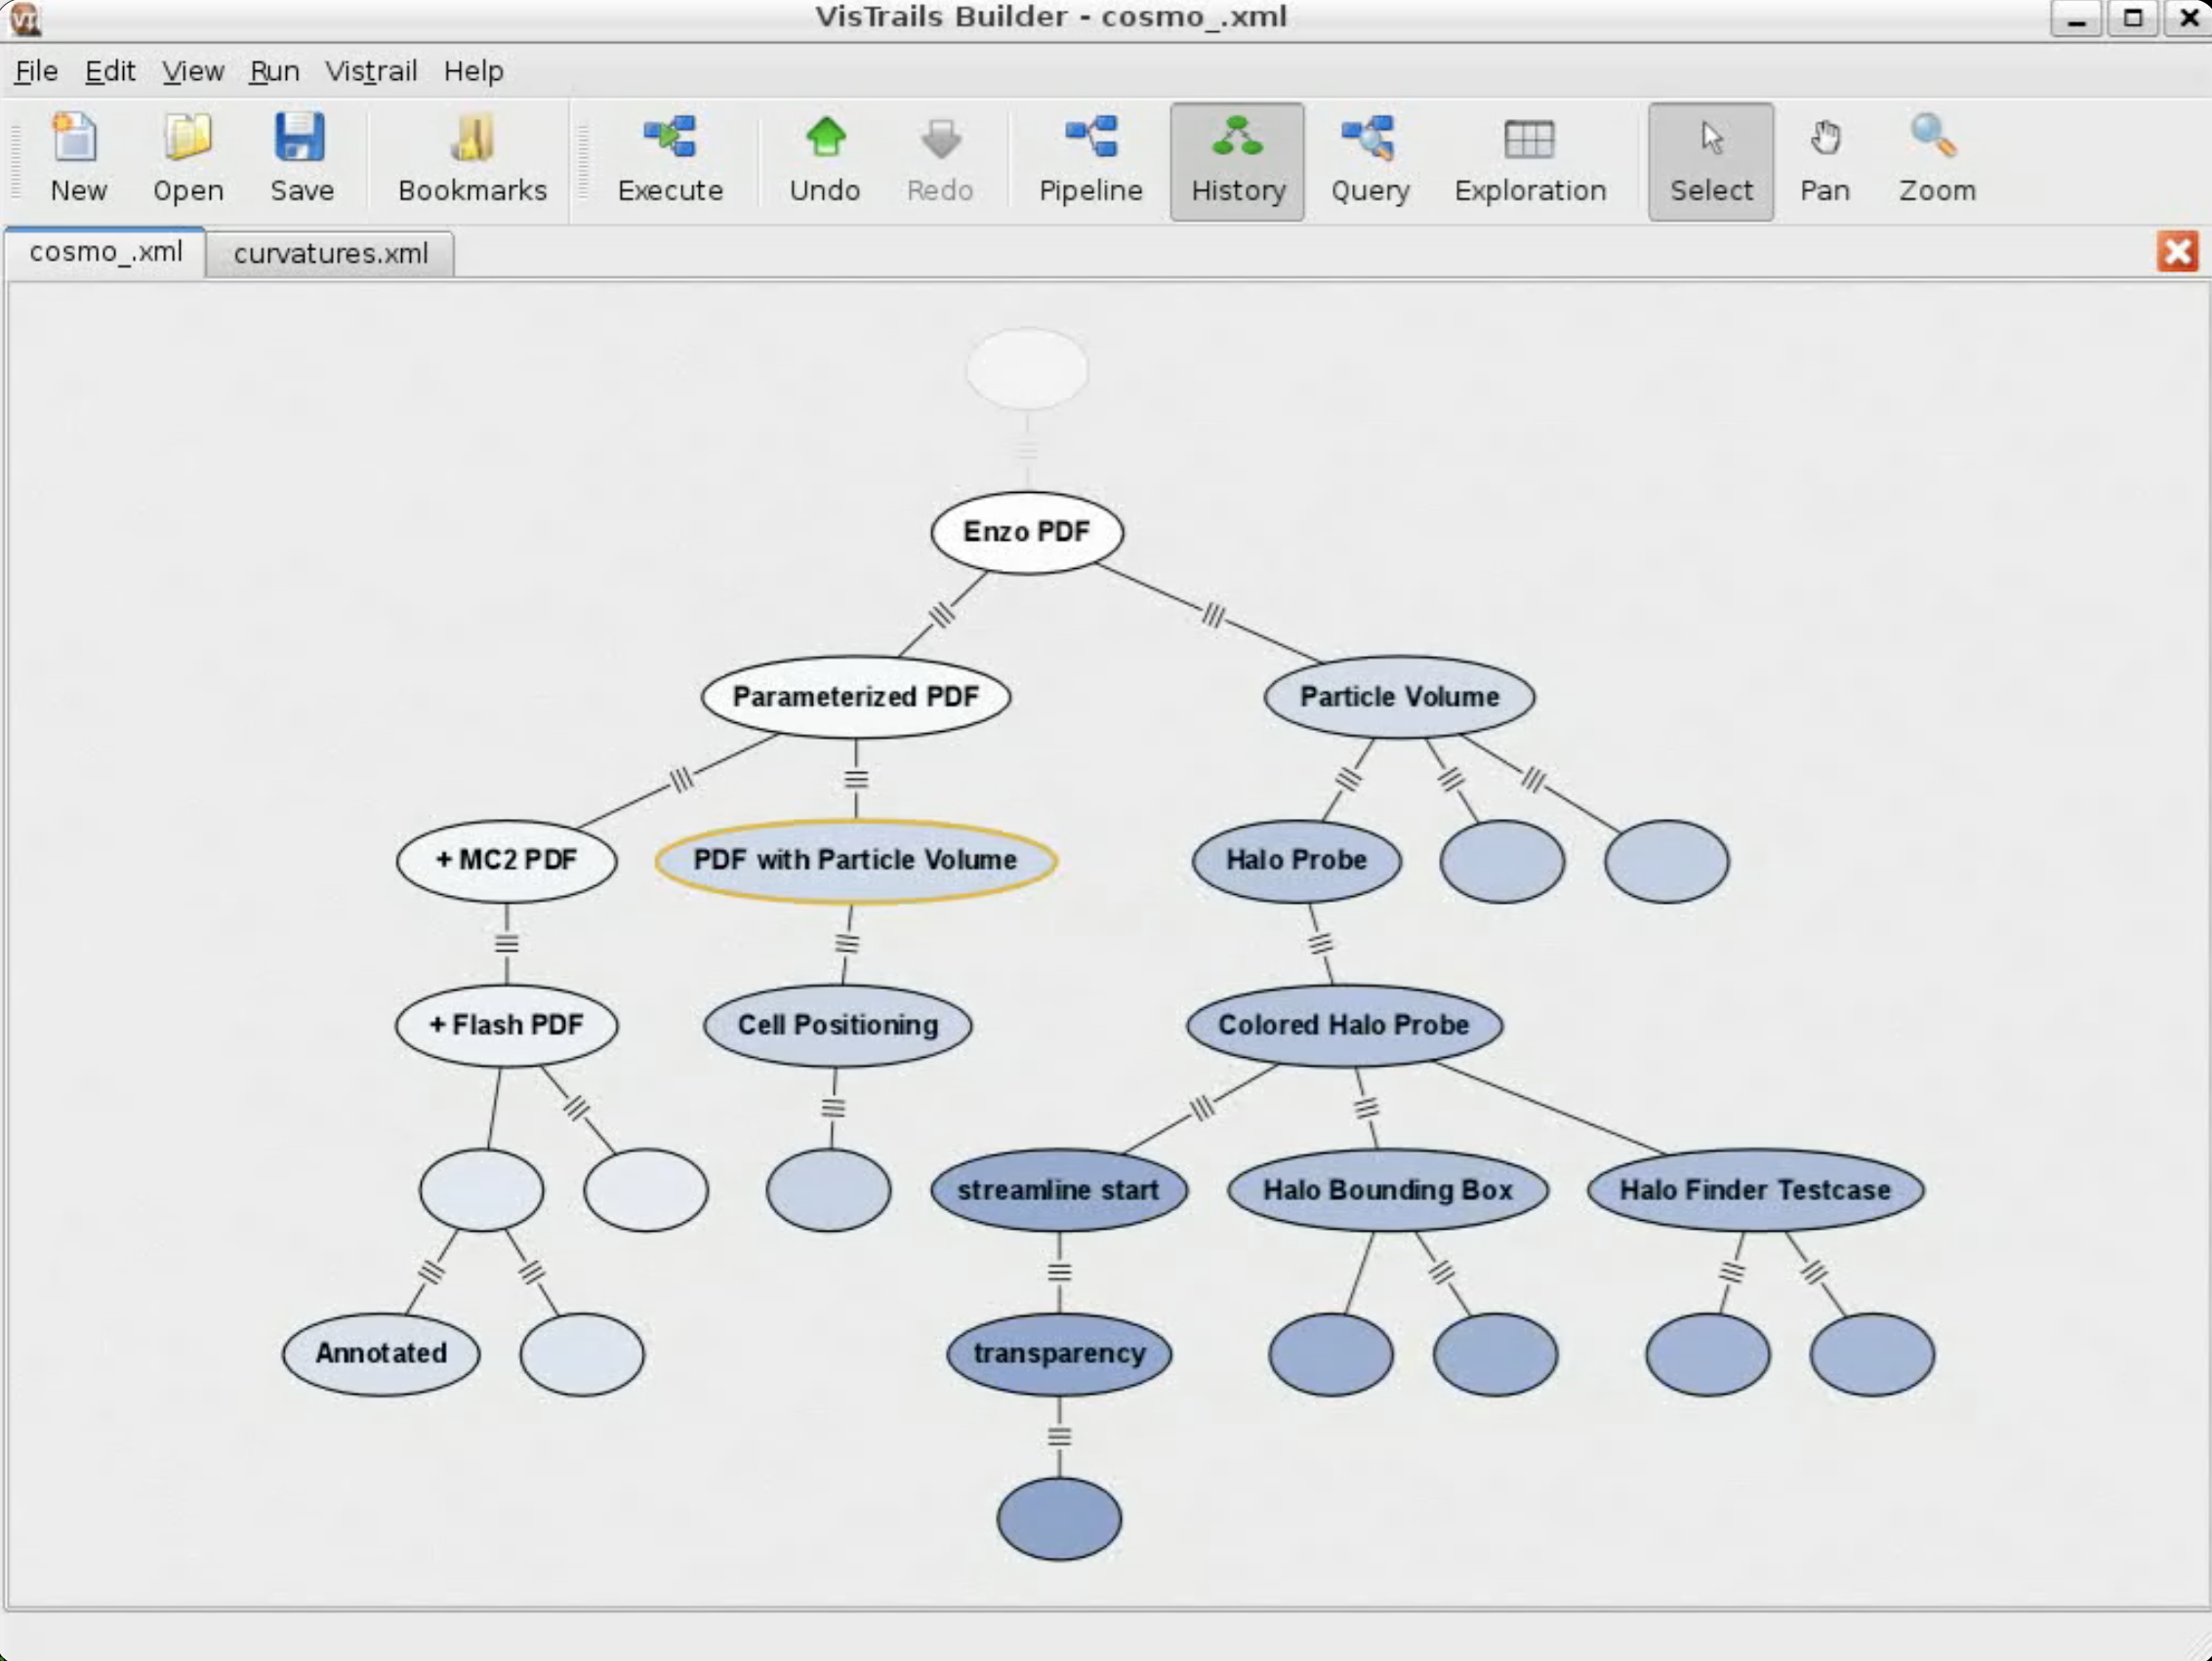
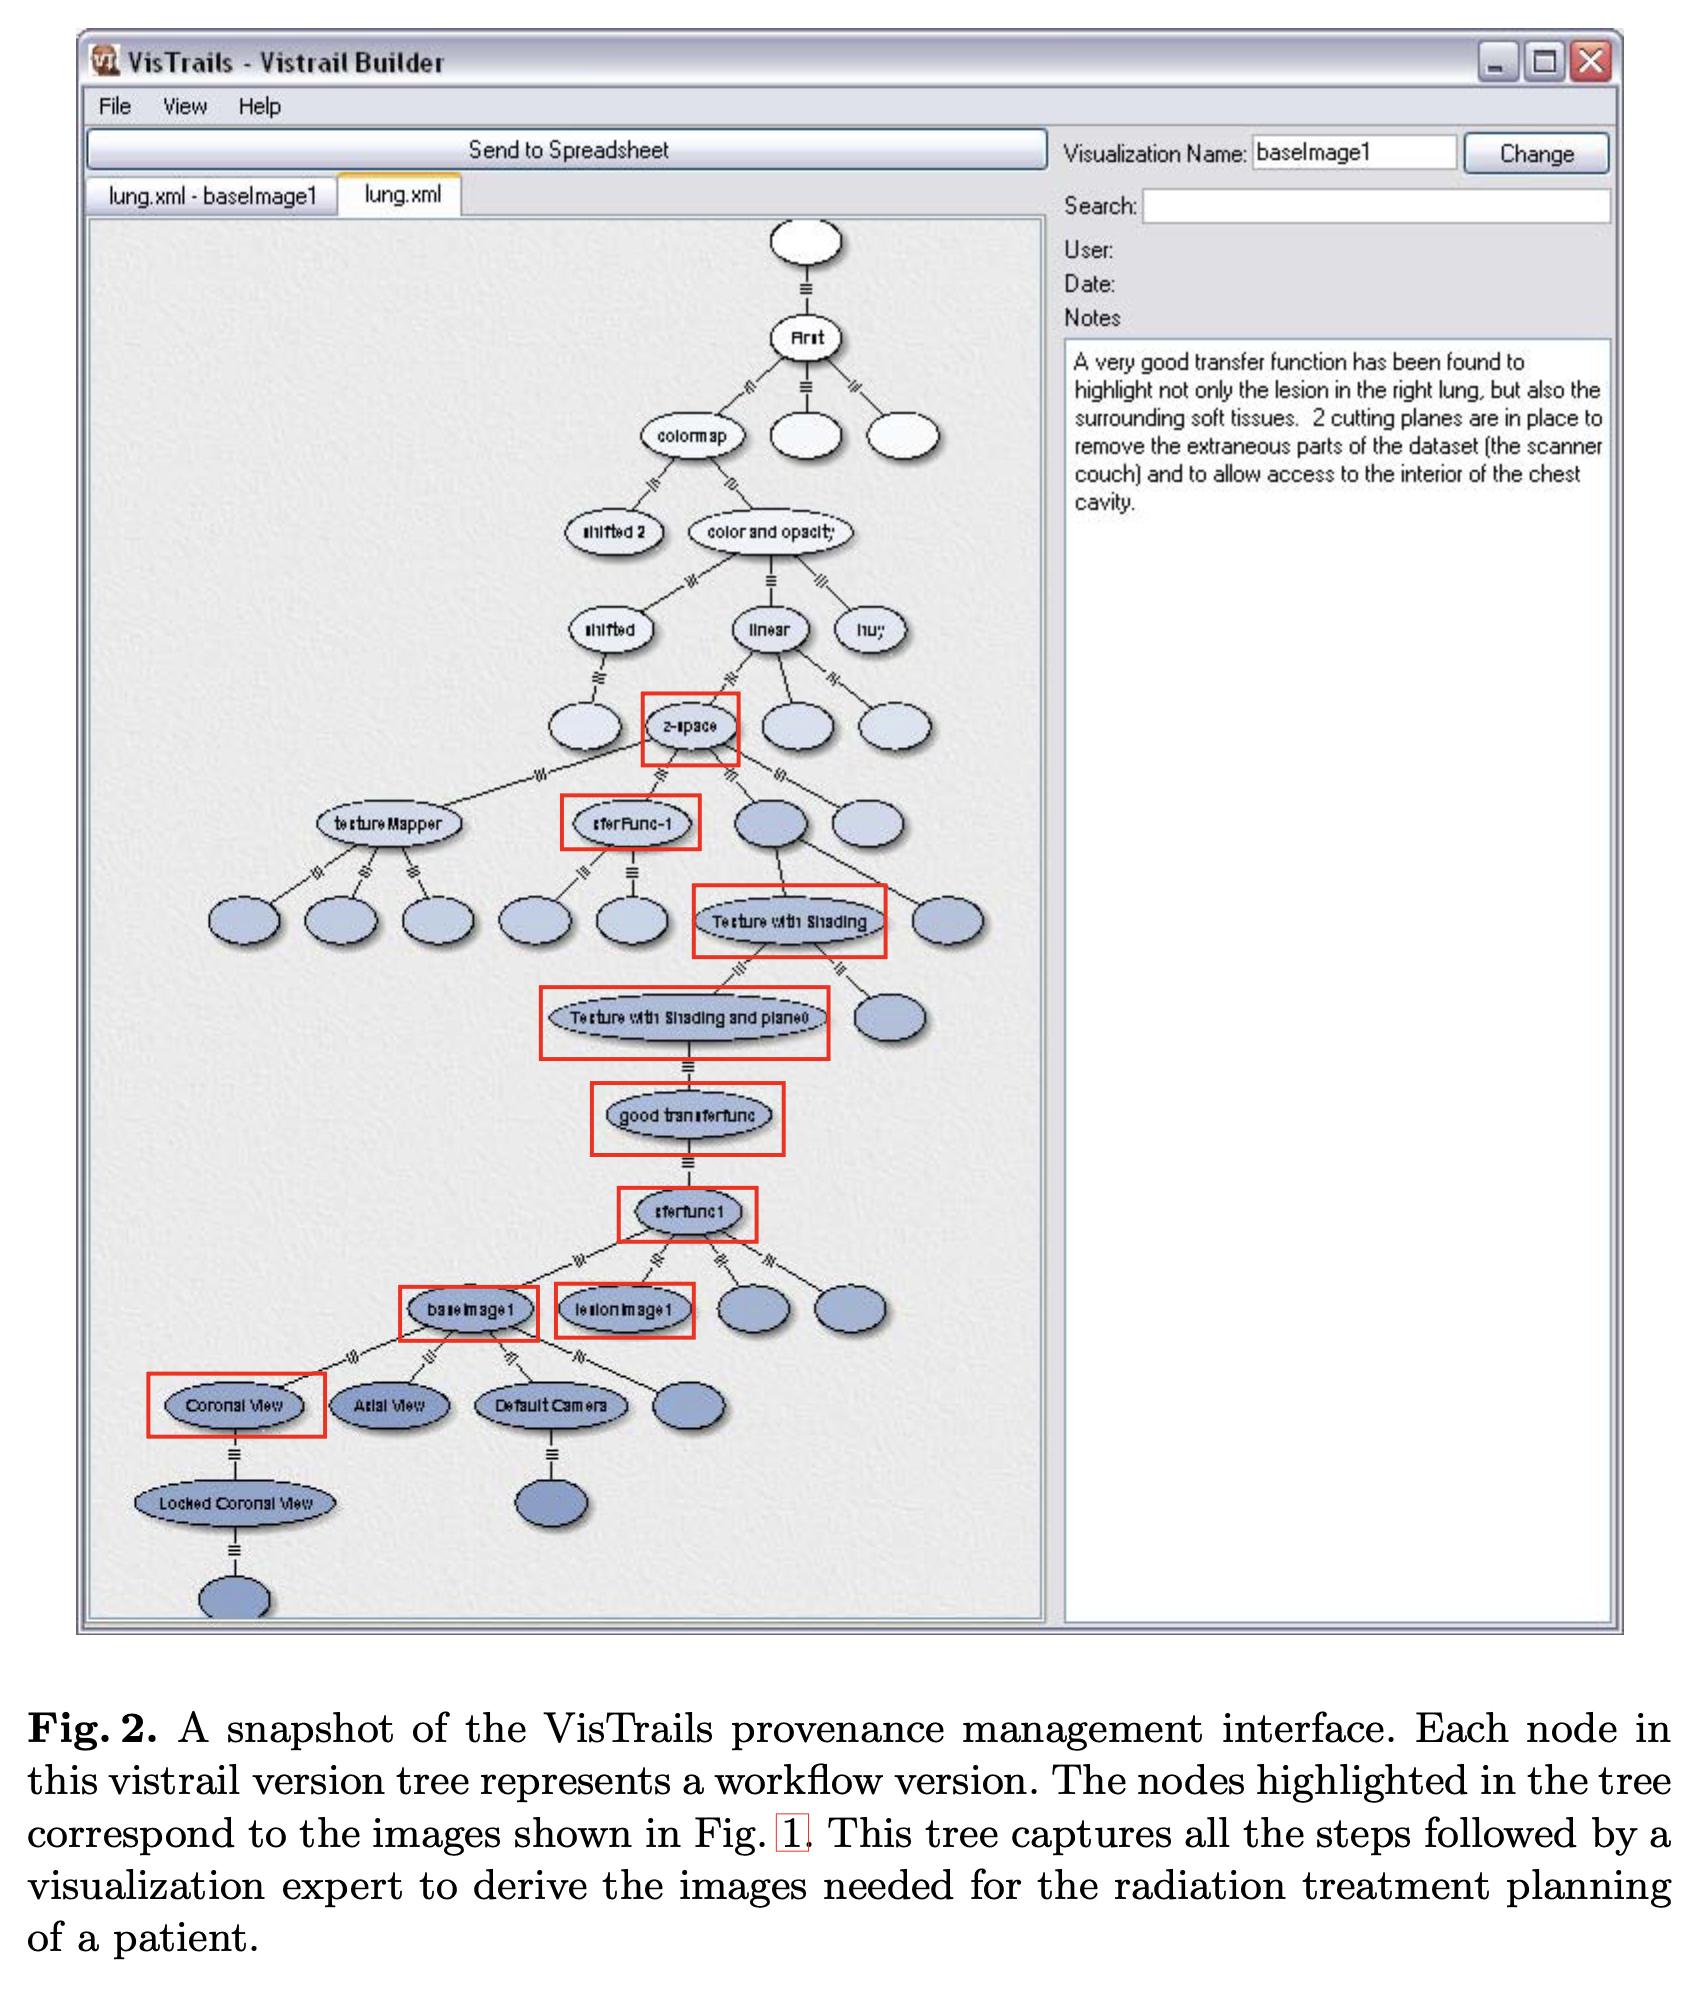
- Process & Provenance
- Supporting the analysis process itself
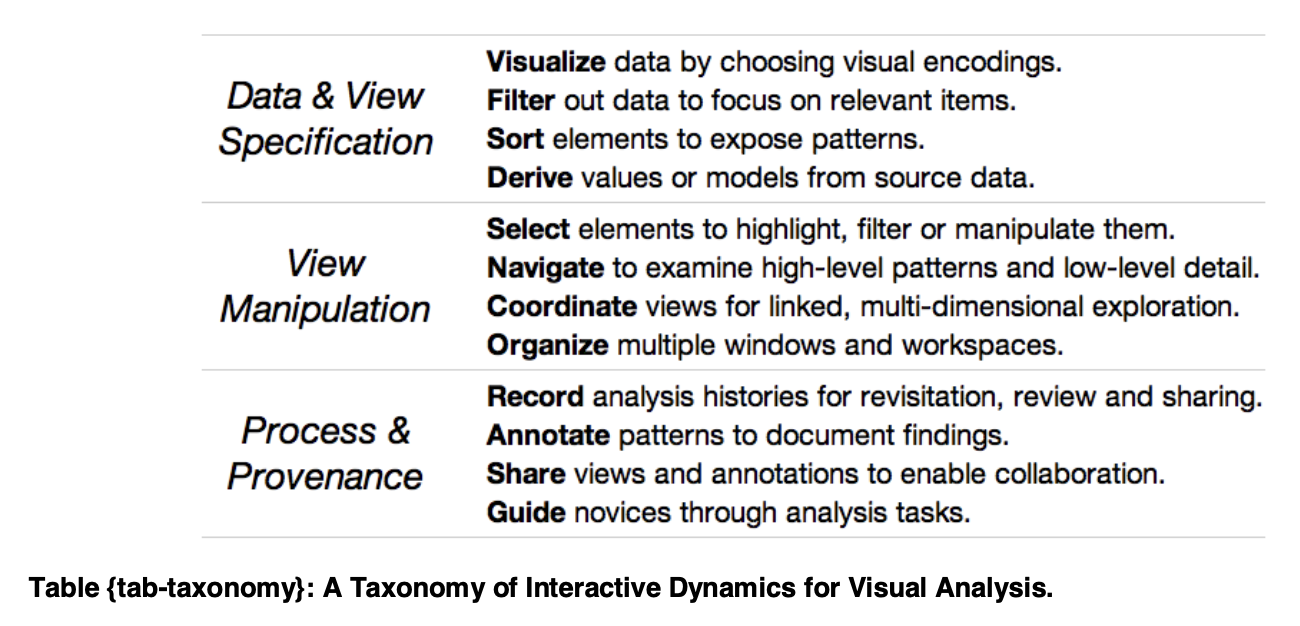
12 specific interaction techniques - our focus for the rest of the lecture.
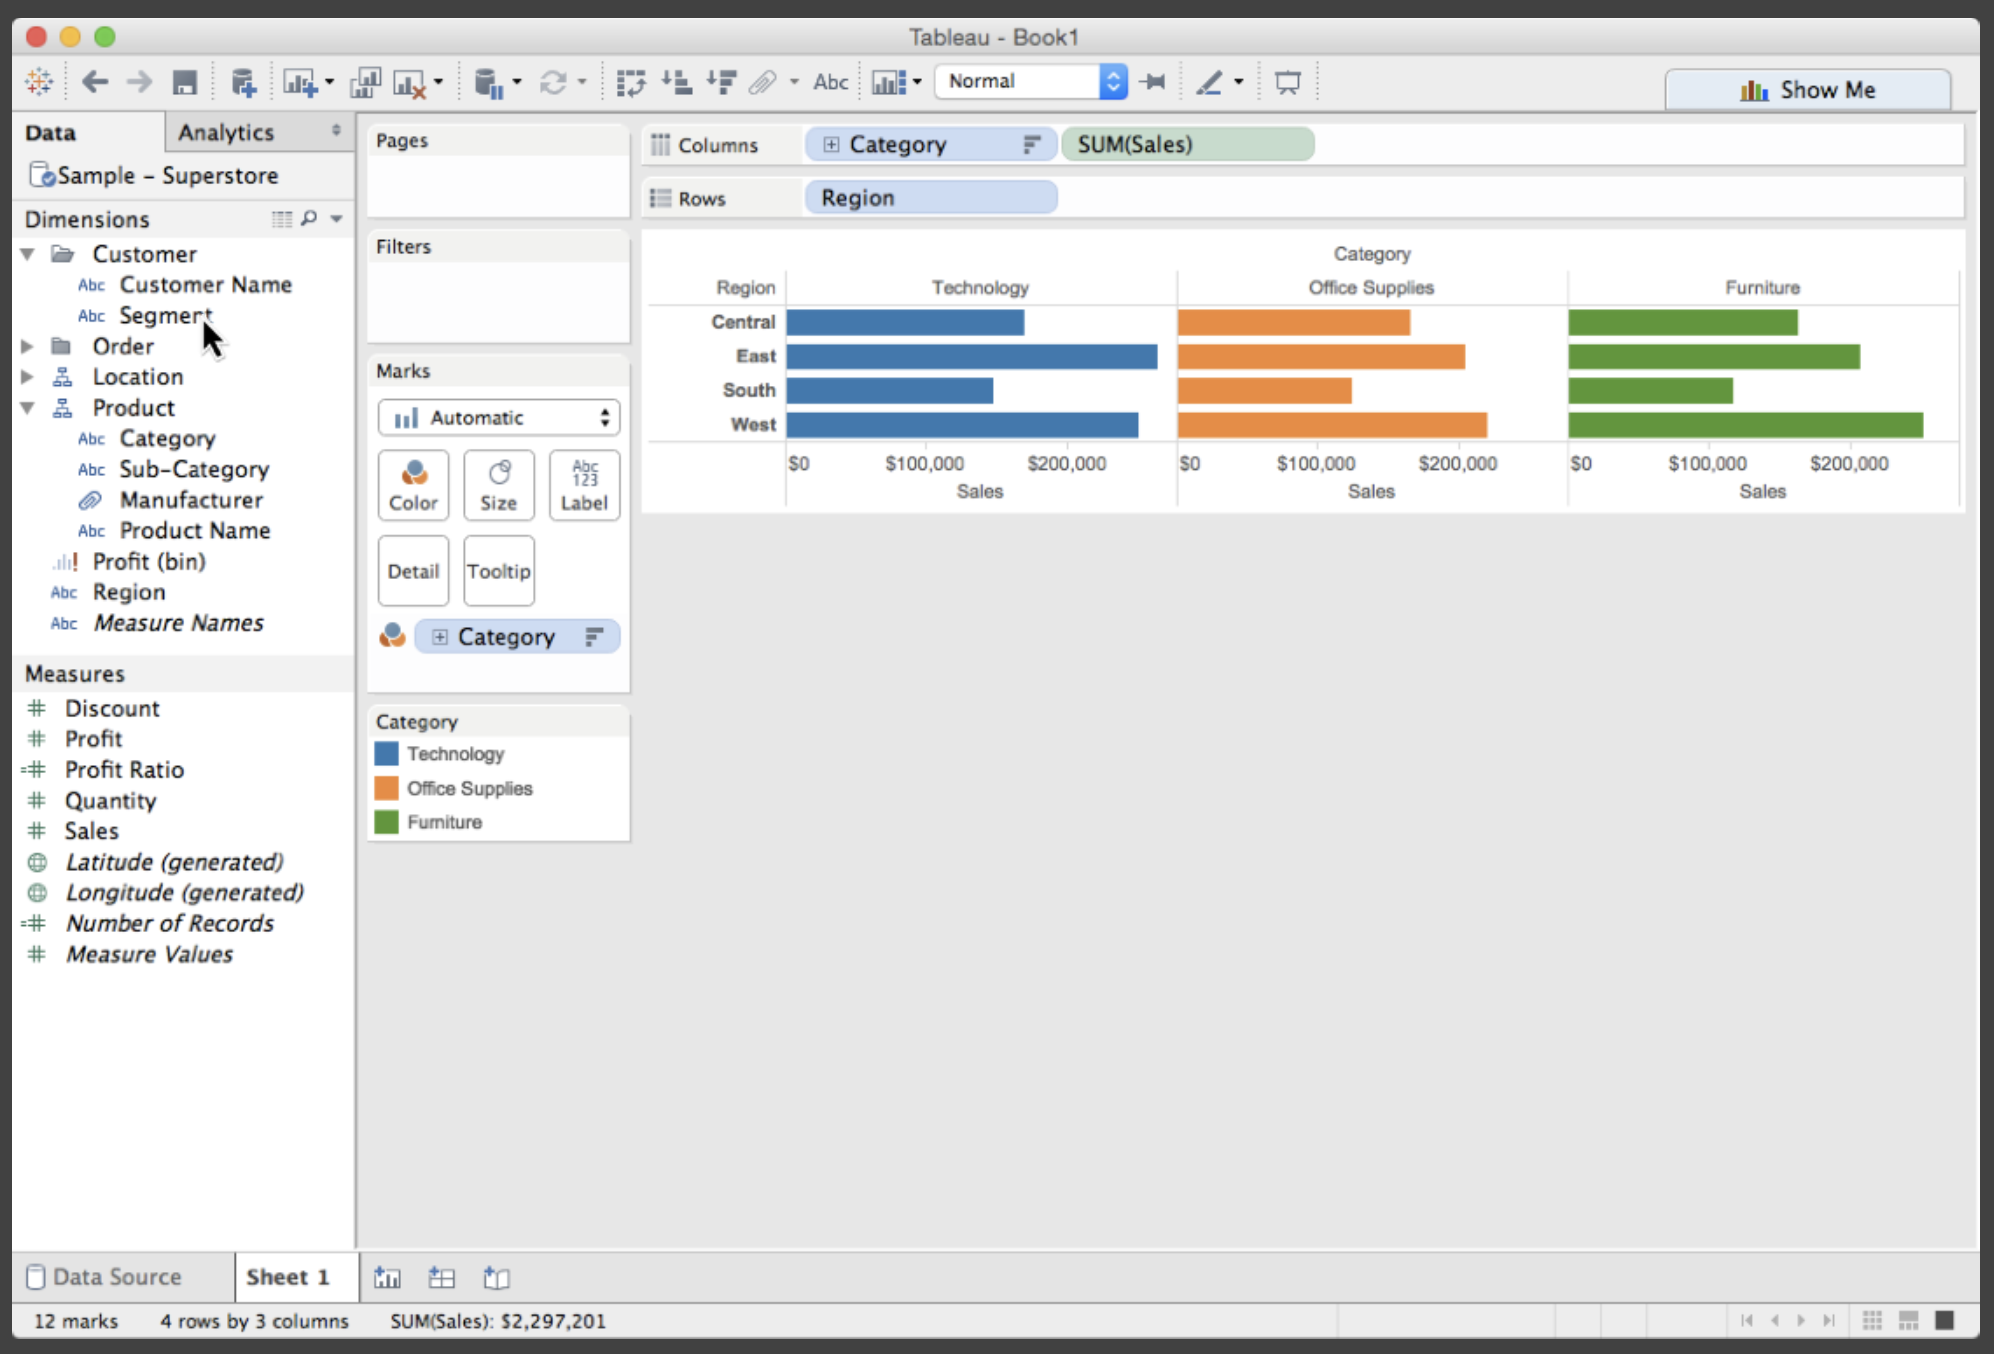
1. Visualize
Choosing visual encodings
- The most fundamental step
- Mapping data to visual properties
- Creating the initial representation
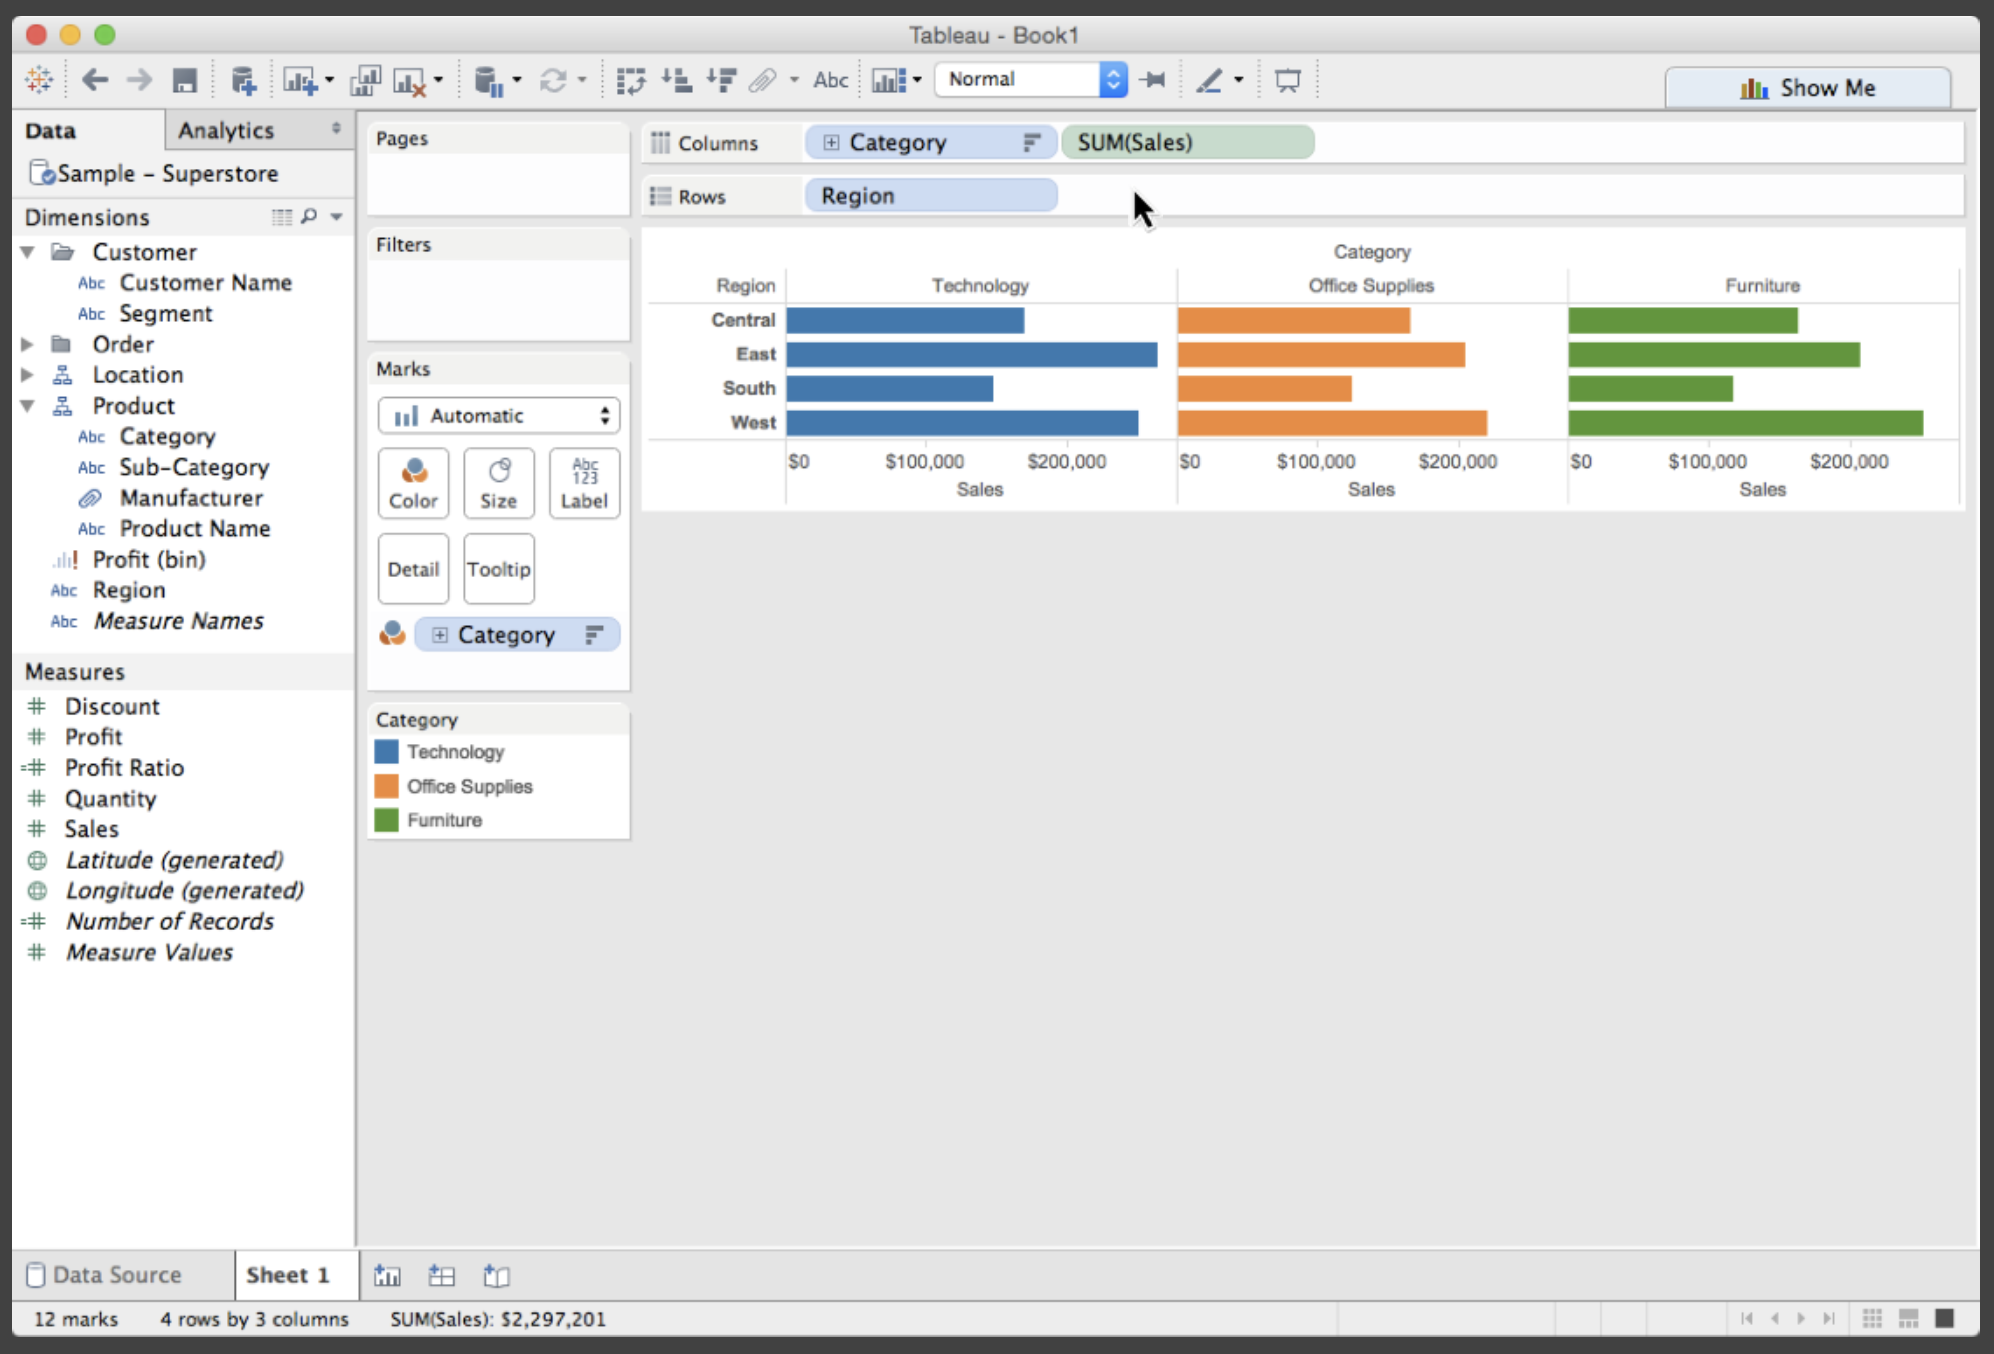
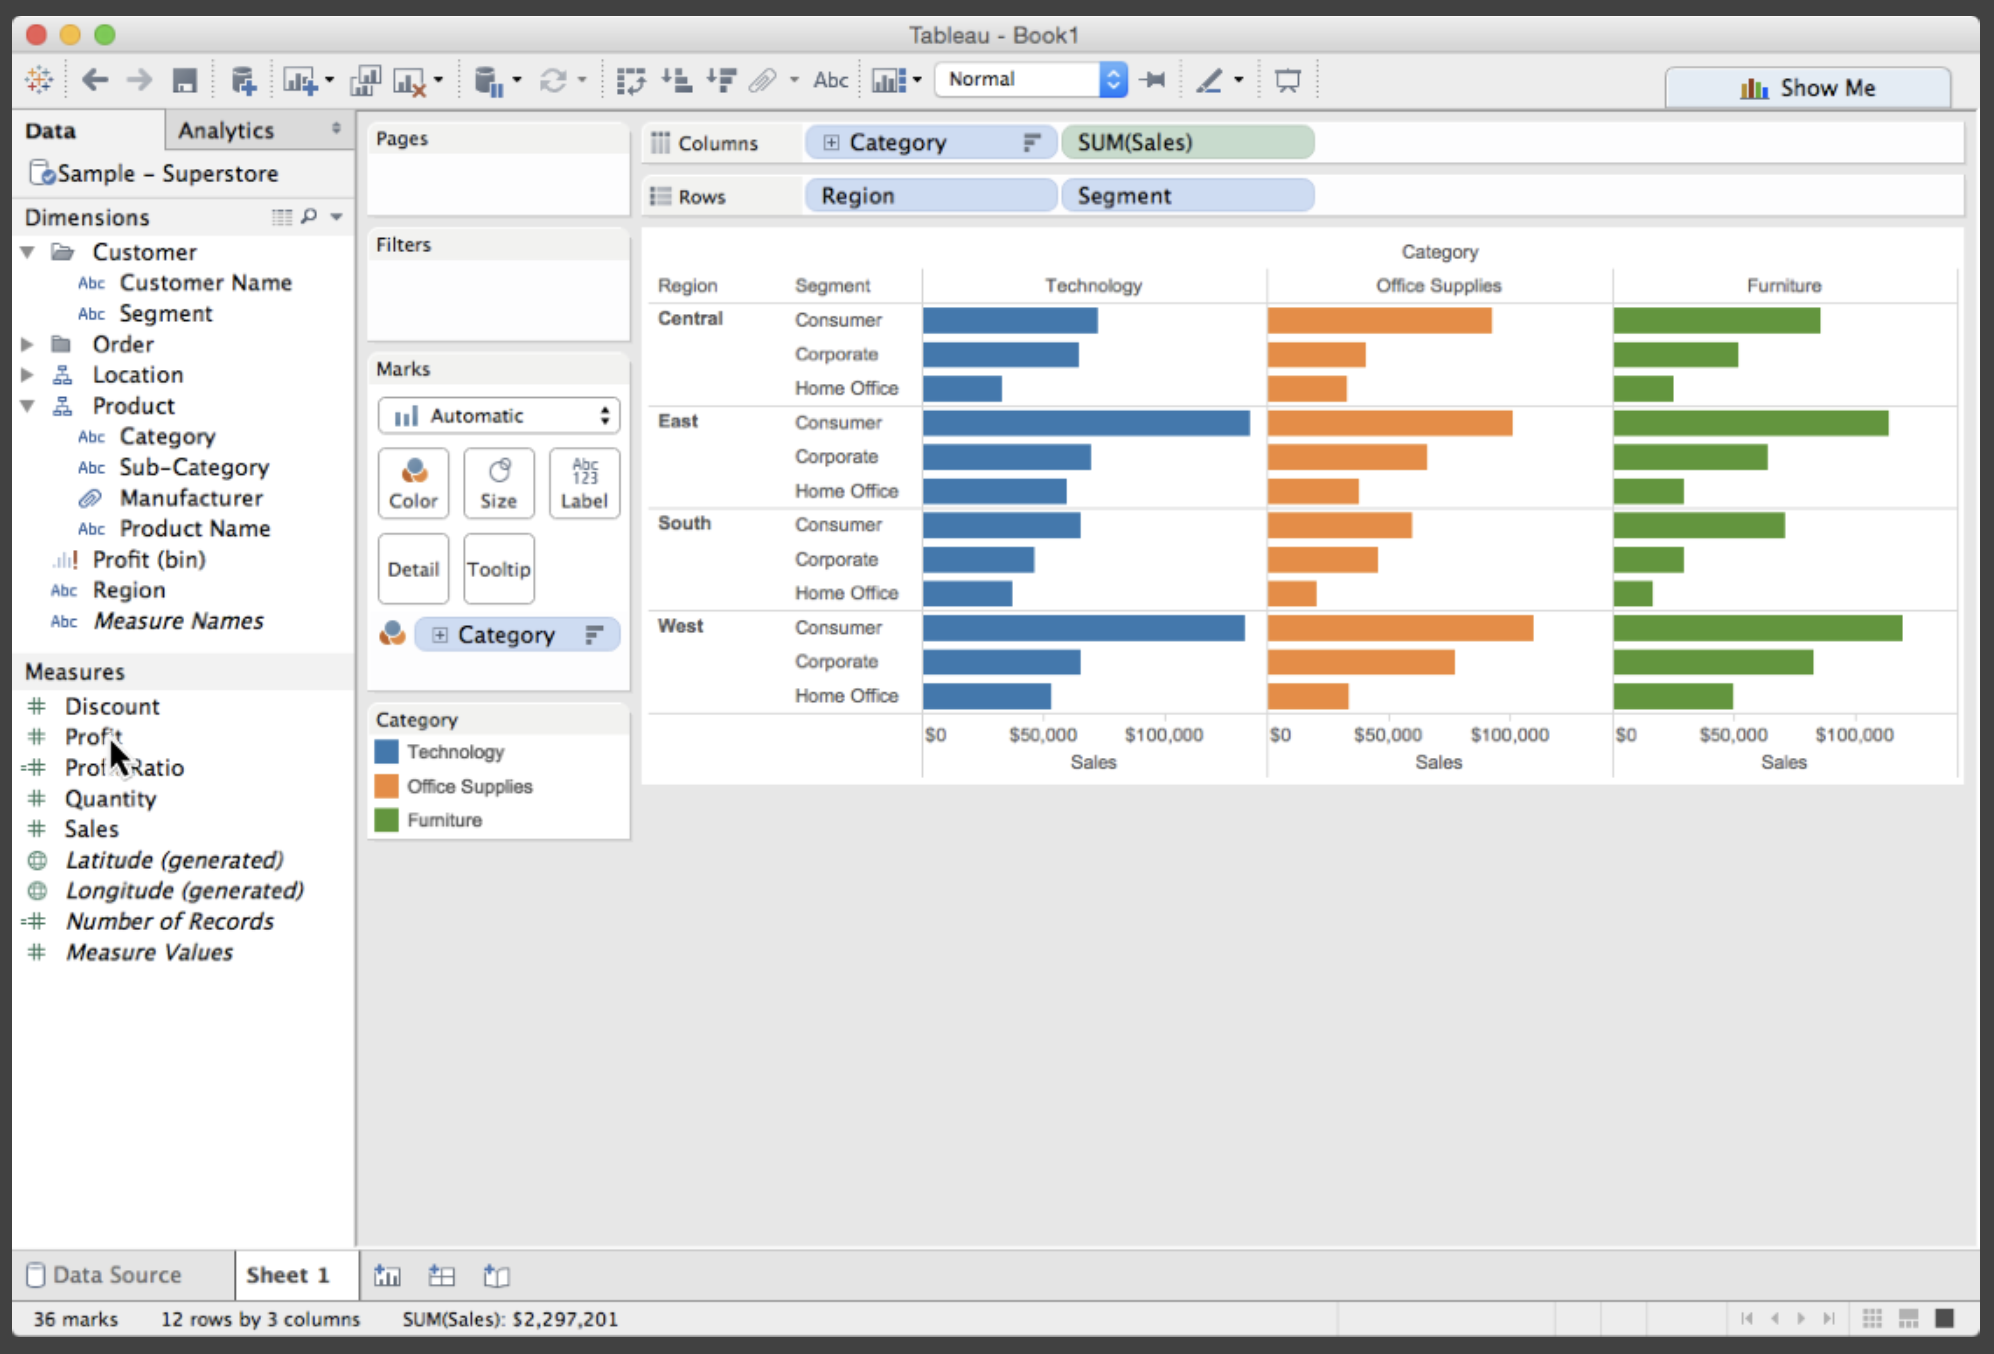
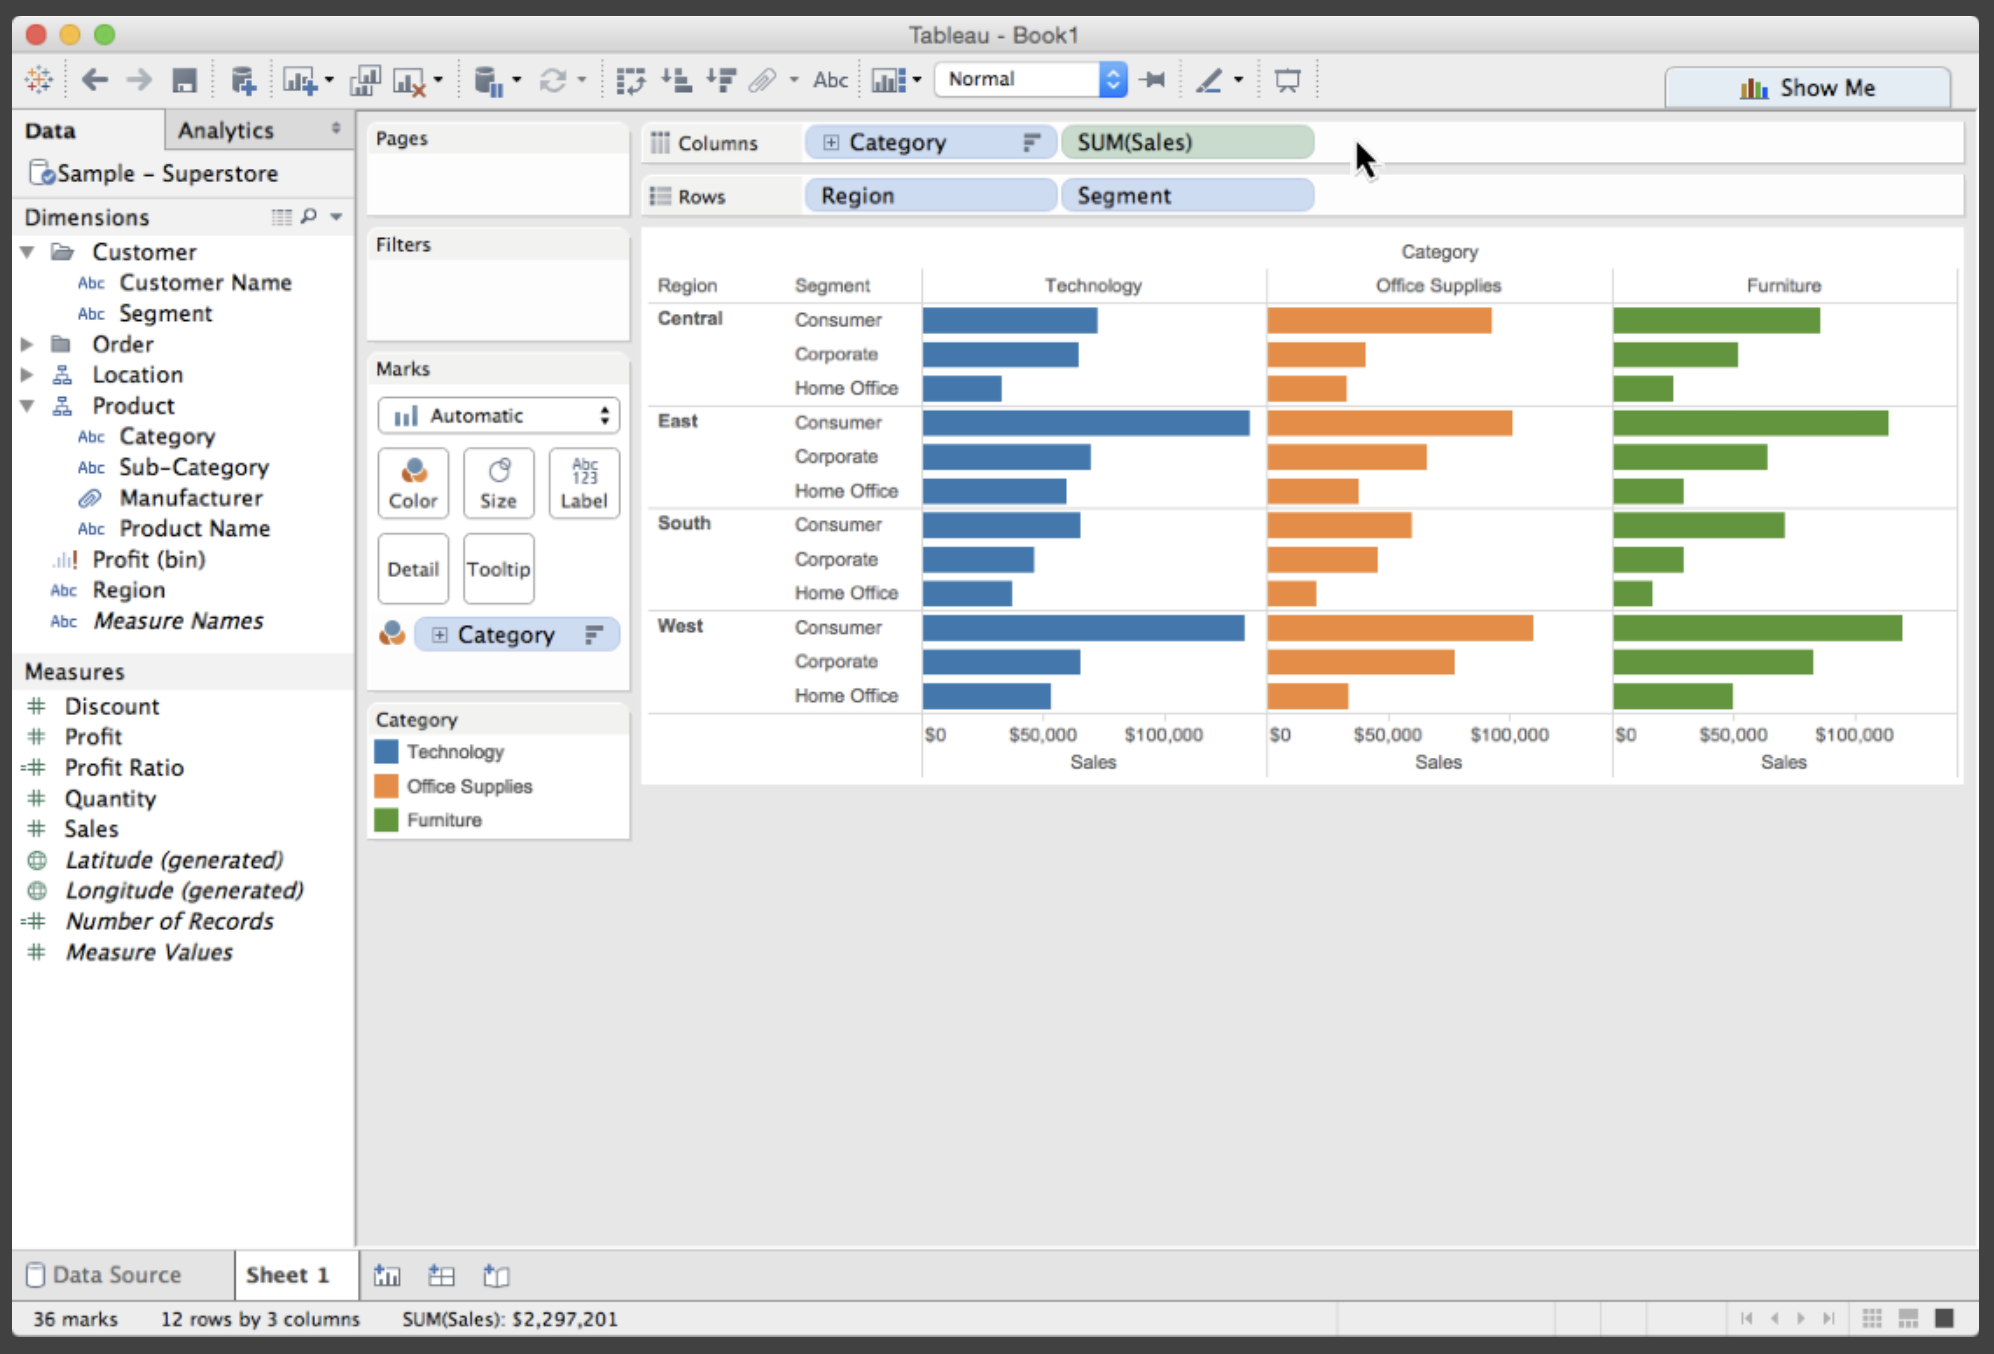
Example: Building in Tableau
- Start with data
- Drag dimensions/measures to shelves
- Assign variables to axes
- Choose mark types and encodings
2. Filter
Reducing the data set based on conditions
- Remove items that don’t meet criteria
- Focus on subset of interest
- Can be applied at data or view level
Example:
- Dynamic query widgets
- Sliders for continuous values
- Check boxes for categories
- Real-time visual feedback
3. Sort
Ordering the data
- Exposes rankings
- Reveals patterns
- Makes comparisons easier
Example:
- Clicking column header in table
- Sorting bars by value
- Ordering timeline by magnitude
- Reordering categorical axes
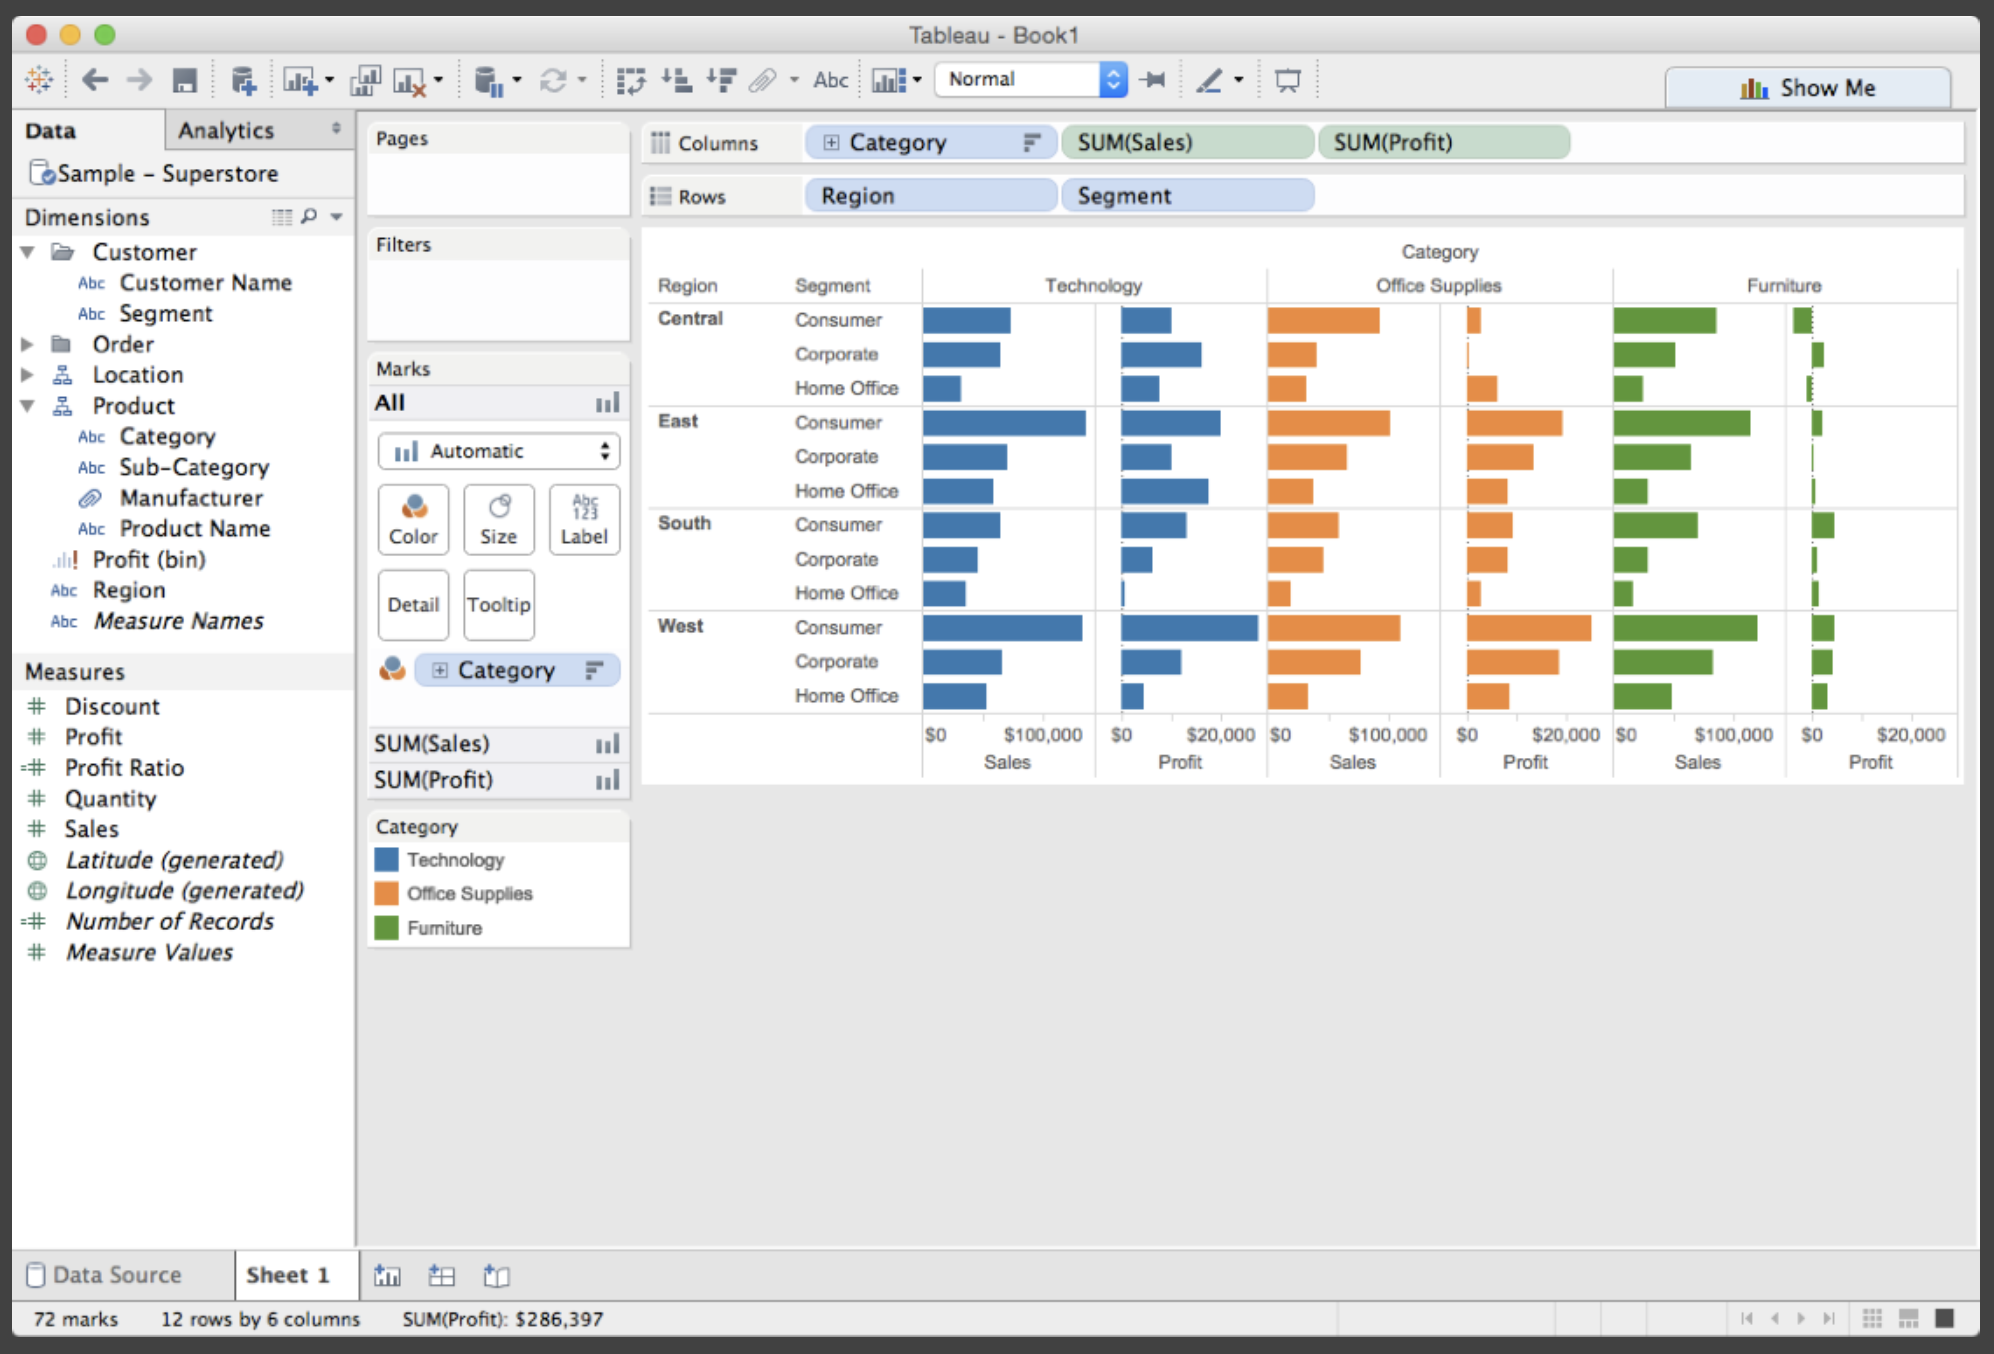
4. Derive
Creating new data from existing data
- Compute new fields
- Transform variables
- Aggregate or summarize
Examples:
- Profit per sale = profit ÷ sales
- Year-over-year change
- Moving averages
- Binning continuous variables
- String manipulations
5. Select
Marking items as having special interest
- Prerequisite for many other actions
- Can be single or multiple items
- Visual feedback is crucial
Interaction Patterns:
- Hover - Temporary highlight
- Click - Single item selection
- Lasso/Brush - Group selection
- Shift-click - Add to selection
6. Navigate
Changing the viewpoint
The “zoom” in Shneiderman’s mantra
Three primary operations:
- Pan - Moving camera side-to-side
- Zoom - Increasing/decreasing magnification
- Rotate - For 3D views
Key distinction: Geometric vs. Semantic Zoom
- Geometric: Just magnification
- Semantic: Level of detail changes

7. Coordinate
Linking multiple views
This is critical!
Actions in one view are reflected in others
Brushing and Linking:
- Select items in one view (e.g., scatterplot)
- They are instantly highlighted in all other views (e.g., map, bar chart)
- Enables multi-perspective exploration
Why powerful? Each view shows different aspects of the same data.
8. Organize
Arranging the workspace
- Resizing windows
- Reordering views in a dashboard
- Creating custom layouts
- Collapsing/expanding panels
Goal: Optimize screen real estate for the current task
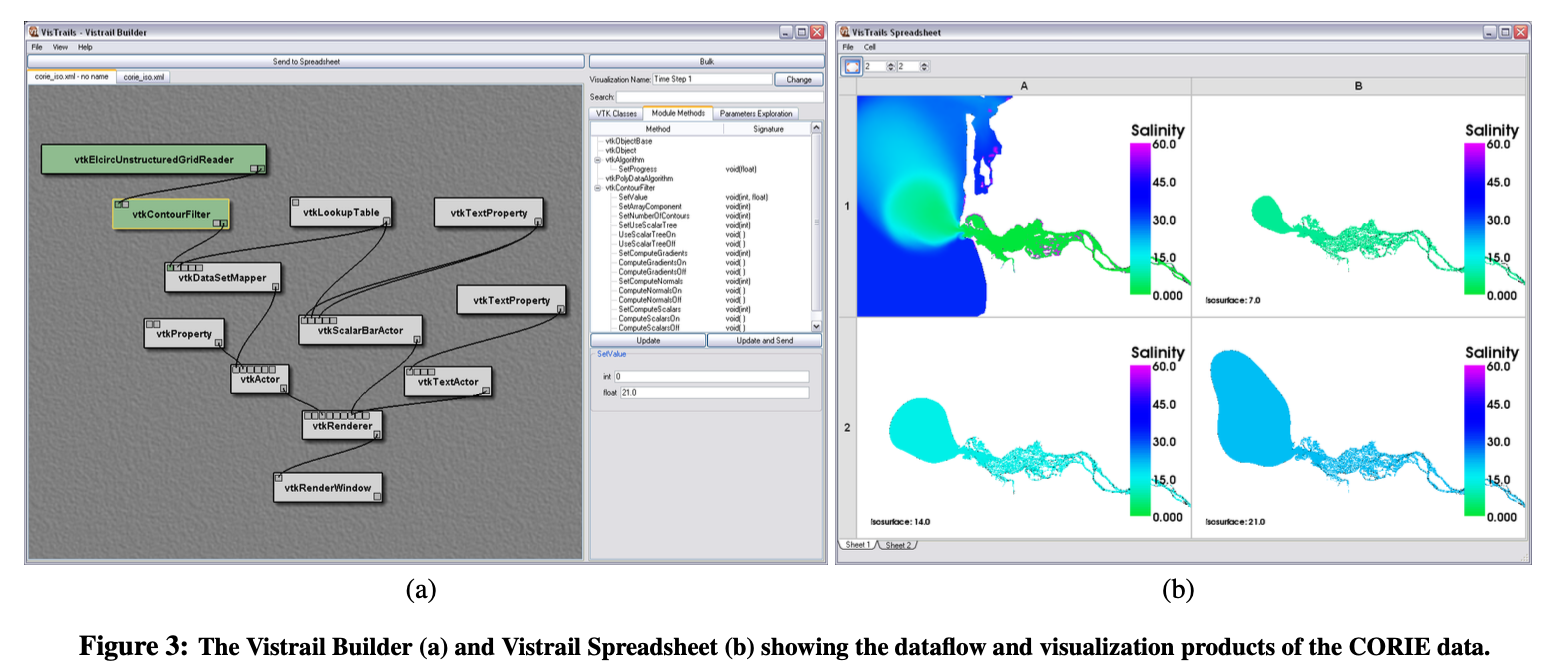
9. Record
Capturing the history of interaction
Why?
- Support undo
- Enable replay
- Show analysis path
- Facilitate review
Examples:
- History panel (like Photoshop)
- Action log
- Version control for visualizations
- Movie generation from interactions
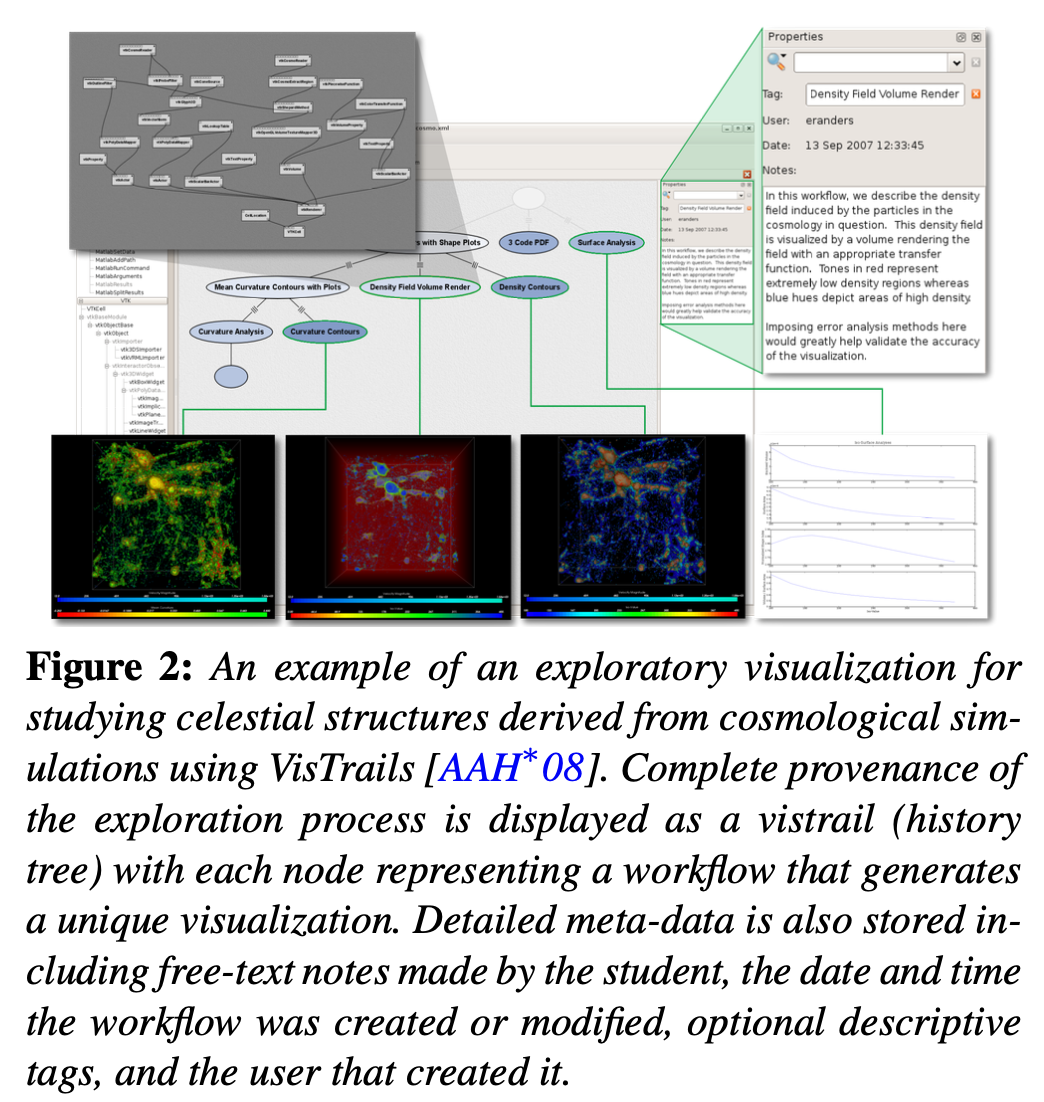
10. Annotate
Adding notes to views
Why?
- Capture insights as they occur
- Communicate findings to others
- Mark important features
- Ask questions for later
Examples:
- Drawing arrows on a chart
- Adding text boxes
- Highlighting regions
- Tagging interesting points
11. Share
Sharing views and analysis sessions
Why?
- Enable collaboration
- Disseminate findings
- Get feedback
- Support team analysis
Examples:
- Shareable links to interactive dashboards
- Embedded visualizations
- Exporting views with interaction intact
- Collaborative workspaces
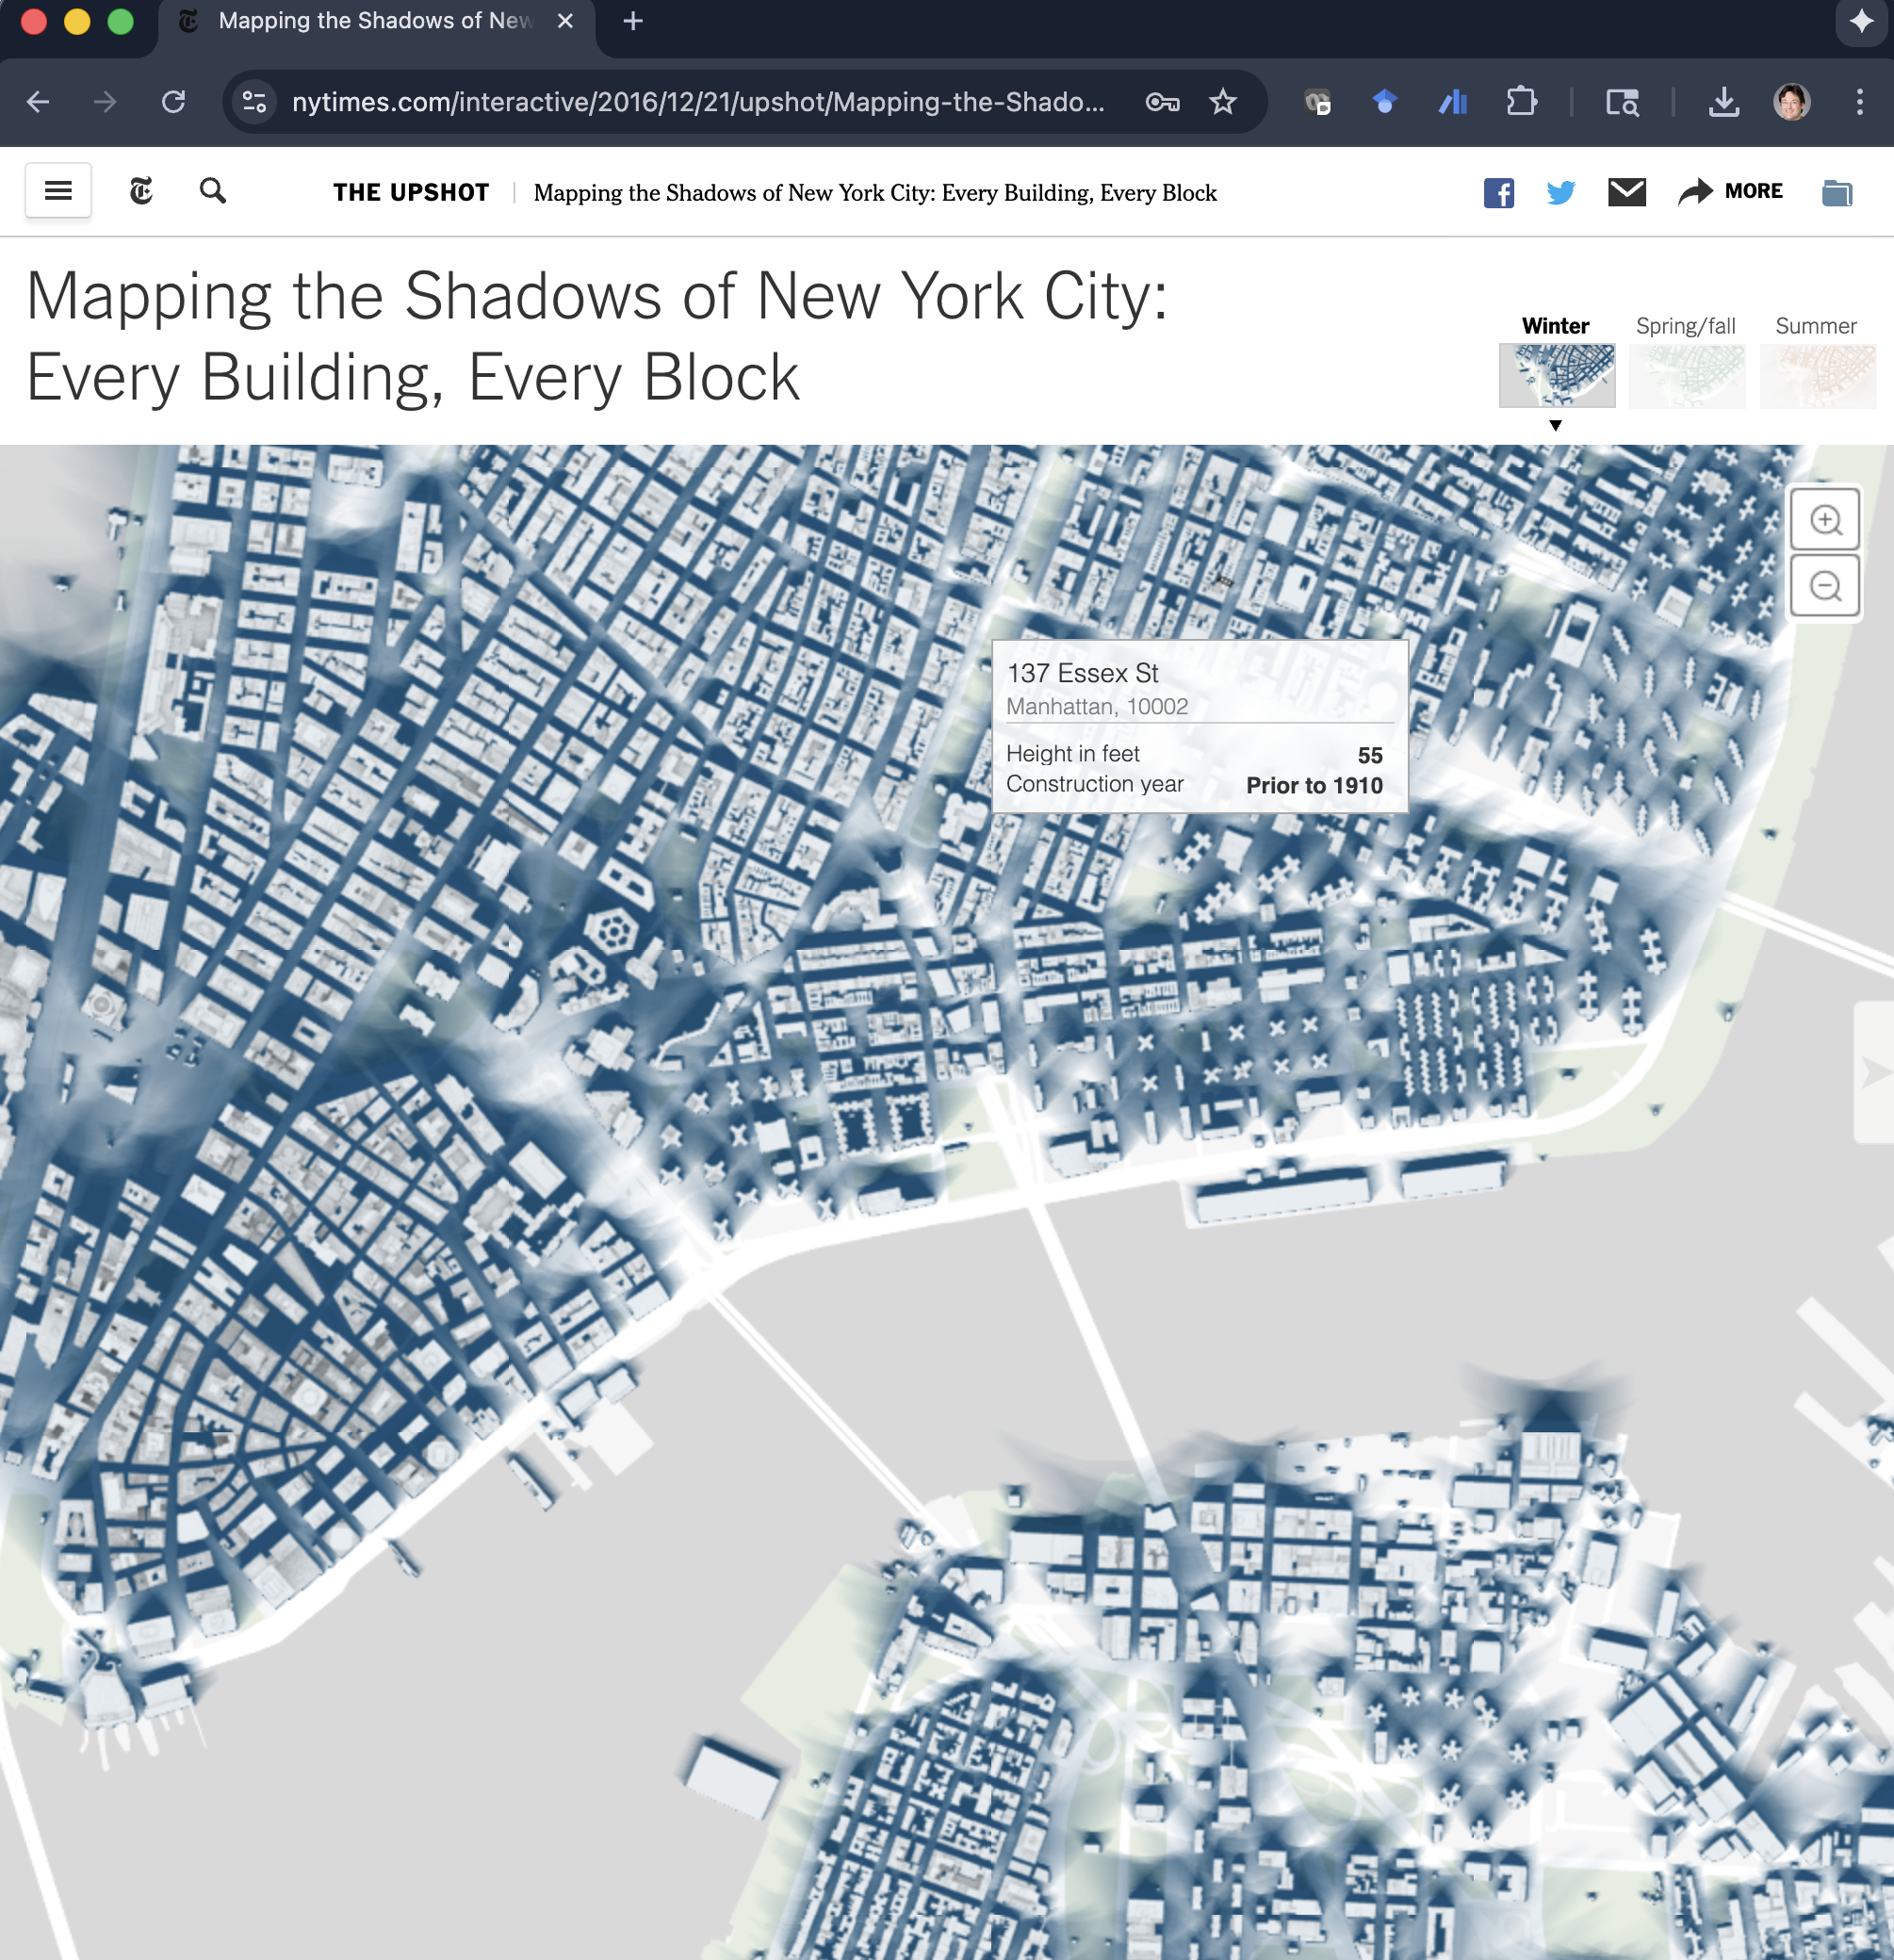
12. Guide
Leading an audience through a story
Examples:
- Scrollytelling websites
- New York Times interactive articles
- Animated, progressive revelation
- Guided tutorials
- Step-by-step walkthroughs
- Tooltips and contextual help
- Progressive disclosure of features
Balance: Author-driven narrative ↔︎ Reader-driven exploration
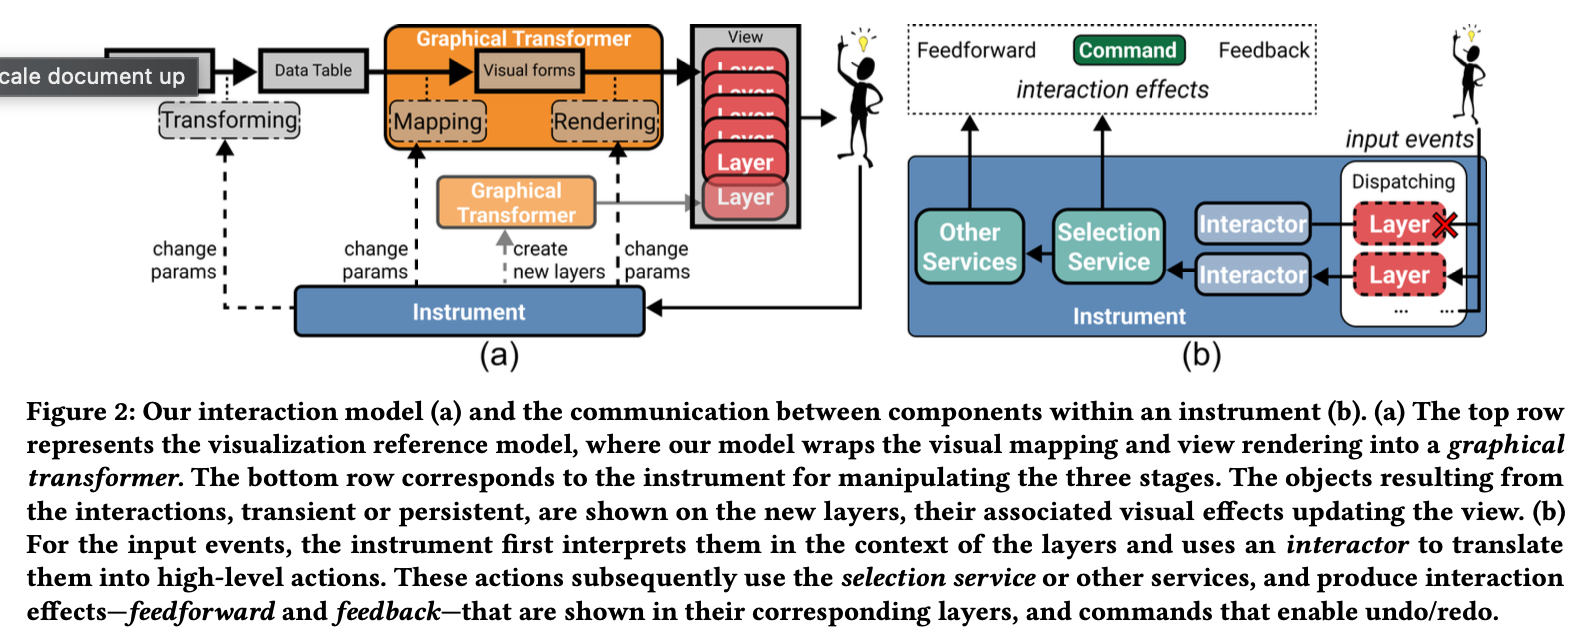
Case Study: The Libra Interaction Model
Zhao et al., CHI 2025
The Goal:
- Separate interaction logic from visualization rendering
- Create a “grammar of interaction”
- Just like we have a “grammar of graphics”
The Core Idea:
Break interactions down into reusable components:
- Instruments: Basic user inputs (Hover, Click, Drag)
- Services: Data operations (Filter, Select, Transform)
Libra Example: Building Interactions
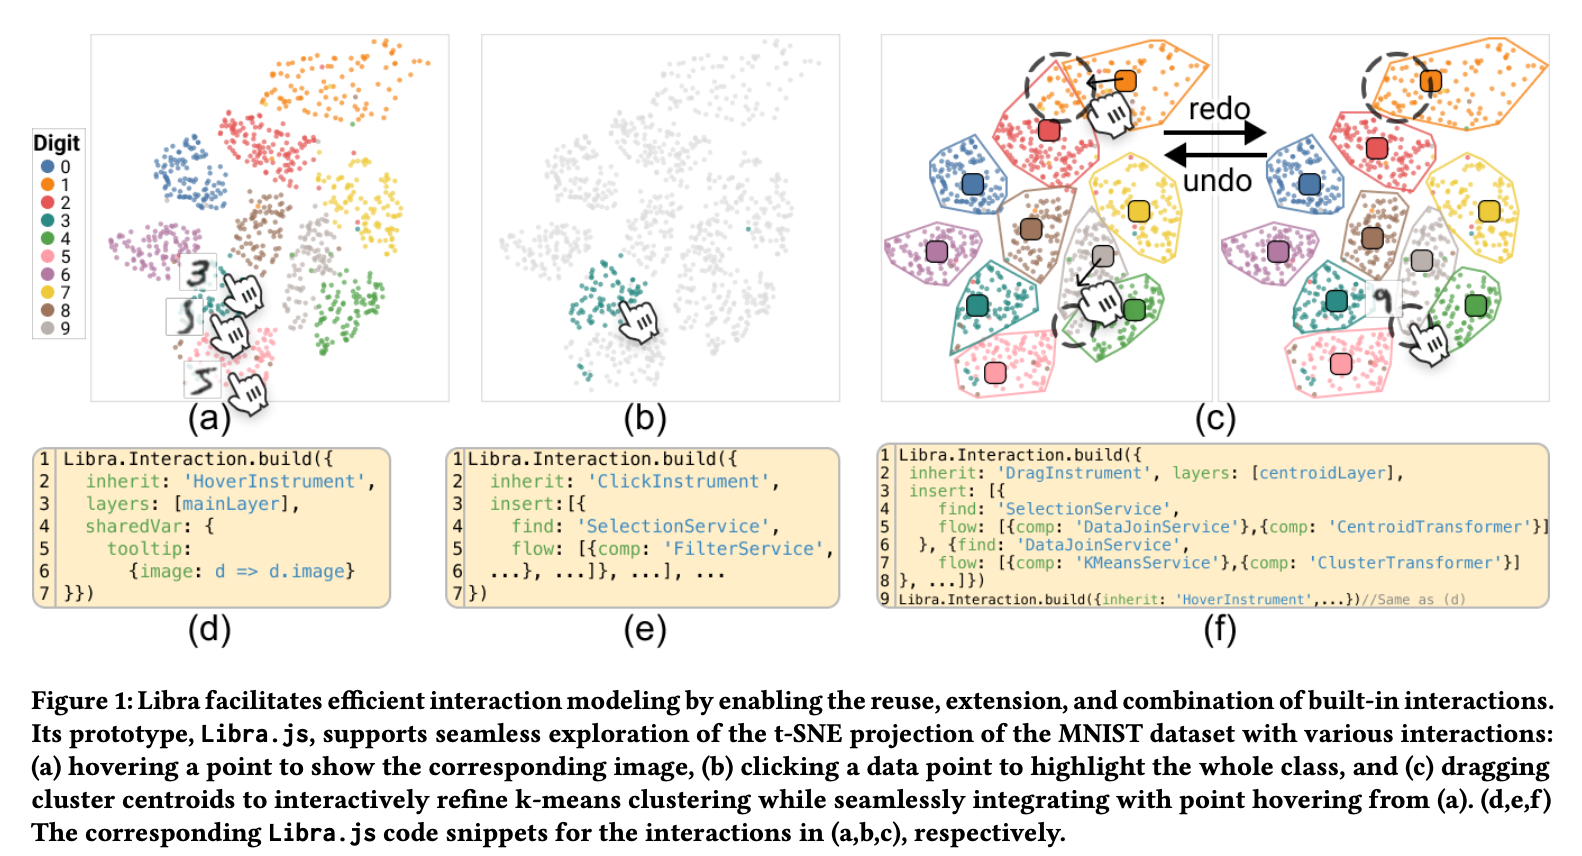
Figure 1 from Zhao et al.: Progressive composition of interactions in Libra
- Step 1 (Fig 1d): Simple
HoverInstrumentshows tooltip with digit image - Step 2 (Fig 1e): Add
ClickInstrument+SelectionServiceto highlight clicked points - Step 3 (Fig 1f): Add
DragInstrument+KMeansServicefor complex cluster analysis - Result: Complex interaction built by combining simple, reusable parts
